báo cáo khoa học: " Restricted cell elongation in Arabidopsis hypocotyls is associated with a reduced average pectin esterification level" ppsx
Bạn đang xem bản rút gọn của tài liệu. Xem và tải ngay bản đầy đủ của tài liệu tại đây (700.03 KB, 12 trang )
BioMed Central
Page 1 of 12
(page number not for citation purposes)
BMC Plant Biology
Open Access
Research article
Restricted cell elongation in Arabidopsis hypocotyls is associated
with a reduced average pectin esterification level
Paul Derbyshire
1
, Maureen C McCann
2
and Keith Roberts*
3
Address:
1
Department of Metabolic Biology, John Innes Centre, Colney Lane, Norwich, NR4 7UH, UK,
2
Department of Biological Sciences, Purdue
University, West Lafayette, IN 47907, USA and
3
Department of Cell and Developmental Biology, John Innes Centre, Colney Lane, Norwich, NR4
7UH, UK
Email: Paul Derbyshire - ; Maureen C McCann - ;
Keith Roberts* -
* Corresponding author
Abstract
Background: Cell elongation is mainly limited by the extensibility of the cell wall. Dicotyledonous
primary (growing) cell walls contain cellulose, xyloglucan, pectin and proteins, but little is known
about how each polymer class contributes to the cell wall mechanical properties that control
extensibility.
Results: We present evidence that the degree of pectin methyl-esterification (DE%) limits cell
growth, and that a minimum level of about 60% DE is required for normal cell elongation in
Arabidopsis hypocotyls. When the average DE% falls below this level, as in two gibberellic acid (GA)
mutants ga1-3 and gai, and plants expressing pectin methyl-esterase (PME1) from Aspergillus
aculeatus, then hypocotyl elongation is reduced.
Conclusion: Low average levels of pectin DE% are associated with reduced cell elongation,
implicating PMEs, the enzymes that regulate DE%, in the cell elongation process and in responses
to GA. At high average DE% other components of the cell wall limit GA-induced growth.
Background
Young, dividing and expanding cells are surrounded by an
extensible primary wall that can allow turgor-driven
increases in cell volume. In dicotyledonous plants, pri-
mary cell walls are composed of two major interpenetrat-
ing polysaccharide networks of cellulose-xyloglucan and
pectin, in roughly equal proportions, but the contribution
that each polymer class makes to wall extensibility is not
yet understood.
The cellulose-xyloglucan network is considered to be the
major load-bearing structure [1,2]. Cellulose microfibrils
are generally oriented perpendicular to the direction of
cell expansion and, because of their tensile strength,
define an axis of growth by limiting radial expansion [3].
Breaking and reforming of the xyloglucan chains, that
inter-connect cellulose microfibrils, by wall glucanases [4]
and xyloglucan-endotransglycosylases (XETs) [5,6], and/
or disruption of attachment sites between cellulose and
xyloglucan by expansins [7], may then promote longitudi-
nal growth through slippage of the microfibrils. However,
little is known about how the surrounding pectin matrix
might play a role in this process, either independently or
in concert with the cellulose-xyloglucan network. A
unique property of pectin is its ability to form gels with
varying mechanical strength. Removal of methyl-esters
Published: 17 June 2007
BMC Plant Biology 2007, 7:31 doi:10.1186/1471-2229-7-31
Received: 14 February 2007
Accepted: 17 June 2007
This article is available from: />© 2007 Derbyshire et al; licensee BioMed Central Ltd.
This is an Open Access article distributed under the terms of the Creative Commons Attribution License ( />),
which permits unrestricted use, distribution, and reproduction in any medium, provided the original work is properly cited.
BMC Plant Biology 2007, 7:31 />Page 2 of 12
(page number not for citation purposes)
from the pectic galacturonic acid residues by pectin
methyl-esterase (PME) [8] creates negatively charged
regions of the homogalacturonan (HG) backbone.
Depending upon the extent and pattern of de-esterifica-
tion, these can coordinate with divalent metal ions such as
calcium and promote cross-links [9,10], or generate swell-
ing forces through mutual electrostatic repulsion [11].
These two forces exert opposing effects but can have a
major influence over the gelling properties of pectin, and
a profound effect on wall extensibility. Indeed, the spatial
variation in methyl-esterification levels at intercellular
spaces suggests that HG has an in vivo mechanical role
within the cell wall [12] and contributes to the mechani-
cal properties to the wall. Rhamnogalacturonan II-borate
di-di-ester cross-links have also been shown to be load-
bearing in tensile strength assays of Arabidopsis hypocotyls
[13].
Methyl, acetyl, phenolic and other unidentified ester link-
ages in varying proportions represent the ester content of
HG, and a relationship between primary wall pectin ester-
ification and cell expansion has been described in a vari-
ety of systems. An early study, using ruthenium red to
stain negatively charged carboxyl groups of HG, showed
the stain was strongest in the basal part of sunflower (Heli-
anthus annuus) hypocotyls, where cell elongation had
slowed or stopped, whereas further up the hypocotyl, cells
continued to elongate and ruthenium red staining was rel-
atively weaker [14]. Similarly, along the axis of mung
bean (Vigna radiata) hypocotyls, elongating regions have
elevated levels of highly methyl-esterified pectins, in con-
trast to basal regions that have stopped growing and con-
tain fewer esterified HG residues [15]. Highly methyl-
esterified regions also have walls that are more plastic,
with reduced PME activity, as opposed to mature, stiffer
walls at the base of the hypocotyl where PME activity is
higher [16]. More recently, direct biochemical analysis in
maize (Zea mays) showed that total cell wall ester content
rises during coleoptile elongation and then falls as growth
ceases, but the proportion of methyl-esters is not changed
[17]. Similarly, a sharp rise in methyl-esterification occurs
when tobacco (Nicotiana tabaccum) cell suspension cells
elongate, but is at a lower constant level prior to this [18].
The degree of esterification DE% falls in cells that have
completed the elongation phase, however, methyl-esters
are unchanged and a fall in other esters must account for
the reduced DE%. Thus, in tobacco suspensions, methyl-
esterification levels may regulate the onset of cell elonga-
tion, but are not necessarily involved in cessation of elon-
gation. Likewise, differences in the composition and
architecture of type I and type II cell walls [1] may reflect
the differing roles that alternative ester groups might play
in regulating wall extensibility.
Genetic manipulation of PMEs using over-expression
studies has recently allowed the link between DE% and
cell expansion to be tested further, but has given more
complex results. Potato (Solanum tuberosum) plants over-
expressing a putative PME from Petunia inflata showed
increased PME activity in leaves and tubers but did not
affect DE%, whereas cell wall ion binding capacity was
affected in tubers and yield was reduced [19]. Similarly,
antisense inhibition of a putative PME in pea (Pisum sati-
vum) roots increased extracellular pH and inhibited root
cap border-cell separation leading to stunted root growth,
but effects on DE% were not reported [20]. In contrast,
expression of an Aspergillus niger PME in tobacco reduced
the proportion of methyl-esters in pectin and reduced cell
size, creating dwarf plants [21]. PMEs therefore appear to
have diverse roles in wall metabolism and plant develop-
ment.
The Arabidopsis hypocotyl has been widely used to study
the effects of light and hormones on plant growth
responses [22,23]. It is also an appropriate system in
which to study cell elongation, since it grows almost
exclusively by cell expansion and is essentially division-
free [24-26]. In this paper, we use two well-characterised
gibberellic acid (GA) mutants to identify cell wall compo-
sitional changes that may be related to the inhibition of
hypocotyl elongation. The GA-deficient ga1-3 is a loss of
function mutant in the GA1 gene which encodes an
enzyme involved in GA biosynthesis [27-29]. As a result,
ga1-3 has reduced amounts of GA [30] and is severely
dwarfed, but can be rescued by an exogenous supply of
GA [29]. The semi-dominant gai mutant has a similar
dwarf phenotype to ga1-3 but cannot be rescued by exog-
enous GA [31]. GAI is a member of the DELLA family of
putative transcription factors, key components of GA-sig-
nalling [32]. GAI and other members of this family (RGA/
RGL) act as repressors of plant growth, but are themselves
repressed in the presence of endogenous GAs [33,34].
Thus, in ga1-3 all DELLA proteins are active. In gai, a 17
amino acid deletion in the DELLA region of GAI alters the
structure and function of the protein such that it can no
longer be repressed by GA [33,35].
Using these two mutants, and particularly the conditional
rescue of cell elongation by GA in the ga1-3 mutant, we
show that active cell elongation is associated with a higher
average level of pectin esterification. If DE% is reduced by
the over-expression of a well-characterised fungal PME,
then cell elongation is decreased.
Results
Hypocotyl growth kinetics in two dwarf GA mutants
ga1-3 provides a system in which cell elongation in the
hypocotyl can be rescued conditionally by exogenous
application of GA, while gai provides a control for the
BMC Plant Biology 2007, 7:31 />Page 3 of 12
(page number not for citation purposes)
effects of exogenous GA application. Hypocotyl growth
kinetics in wild-type (WT) (Ler), ga1-3, and gai seedlings
were established in a continuous light environment with
plates positioned horizontally. Hypocotyl growth was
measured during a period of 10 d after the culture plates
were transferred to the growth room, in the presence and
absence of 1 µM exogenous GA
4
(Figure 1A), a concentra-
tion that restores hypocotyl length of ga1-3 to WT length
[36]. In the absence of exogenous GA, WT hypocotyls
elongate between 2 and 7 d, and have a final length of
around 2 mm. ga1-3 required an extra day to germinate,
after which hypocotyl elongation was minimal, reaching
only 0.6 mm. gai hypocotyls elongate for up to 6 d, but at
a slower rate than the WT, with a maximum length of
about 1.6 mm. In the presence of exogenous GA, WT
hypocotyls elongate between 2 and 7 d, and have final
lengths of approximately 3.5 mm, and such hypocotyls
grow longer and at a faster rate than without GA. ga1-3
hypocotyls respond to exogenous GA, elongating for up to
7 d, with final lengths of around 3 mm. Finally, gai does
not respond to exogenous GA, having the same hypocotyl
growth kinetics and final length as in the absence of the
growth regulator, thus confirming its insensitivity to GA.
These results are consistent with those reported previously
[36]. However, in our analysis, final hypocotyl lengths are
shorter, probably as a consequence of the inhibitory
effects of the continuous light regime used.
Our analysis of WT, ga1-3, and gai hypocotyls and their
cell walls used material taken at an equivalent develop-
mental stage; in our case defined as approximately 50% of
final hypocotyl length, estimated from the growth curves
in Figure 1A and indicated by arrows. This was set at 3 d,
both in the presence and absence of GA. However, for ga1-
3, in the absence of GA, hypocotyls barely grow following
germination. Therefore we analysed hypocotyls at 3 d, the
earliest time point following germination. The general
morphology of 3-d-old seedlings of average hypocotyl
length is shown in Figure 1B. In the absence of exogenous
GA, WT hypocotyls are approximately 1 mm long, but are
almost twice as long (1.8 mm) when grown in the pres-
ence of exogenous GA. In contrast, ga1-3 seedlings are
severely dwarfed with hypocotyls at approximately 0.5
mm in length. When grown in the presence of exogenous
GA, ga1-3 hypocotyl length is restored to that of untreated
WT. In the absence of GA, gai seedlings have slightly
shorter hypocotyls than WT, at about 0.8 mm, and are
unaffected by exogenous GA. GA-regulation of hypocotyl
growth is mediated through elongation of the pre-existing
cells with little or no contribution from cell division [36].
To test whether continuous light affects this process, epi-
dermal cells were imaged with a field-emission scanning
electron microscope (FESEM) (Figure 1B). In the absence
of exogenous GA, WT epidermal cells are almost twice as
long as those of ga1-3, while gai epidermal cells are
slightly shorter than WT. In the presence of exogenous
GA, WT epidermal cells approximately double in length,
ga1-3 epidermal cell length is increased 2 to 3 fold and gai
epidermal cell length is unchanged. The relative differ-
ences in epidermal cell length closely match the relative
differences in hypocotyl length. As the same relative dif-
ferences in cell length have also been observed in the cor-
tical and endodermal layers [37], the differences in
hypocotyl length are likely to reflect differences in cell
length and therefore in cell elongation.
Fourier Transform Infrared (FTIR) microspectroscopy of
WT and mutant hypocotyls
FTIR microspectroscopy has been used to measure the
composition of plant cell walls [38-40]. Small areas of tis-
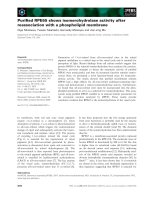
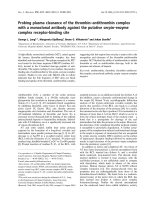
Growth kinetics and hypocotyl cell elongation in WT (Ler), ga1-3, and gai seedlings grown with and without exogenous gibberellic acid (GA)Figure 1
Growth kinetics and hypocotyl cell elongation in WT
(Ler), ga1-3, and gai seedlings grown with and with-
out exogenous gibberellic acid (GA). (A) Seedlings were
grown in continuous light for 10 d with plates in a horizontal
position and hypocotyl growth measured over this period.
Measurements are an average taken from 5 to 15 seedlings ±
SE for each time point. Arrows indicate time (3 d) at which
hypocotyls were at approximately 50% of their final length.
(B) Light micrographs showing phenotypes of 3-d-old seed-
lings described in (A) (left panel for each treatment), bar = 1
mm, and FESEM micrographs of hypocotyl epidermis (right
panel for each treatment), bar = 25 µm.
BMC Plant Biology 2007, 7:31 />Page 4 of 12
(page number not for citation purposes)
sue can be selected for analysis, and other advantages
include the speed of both sample preparation and data
collection. We used FTIR microspectroscopy to quickly
ascertain if DE% was associated with dwarfism in primary
cell walls of Arabidopsis hypocotyls. Spectra were collected
from a 200 × 100 µm area in the central region along the
length of WT and ga1-3 hypocotyls, grown in the presence
and absence of exogenous GA and at the developmental
stages indicated in Figure 1B. The central stele was avoided
to prevent contamination from secondary cell wall com-
ponents. For each population of hypocotyls, DE% was
determined semi-quantitatively based on the method
described by Filippov and Kohn [41]. Table 1 shows cell
walls of WT hypocotyls have a DE of about 60% when
grown both in the presence and absence of GA. In con-
trast, DE is lowest in walls of ga1-3 hypocotyls grown
without GA, at about 40%, but rises to around 55% when
grown in the presence of GA. Thus, GA-promoted cell
elongation in ga1-3 hypocotyls is associated with a corre-
sponding rise in DE%.
Biochemical analysis of hypocotyl cell walls
To more accurately determine pectin DE%, we measured
HG content as uronic acid, and methyl-ester content as
the amount of methanol released, at the developmental
stages described in Figure 1B. Average hypocotyl lengths
used in all experiments are shown in Figure 2A. When
grown without exogenous GA, WT (Ler) hypocotyls meas-
ured 1.06 ± 0.02 mm, and increased to 1.74 ± 0.02 mm in
the presence of GA. Dwarf ga1-3 hypocotyls were 0.55 ±
0.02 mm but increased to 1.31 ± 0.03 mm with exogenous
GA. Finally, gai hypocotyls measured 0.82 ± 0.01 and 0.86
± 0.01 mm, when grown without or with GA respectively.
Uronic acid and methanol content are expressed as
amount per hypocotyl. Since hypocotyl growth is essen-
tially division-free, a change in the amount of a particular
wall component can be correlated primarily to cell elon-
gation.
When grown in the absence or presence of GA, WT uronic
acid content was 2.31 ± 0.09 and 2.43 ± 0.10 nmol per
hypocotyl, respectively, and so was not significantly dif-
ferent between the two treatments (Figure 2B). In ga1-3
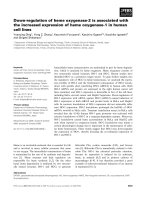
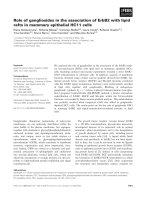
Effects of gibberellic acid (GA) on degree of esterification (DE%) in WT (Ler), ga1-3 and gai hypocotyl cell wallsFigure 2
Effects of gibberellic acid (GA) on degree of esterifi-
cation (DE%) in WT (Ler), ga1-3 and gai hypocotyl
cell walls. (A) Hypocotyl length at time of excision in 3-d-
old seedlings. Measurements are an average of 40 to 90
hypocotyls ± SE for each genotype and treatment. (B) Uronic
acid content and methyl ester content (measured as metha-
nol) in walls of hypocotyls in (A). Each assay was performed
on 50 to 100 hypocotyls for each genotype/treatment and
repeated at least once in each experiment. Each experiment
was performed three times. Amount of uronic acid and
methanol was converted to nmol per hypocotyl in each repli-
cate assay and the total values pooled. Measurements are the
average of 6 to 9 replicates ± SE for each genotype and treat-
ment. (C) Degree of methyl-esterification (DE%) in walls of
hypocotyls in (A). Values in (B) (including SE) were ratioed
(methanol to uronic acid) to give DE%.
Table 1: Semi-quantitative determination of DE% in WT and
ga1-3 hypocotyl cell walls.
semi-quantitative DE%
genotype no GA 1 µM GA
Ler (WT) 62.2 ± 1.3 57.1 ± 2.0
ga1-3 39.7 ± 2.9 53.4 ± 1.9
DE% was derived from FTIR spectra (n = 10 to 28) for each
genotype/treatment based on the method of Filippov and Kohn [41].
Average values are given ± SE.
BMC Plant Biology 2007, 7:31 />Page 5 of 12
(page number not for citation purposes)
hypocotyls, grown without GA, the values were lower
than WT, measuring 2.00 ± 0.16 nmol per hypocotyl, and
was unchanged at 2.10 ± 0.11 nmol per hypocotyl when
grown in the presence of GA. gai hypocotyls contained the
lowest amount of uronic acid, at 1.81 ± 0.04 and 1.75 ±
0.09 nmol per hypocotyl when grown without or with GA
respectively. As with WT and ga1-3, GA did not affect the
uronic content of gai hypocotyls. GA also did not signifi-
cantly affect methanol released in WT. In the absence of
GA, methanol released was 1.38 ± 0.04 nmol per
hypocotyl. When grown in the presence of exogenous GA,
methanol released from WT was 1.44 ± 0.03 nmol per
hypocotyl. Therefore, GA affected the amount of neither
uronic acid nor methanol released in WT cell walls, even
though hypocotyl length increased almost two-fold over
the same period of growth. In contrast, GA increased the
amount of methanol released from ga1-3 cell walls, rising
from 0.97 ± 0.08 nmol per hypocotyl in the absence of
exogenous GA, to 1.23 ± 0.06 nmol per hypocotyl when
grown in the presence of GA. GA-stimulated growth there-
fore correlates with an increase in cell wall methyl-esteri-
fication. Finally, gai hypocotyls contained similarly
reduced amounts of methanol to ga1-3, at 0.97 ± 0.05
nmol per hypocotyl when grown without GA, and was not
significantly altered with GA, at 0.91 ± 0.04 nmol per
hypocotyl.
The ratio of methanol to uronic acid content was used to
calculate DE% (Figure 2C). In WT hypocotyls this was
60.04 ± 2.23% and 59.08 ± 2.31% in the absence and
presence of exogenous GA, respectively. GA therefore pro-
motes cell elongation and hypocotyl growth in WT but
does not affect DE%. In contrast, GA did affect DE% in
ga1-3 hypocotyls. In the absence of exogenous GA, DE
was 48.23 ± 4.00%, rising to 58.89 ± 3.12% when grown
in the presence of GA. GA-stimulated growth in the dwarf
ga1-3 hypocotyls therefore correlated with the recovery of
DE% to WT levels in this mutant. In the semi-dwarf
hypocotyls of gai, DE was 53.91 ± 1.08 and 52.25 ± 2.52%
when grown either without or with GA, respectively. A
correlation therefore exists, between hypocotyl length and
DE%. The shortest hypocotyls of ga1-3 have the lowest
DE%, but stimulation of hypocotyl extension by GA also
increases DE% to the WT level. gai hypocotyl length is
intermediary between ga1-3 and WT regardless of GA, as
is the measured DE% in this mutant.
In summary, an increase in hypocotyl length, and there-
fore cell elongation, is also accompanied by an increase in
DE%. However, enhanced growth of WT induced by GA
does not affect DE%. These data suggest that the degree of
pectin esterification may affect cell elongation in a GA-
deficient and GA-insensitive background.
Heterologous PME expression reduces hypocotyl length
and DE%
To directly test our hypothesis that a low average DE%
may constrain growth, we artificially manipulated DE%
using reverse genetics. Our prediction would be that
reducing the DE% should inhibit hypocotyl elongation.
T-DNA insertions into putative PMEs might in principle
reduce the potential for de-esterification and ionic cross-
linking, leading to an increase in wall extensibility. In Ara-
bidopsis, 67 putative PMEs, in Carbohydrate Esterase Fam-
ily 8, have been identified based on protein sequences
[42]. Therefore, the scope for functional redundancy in
this family is high, and gene knock-outs might not reveal
clear phenotypes. In addition, no PMEs have been bio-
chemically characterised in this species, and some may
actually be pectin trans-esterases [43,44]. For the same
reasons, homologous over-expression of endogenous or
other plant putative PMEs, without biochemical charac-
terisation, may give results that are difficult to interpret
[19,20]. In contrast, several bona fide PMEs have been
reported in bacteria and fungi [45,46]. In Aspergillus
aculeatus, the PME1 gene has been rigorously tested and
biochemically characterised [47]. We therefore trans-
formed the PME1 cDNA clone into Arabidopsis under the
control of a constitutive promoter. Interestingly, constitu-
tive expression of PME1 yielded no transformants and
therefore is probably lethal.
Analysis of the predicted signal peptide region using
pSORT showed a low probability of the PME1 protein
localising to the cell wall in plants. Therefore, we removed
the signal peptide sequence and replaced it with one from
a putative PME from Arabidopsis (At4g12390) that had a
high probability of targeting the protein to the cell wall.
The ethanol-inducible expression system was used [48], in
which the chimeric construct was cloned downstream of
the AlcA promoter, and then transformed into line P5-3
carrying the AlcR promoter. Several independent lines car-
rying the transgene were identified by PCR using gene-
specific primers. To induce expression of the transgene,
seedlings were grown for 3 d in continuous light with
plates in a near vertical position, and then transferred to
induction medium containing 0.1% ethanol in the solid-
ified medium. Transfer at this time point, allowed germi-
nation to take place and hypocotyls to enter the rapid
phase of elongation. Two lines, PME01 and PME08, in
which hypocotyl growth was affected only in the presence
of ethanol, were selected for further analysis.
Hypocotyl growth kinetics are shown in Figure 3. In the
absence of ethanol, P5-3 hypocotyls grew over a period of
6 d, from day 2 to day 8, with a final length of 5.56 ± 0.17
mm (Figure 3A). The concentration of ethanol used to
induce PME1 expression did not affect either the growth
profile or final length of P5-3 hypocotyls, which meas-
BMC Plant Biology 2007, 7:31 />Page 6 of 12
(page number not for citation purposes)
ured 5.77 ± 0.29 mm at day 10. However, compared to
previous experiments (Figure 1A), the duration and extent
of hypocotyl elongation was increased when plates were
positioned vertically, and may be the result of additional
nutrient uptake and/or touch responses from being in
contact with the surface of the growing medium. In the
absence of ethanol, both PME01 and PME08 hypocotyls
followed a similar growth profile as P5-3. Final lengths
were 5.67 ± 0.22 and 5.25 ± 0.21 mm in lines PME01 and
PME08, respectively (Figure 3B, C). However, transfer of
the seedlings to induction medium resulted in a deflec-
tion of the growth curve for both expressing lines.
Hypocotyls stopped growing about 1 d earlier, and final
lengths were 4.63 ± 0.24 and 4.27 ± 0.23 mm, respec-
tively, representing a length reduction of about 20%.
Transcriptional and cell wall analysis was performed on
excised hypocotyls after 2 d growing on control/induction
medium (arrows in Figure 3). At this time point (day 5),
the A. aculeatus PME was strongly expressed in both lines
when grown in the presence of ethanol, whereas no
expression was detected in seedlings grown on ethanol-
free medium or in P5-3 (Figure 4). Expression was
stronger in line PME08 compared to PME01. Both paren-
tal lines had reduced seed yield, which may be a conse-
quence of auto-induced PME1 expression during seed set,
and/or during pollen tetrad separation, the latter involv-
ing PME [49]. Thus, it was difficult to collect enough
transgenic hypocotyls for direct chemical analysis. There-
fore, to confirm that the growth effects were due to pectin
de-esterification, we again used FTIR microspectroscopy
of individual hypocotyls to measure DE% indirectly
(Table 2). At this time point, hypocotyl lengths in P5-3
were 4.52 ± 0.19 and 4.46 ± 0.30 mm when grown in the
absence and presence of ethanol, respectively. In the
absence of ethanol, PME01 hypocotyls were 4.25 ± 0.19
mm long, compared to 3.60 ± 0.24 mm when grown on
induction medium. Similarly, PME08 hypocotyls were
4.08 ± 0.33 and 3.15 ± 0.29 mm after 2 d growth on con-
trol and induction medium, respectively. Induced expres-
sion of PME1 therefore corresponded to a 15% reduction
in average hypocotyl length in line PME01, and a 22%
reduction in line PME08, compared to non-induced seed-
lings. DE in P5-3 hypocotyls was about 48% in the
absence of ethanol, and about 45% in the presence (Table
2). In line PME01, DE was about 48% in the absence of
ethanol, but only about 40% following induction. In line
PME08, DE was about 42% in the absence of ethanol, and
reduced to about 38% when induced. The overall reduc-
tion in DE in P5-3, from about 60% (Table 1) to about
48% (Table 2), may be due to the slowing down of
hypocotyl elongation at day 5, as opposed to day 3 when
they are growing fastest. Nevertheless, the lowest DE% we
measured, in both lines, followed PME1 induction. In
summary, PME1 expression corresponded to a reduction
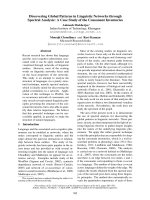
Growth kinetics and hypocotyl cell elongation in P5-3, PME01, and PME08 seedlingsFigure 3
Growth kinetics and hypocotyl cell elongation in P5-
3, PME01, and PME08 seedlings. Seedlings were grown
in continuous light for 10 d with plates in a near vertical posi-
tion and hypocotyl growth measured over this period. Meas-
urements are an average taken from 12 to 20 seedlings ± SE
for each time point. After 3 d seedlings were transferred to
control medium, or induction medium containing 0.1% (v/v)
ethanol. Arrows indicate time (5 d) at which hypocotyls were
further analysed. (A) P5-3, (B) PME01, (C) PME08.
BMC Plant Biology 2007, 7:31 />Page 7 of 12
(page number not for citation purposes)
in cell wall DE% and hypocotyl length in both lines.
Expression was strongest in line PME08 in which we
measured both the lowest DE% and the shortest hypoco-
tyls.
Discussion
In this work, we used the hypocotyl of the ga1-3 mutant,
as a system in which we can induce cell elongation, to
investigate the relationship between the level of pectin
esterification and cell elongation. We measured low DE%
in this dwarf GA-deficient mutant, and a high average
DE% in WT hypocotyl cell walls. Intermediate DE%
between ga1-3 and WT were found in the GA-insensitive
mutant gai that correlated with its semi-dwarf hypocotyl,
and GA-induced growth of ga1-3 was paralleled by a
recovery of DE% to WT. However, further increases in WT
hypocotyl growth, induced by GA, were not accompanied
by further changes in DE% above the maximum. This sug-
gests that a permissive level of DE% exists in the primary
cell wall of Arabidopsis hypocotyls, and that a reduction in
average DE% below this level progressively reduces cell
elongation. Above this level, other factors become limit-
ing for growth. Reducing DE%, by alcohol-induced
expression of PME1 from A. aculeatus, resulted in a pre-
dicted inhibition of hypocotyl growth. Since endogenous
PMEs are responsible for the removal of methyl-esters
from cell wall pectin, we predict that one or more mem-
bers of this family of enzymes plays a role in regulating
cell elongation in vivo.
Pectin is synthesised and deposited in the wall in a highly
methyl-esterified form [50], with measurements as high
as 80% DE [17,18]. In Arabidopsis hypocotyls we meas-
ured maximal DE of ~60% (Figure 2C), and, it is likely
that pectin is synthesised at values above this and subse-
quently de-esterified to a level where it is maintained. At
this level, pectin may be at the optimal DE% to contribute
to wall plasticity and thus to cell elongation, but de-ester-
ification to levels below this progressively restricts plastic-
ity and hence hypocotyl growth. Current theories of how
DE% may regulate wall extensibility, and thus cell expan-
sion, are largely based on in vitro studies of pectin gels.
Pectin has a highly complex macromolecular structure,
and its properties can be modulated by several factors that
include pH, osmolarity and ionic conditions [11]. One of
the main influences of DE% is regulating the amount of
ionised stretches of the HG backbone that can cross-link
with calcium ions [9]. A reduction in DE% increases the
potential for such cross-links and leads to a more rigid gel
with increased visco-elastic properties [12,51]. This may
independently affect the extensibility of the cell wall, but
may also act by modifying the mechanical properties of
the key load-bearing polymers, the cellulose-xyloglucan
network. The presence of pectin increases the extensibil-
ity, and reduces the stiffness, of cellulose-pectin compos-
ites, compared to cellulose alone, with low DE systems
(30%) having a greater effect than high DE systems (67%)
[52]. Therefore, if wall extensibility is indeed affected by
the physico-mechanical properties imposed by DE%,
these effects may be autonomous to the pectin network.
Indeed, linear stretching experiments show that the pectin
network moves independently of the cellulose-xyloglucan
network [53,54].
Plant PMEs are thought to remove methyl-ester groups in
a blockwise fashion, leading to contiguous stretches of
free carboxyl residues within the HG backbone, whereas
fungal PMEs are thought to de-esterify pectin randomly
resulting in single carboxyl residues that are dispersed
throughout the HG portion of pectin [55,56]. The result-
ing pattern of de-esterification can have different effects
on pectin properties. Blockwise de-esterification favours
cross-linking [9], requiring at least 9 contiguous carboxyl
residues for coordination with calcium [57]. In contrast,
random de-esterification may promote swelling, and
reduces wall porosity [12]. In vitro studies have been per-
Table 2: Semi-quantitative determination of DE% in P5-3, PME01
and PME08 hypocotyl cell walls.
semi-quantitative DE%
genotype no ethanol 0.1% ethanol
P5-3 48.6 ± 1.0 44.9 ± 1.2
PME01 47.7 ± 1.5 40.2 ± 2.0
PME08 42.2 ± 1.2 38.5 ± 1.2
Hypocotyls were prepared after 2 d growing on control (no ethanol)
or induction (0.1% ethanol) medium. DE% was derived from FTIR
spectra (n = 20 to 21) for each genotype/treatment as described in
Table 1. Average values are given ± SE.
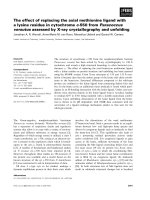
Transcriptional analysis of PME1 using RT-PCRFigure 4
Transcriptional analysis of PME1 using RT-PCR. RNA
was extracted from hypocotyls after 2 d growth on control/
induction medium (arrows in Figure 3) and reverse tran-
scribed. PME1 expression was detected using gene-specific
primers to amplify a 932 bp product. Actin isoform 2-specific
primers were used as controls. Lanes denote treatment, (-)
no ethanol, and (+) 0.1% ethanol.
BMC Plant Biology 2007, 7:31 />Page 8 of 12
(page number not for citation purposes)
formed on calcium-pectin gels with similar DE% but de-
esterified either by plant or by fungal PMEs. Gels prepared
from fungal PME-treated pectin have no capacity to
recover under compression, whereas they recover com-
pletely when de-esterified by plant PMEs [12]. Both mode
and extent of de-esterification can therefore influence the
rheological properties of pectin, and can potentially regu-
late wall extensibility but by different mechanisms. At an
optimum pH of 4.6, PME1 is highly effective at de-esteri-
fication, removing 75–85% of methyl groups in vitro [47].
However, in our study it is unlikely that PME1 had a
major impact on DE% in hypocotyl cell walls, since indi-
rect measurements showed only modest reductions, i.e.,
from about 48% to 40% in PME01, and about 42% to
38% in PME08 (Table 2). This may be the result of dura-
tion of expression, sub-optimal wall pH and/or accessibil-
ity to HG within the cell wall matrix. Therefore, expression
of PME1 from A. aculeatus may have resulted in random
de-esterification and affected wall loosening properties
more through a reduction in pore space, possibly caused
by electrostatic repulsion of fixed negative charges, lead-
ing to swelling of the pectin network and more efficient
filling of the available spaces [11,58], and reduced poros-
ity may subsequently limit accessibility of wall loosening
proteins to their cellulose-xyloglucan substrate. Similarly,
inhibition of hypocotyl elongation in ga1-3 and gai may
be due to cross-linking of the pectin network giving stiffer
walls, with less effect on pore space. It is important to rec-
ognise that we are looking at small effects with this exper-
imental system. High levels of PME are likely to be lethal,
and low levels, coupled with random patterns of de-ester-
ification, are likely to have small effects. Nevertheless the
tight correlation of extension with DE% is clear. Further
studies of the loss- and gain-of-function mutants
described here may help to identify any differences in pec-
tin structure that are the result of GA-deficiency/insensi-
tivity, compared to effects of PME1 expression.
Since we do not know exactly which polymers are affected
by PME1, or where, it is important to consider that small
changes in some crucially located pectin molecules may
underlie the effects we measured. One possibility is that
middle-lamella pectin, which in general is highly de-ester-
ified, may act as a trans-cellular brake, helping coordinate
differential growth between adjacent cells to achieve even
growth in the organ as a whole [57]. Another possibility,
reflecting our awareness that it is probably just the outer
epidermal wall that both drives and constrains growth of
the hypocotyl [59], is that the pectin in this very thick
outer wall [60] alone is involved in the relationship
between growth and pectin DE%.
Other studies in which plant PMEs have been constitu-
tively over-expressed have given more complex results. In
pea, inhibiting the expression of a PME altered cell wall
pH and inhibited the loss of root cap border cells, result-
ing in swollen roots and reduced elongation [20]. More
recently, over-expression of a Petunia inflata PME in pota-
toes caused a transient increase in stem elongation in
regions with reduced PME activity [19]. According to the
authors, the reduction in PME activity may have been
caused by compensation for the effects of over-expression,
however down-regulation of PME and increase in stem
elongation is consistent with the hypothesis presented
here. Neither of these putative PMEs, or indeed any other
plant PMEs, have been characterised biochemically so
their mechanistic effects on growth remain speculative. In
contrast, PME1 has been functionally characterised [47],
and the inducible system we used [48] gave tight control
over its expression. Likewise, a reduction in DE% and pro-
duction of dwarf tobacco plants resulted when a function-
ally characterised PME from Aspergillus niger was over-
expressed [21], further emphasising the need for more rig-
orous characterisation of these plant enzymes prior to
their manipulation. Over-expression of plant-derived
PMEs in plants may also be compromised by the presence
of endogenous PME inhibitors (PMEIs), a recently identi-
fied family of proteins that adds another regulatory level
to pectin metabolism and DE% [61-63]. Indeed, over-
expression of PMEIs in Arabidopsis resulted in a decrease in
overall PME activity coupled with an increase in DE%.
Transgenic seedlings, consistent with our hypothesis, also
produced longer roots and had longer cells in the elonga-
tion zone of the root [64].
While GA promoted elongation in WT hypocotyls, it did
so with no net increase in cell wall uronic acid content
over the same growth period (Figure 2B). Elongation in
this case correlates with cell wall thinning [60]. Maintain-
ing DE% at an adequate level may therefore contribute to
the strength of the thinning wall, as well as to its extensi-
bility. Similarly, GA-recovery of hypocotyl growth and
DE% in ga1-3 does not increase net uronic acid content of
the dwarf hypocotyl. Taken together, our data suggests
that GA also promotes cell elongation via remodelling of
the existing wall. Putative wall loosening proteins have
been shown to be GA-regulated. For example, GA
enhances cell expansion and glucanase activity in maize
leaves [65] and wheat (Triticum aestivum) internodes [66],
and an XET is GA-regulated in germinating tomato (Lyco-
persicon esculentum) seedlings [67]. This correlates with
increases in wall extensibility that are not seen in GA-
insensitive wheat cultivars [66,68]. GA also increases wall
extensibility in lettuce (Lactuca sativa) [69] and cucumber
(Cucumis sativus) hypocotyls [70]. Therefore, in Arabidopsis
hypocotyls, GA may also promote cell elongation by loos-
ening of the cellulose-xyloglucan network in conjunction
with wall remodelling, and restrict it by modulating DE%.
In lettuce hypocotyls [71], oat (Avena sativa) [72] and
wheat internodes [66], both net cell wall polysaccharide
BMC Plant Biology 2007, 7:31 />Page 9 of 12
(page number not for citation purposes)
and organ elongation are simultaneously increased by
GA. Thus, synthesis and deposition versus remodelling of
the cell wall during GA-stimulated cell expansion may
vary, depending upon the plant species. Relative to WT
hypocotyls, uronic acid content was reduced in ga1-3 and
lowest in gai. Therefore, both GA1 and GAI are required
for normal uronic acid incorporation into the wall, as well
as for controlling its methyl-ester content.
Conclusion
We have shown a consistent relationship between the
average degree of cell wall pectin esterification (DE%) and
the degree of cell elongation in Arabidopsis hypocotyls. A
reduction in hypocotyl length, using either forward or
reverse genetic approaches, is associated with a reduction
in DE%. Endogenous PMEs and their inhibitors, which
regulate the DE%, are therefore implicated in cell elonga-
tion in this system. GA has no effect on DE% in WT
hypocotyls but promotes additional cell elongation, sug-
gesting that enzymes regulating the cellulose-xyloglucan
network and other components of the primary cell wall
may be involved in responses to the growth regulator.
Methods
Plant materials and growth conditions
Arabidopsis thaliana (L. Heynh) ecotype Landsberg erecta
(Ler) was used as the reference wild-type (WT). In the
over-expression experiment, line P5-3 (also in the Ler
background) was used as WT. Seeds were surface-sterilised
by immersion for 5 min in 5% (v/v) Vortex bleach
(Procter & Gamble Ltd, containing 5 to 15% chlorine-
based bleach), and washed three times in sterile distilled
water (sdH
2
O). Following sterilisation, to allow seeds of
ga1-3 to germinate, they were incubated at 4°C for 5 d in
a solution of 1 µM GA
4
(Sigma-Aldrich, UK) [36]. Ler and
gai do not require this treatment but were included for
consistency. Next, seeds were rinsed five times in sdH
2
O
and sown onto medium containing 1× Murashige and
Skoog (MS) basal salts (micro and macro elements)
(Duchefa) supplemented with 3% (w/v) sucrose (pH
adjusted to 5.7) and solidified with 0.5% (w/v) Phytagel™
(Sigma-Aldrich, UK). Approximately 20 seeds were evenly
sown per 9 cm Petri plate (Bibby Sterilin Ltd) containing
20 mL of growing medium, and plates sealed with Para-
film
®
laboratory film (Pechiney Plastic Packaging, Mena-
sha, USA). Plates were placed in darkness at 4°C for 48 h
to stimulate and synchronise germination. Following cold
treatment, plates were transferred to a growth room main-
tained at 25°C and incubated horizontally under fluores-
cent lamps (70 µmol m
-2
s
-1
) in a continuous white light
regime.
Hypocotyl measurements
Hypocotyl length was determined as the distance between
the top of the collet root hairs, to the 'V' made by the cot-
yledon shoulder [73]. Hypocotyl lengths were measured
using a Leica WILD M10 binocular microscope fitted with
an eye-piece graticule, and the mean ± SE calculated for
each data set.
Field emission scanning electron microscopy (FESEM)
Seedlings were mounted in a horizontal position on adhe-
sive carbon tabs (Agar Scientific Ltd) and plunge-frozen at
-210°C in liquid nitrogen slush. After freezing, samples
were immediately loaded into the cryo chamber of the
scanning electron microscope, equilibrated with the stage
and sublimed at -100°C for 2 min. The temperature was
returned to -110°C, the samples were sputter-coated with
platinum for 2 min at 10 mA, and then transferred to the
imaging stage at -130 to -150°C for analysis. FESEM
images of hypocotyl epidermal cells were obtained using
a Philips XL30 FEG scanning electron microscope (FEI
Co., Eindhoven, The Netherlands) fitted with a cryostage
(CT1500 HF; Oxford Instruments, Abingdon, Oxford,
UK), operating at 3 kV and a working distance of between
5 and 15 mm.
FTIR microspectroscopy
Whole hypocotyls were excised from seedlings and sus-
pended on the surface of water-soaked tissue paper to pre-
vent tissue dehydration during sample collection. This
also effectively rinsed the samples. The samples were com-
pressed onto barium fluoride (BaF
2
) windows (13 × 2
mm) (Crystran Ltd, Poole, UK), dried at 60°C for 1 h and
used immediately for spectral acquisition, or stored over-
night at 4°C and used the next day. Windows were sup-
ported on the stage of a UMA500 microscope accessory of
a Bio-Rad FTS175c spectrometer equipped with a liquid
nitrogen-cooled mercury cadmium telluride detector and
absorbance spectra obtained. Sixty-four interferograms
were collected in transmission mode with 8 cm
-1
resolu-
tion and co-added to improve the signal-to-noise-ratio for
each sample. An area of approximately 200 × 100 µm in
the middle region (along the longitudinal axis) of each
hypocotyl was selected, avoiding the central stele. One
spectrum was collected from each hypocotyl and between
10 and 28 samples for each genotype/treatment used. For
each population the spectra were averaged between 790
and 1810 cm
-1
and each average spectrum baseline-cor-
rected and area-normalised to account for differences in
sample thickness. Processing of spectral data was done
using OMNIC E.S.P. 5.0 software. For each spectrum, a
two-point baseline was constructed between 870 and
1810 cm
-1
. The absorbance maxima of bands
υ
as
(COO
-
)
1605 cm
-1
and
υ
(C = O)
ester
1745 cm
-1
from the baseline
were measured, and the log ratio of these values used to
semi-quantitatively calculate DE% from the calibration
curve of Filippov and Kohn [41]. For each genotype/treat-
ment, values were averaged ± SE.
BMC Plant Biology 2007, 7:31 />Page 10 of 12
(page number not for citation purposes)
Uronic acid and methyl ester assays
Hypocotyls were excised precisely using fine-tipped for-
ceps and a razor blade. Upon excision, samples were
transferred to a 1.7 mL microfuge tube containing 1 mL
absolute ethanol and heated to 85°C for 20 min to extract
chlorophyll, sugars and other small molecules. An addi-
tional extraction was made in 1 mL 80% (v/v) ethanol at
85°C for a further 20 min, and then rinsed three times in
1 mL sdH
2
O. Samples were suspended in a small volume
of sdH
2
O and freeze-dried. Each tube contained between
50 and 100 hypocotyls. Uronic acid assays were per-
formed on these as described previously [74]. Methyl-
esters were determined as the amount of methanol
released following saponification using the method
described by Kim and Carpita [17]. Values are expressed as
nmol per hypocotyl. For each genotype and treatment,
duplicate or triplicate samples were used in each experi-
ment, and each experiment performed three times. In
total, 600–900 hypocotyls were used to independently
calculate average uronic acid and average methanol val-
ues. The ratio of methanol to uronic acid was used to cal-
culate DE%. Thus in total, between 1200 and 1800
hypocotyls were used to derive the average DE% for each
genotype/treatment. Standard error values were ratioed as
described previously [75].
Construction of plasmids and plant transformation
The open reading frame of PME1 (Accession no: U49378)
from Aspergillus aculeatus [47], minus the predicted signal
peptide sequence, was PCR amplified out of pYES 2.0
using the forward primer OVEXP3 (5'-CTGCCAATCCAC-
CATAGCCGCCAGCCGTACCACGGCTCC-3') and the
reverse primer OVEXP4 (5'-GGCGAATTC
TTTAATTA-
GAAGTAGGAGGTATCGAC-3'). The underlined region
denotes the EcoRI restriction site. The signal peptide
sequence of a putative PME (At4g12390) from Arabidopsis
was PCR amplified from BAC clone T4C9 (supplied by
ABRC) using the forward primer OVEXP1 (5'-GGCG-
GATCCTTATGGAACCAAAGCTAACCCA-3') and the
reverse primer OVEXP2 (5'-GGAGCCGTGGTACGGCT-
GGCGGCTATGGTGGATTGGCAG-3'). The underlined
region denotes the BamHI restriction site. The plant signal
peptide sequence was ligated to the fungal PME sequence
giving a 1133 bp cDNA product, and then digested with
BamHI/EcoRI and ligated into pL4 upstream of the
AlcA35S promoter and downstream of CaMV35S termina-
tor. The vector was linearised by digesting with BglII, fol-
lowed by a second digestion with HindIII to give a 1696
bp fragment containing the AlcA35S::PME::CaMV35S ter-
minator region. The gel-purified product was ligated into
pGreen0229 using HindIII/BamHI and the chimeric con-
struct transformed via Agrobacterium tumefaciens
(GV3101) into line P5-3 (containing the ethanol-induci-
ble AlcR promoter) using the floral-dip method [76].
Tranformants were selected with Basta and T2 plants used
for phenotypic analysis.
Plant growth and ethanol induction
Seeds were prepared as described above and sown onto
sterile filter paper in contact with growing medium con-
taining 1% (w/v) sucrose. Sealed plates were incubated in
a near vertical position. This allowed hypocotyls to be
measured each day without opening plates, which would
have resulted in some loss of ethanol vapour (see below).
After 3 d seedlings were carefully transferred to the same
medium containing no ethanol (control medium) or to
induction medium containing 0.1% (v/v) ethanol. Induc-
tion medium was prepared by adding the appropriate vol-
ume of 50% (v/v) of ethanol to the molten medium
cooled just to the point at which it started to solidify in
order to prevent ethanol evaporation. Following transfer,
plates were resealed with Parafilm. Hypocotyl lengths
were imaged digitally and measured using Photoshop 5.0
software.
Transcription analysis by RT-PCR
RNA was extracted from whole seedlings at 2 d after trans-
fer to induction/control medium, using a QIAGEN RNe-
asy Plant minikit according to the manufacturer's
instructions. RNA yield was quantified by spectrophotom-
etry and concentrations equalised with RNase-free water.
After DNase treatment (40 units DNaseI; Amersham Phar-
macia) for 20 min at 37°C, 2.5 µg was reverse transcribed
for 60 min at 42°C in a final volume of 20 µL in the pres-
ence of 20 units RNA guard, 1 mM dNTPs, 5 mM MgCl
2
,
0.3 µM oligo(dT) primers and 4 units M-MLV reverse tran-
scriptase (Life Technologies) in the reaction buffer pro-
vided. Reactions were stopped by heat inactivation and 80
µL H
2
O added. 2 µL of the reverse transcription reaction
were used for PCR amplification. The forward primer
PMEfor (5'-GTACCACGGCTCCCTCCG-3') and the
reverse primer PMErev (5'-GTAGGAGGTATCGAC-
CCAGC-3') gave a 932 bp product for the transgene
cDNA. The forward primer Actin2-5' (5'-CTAAGCTCT-
CAAGATCAAAGGCTTA-3') and the reverse primer
Actin2-3' (5'-ACTAAAACGCAAAACGAAAGCGGTT-3')
amplified a 220 bp fragment of ACT2 cDNA and used as
a semi-quantitative control [77]. For controls, 25 cycles of
PCR were conducted (30 s at 94°C, 30 s at 55°C, 1 min at
72°C) in a final volume of 20 µL containing 2 µL cDNA,
1 mM dNTPs, 5 mM MgCl
2
, 0.3 µM Actin forward/Actin
reverse primers and 0.5 units of Taq DNA polymerase
(Life Technologies) in the reaction buffer provided. For
quantification of the PME1 transgene 30 cycles of PCR
were conducted as described above using PMEfor/PMErev
primers. The latter reaction was also used to confirm pres-
ence of the transgene following Basta selection.
BMC Plant Biology 2007, 7:31 />Page 11 of 12
(page number not for citation purposes)
Authors' contributions
PD conducted all of the experiments and wrote drafts of
the manuscript. MCM helped supervise the project. PD,
MCM and KR co-wrote the manuscript. KR oversaw the
project in his lab and is the guarantor of the work.
Acknowledgements
The authors thank Nick Harberd (JIC) for ga1-3 and gai seeds, John Doonan
(JIC) for pL4 vector, AlcR line P5-3 and advice on its use, Phil Mullineaux
(JIC) for pGreen0229 vector, and Kirk Schnorr (Novozymes A/S, Bags-
vaerd, Denmark) for the Aspergillus aculeatus PME1 clone. We thank Nick
Harberd (JIC), Alistair MacDougall (IFR) and Benoit Menand (JIC) for con-
structive comments on the manuscript. PD was funded by a Biotechnology
and Biological Sciences Research Council (BBSRC) studentship. PD and KR
also received support from EU EDEN grant no QLK5-CT-2001-00443. KR
was funded by BBSRC; MCM was funded by a Royal Society University
Research Fellowship.
References
1. Carpita NC, Gibeaut DM: Structural models of primary cell
walls in flowering plants - consistency of molecular structure
with the physical properties of the walls during growth. Plant
J 1993, 3(1):1-30.
2. McCann MC, Roberts K: Architecture of the primary cell wall.
In The Cytoskeletal Basis of Plant Growth and Form Edited by: Lloyd C.
London , Academic Press; 1991:109-129.
3. Green PB: Organogenesis - a biophysical view. Annu Rev Plant
Physiol Plant Molec Biol 1980, 31:51-82.
4. Brummell DA, Lashbrook CC, Bennett AB: Plant endo-1,4-beta-
D-glucanases - structure, properties, and physiological func-
tion. Enzymatic Conversion of Biomass for Fuels Production 1994,
566:100-129.
5. Fry SC, Smith RC, Renwick KF, Martin DJ, Hodge SK, Matthews KJ:
Xyloglucan Endotransglycosylase, a new wall-loosening
enzyme- activity from plants. Biochem J 1992, 282:821-828.
6. Nishitani K, Tominaga R: Endoxyloglucan Transferase, a novel
class of gycosyltransferase that catalyzes transfer of a seg-
ment of xyloglucan molecule to another xyloglucan mole-
cule. J Biol Chem 1992, 267(29):21058-21064.
7. McQueen-Mason S, Cosgrove DJ: Disruption of hydrogen-bond-
ing between plant cell wall polymers by proteins that induce
wall extension. Proc Natl Acad Sci U S A 1994, 91(14):6574-6578.
8. Micheli F: Pectin methylesterases: cell wall enzymes with
important roles in plant physiology. Trends Plant Sci 2001,
6(9):414-419.
9. Jarvis MC: Structure and properties of pectin gels in plant cell
walls. Plant Cell Environ 1984, 7(3):153-164.
10. Morris ER, Powell DA, Gidley MJ, Rees DA: Conformations and
interactions of pectins .1. Polymorphism between gel and
solid states of calcium polygalacturonate. J Mol Biol 1982,
155(4):507-516.
11. MacDougall AJ, Rigby NM, Ryden P, Tibbits CW, Ring SG: Swelling
behavior of the tomato cell wall network. Biomacromolecules
2001, 2(2):450-455.
12. Willats WGT, Orfila C, Limberg G, Buchholt HC, van Alebeek G,
Voragen AGJ, Marcus SE, Christensen T, Mikkelsen JD, Murray BS,
Knox JP: Modulation of the degree and pattern of methyl-
esterification of pectic homogalacturonan in plant cell walls
- Implications for pectin methyl esterase action, matrix
properties, and cell adhesion. J Biol Chem 2001,
276(22):19404-19413.
13. Ryden P, Sugimoto-Shirasu K, Smith AC, Findlay K, Reiter WD,
McCann MC: Tensile properties of Arabidopsis cell walls
depend on both a xyloglucan cross-linked microfibrillar net-
work and rhamnogalacturonan II-borate complexes. Plant
Physiol 2003, 132(2):1033-1040.
14. Ruge U: Untersuchungen uber die anderungen der osmo-
tischen zustandsgrossen und der membraneigen schaften
des hypokotyls von Helianthus annuus beim normalen
streckungswachstum. Planta 1937, 27:352-399.
15. Goldberg R, Morvan C, Roland JC: Composition, properties and
localization of pectins in young and mature cells of the mung
bean hypocotyl. Plant Cell Physiol 1986, 27(3):417-429.
16. Bordenave M, Goldberg R: Immobilized and free apoplastic
pectinmethylesterases in mung mean hypocotyl. Plant Physiol
1994, 106(3):1151-1156.
17. Kim JB, Carpita NC: Changes in esterification of the uronic acid
groups of cell wall polysaccharides during elongation of
maize coleoptiles. Plant Physiol 1992, 98(2):646-653.
18. McCann MC, Shi J, Roberts K, Carpita NC: Changes in pectin
structure and localization during the growth of unadapted
and NaCl-adapted tobacco cells. Plant J 1994, 5(6):773-785.
19. Pilling J, Willmitzer L, Fisahn J: Expression of a Petunia inflata
pectin methyl esterase in Solanum tuberosum L. enhances
stem elongation and modifies cation distribution. Planta 2000,
210(3):391-399.
20. Wen FS, Zhu YM, Hawes MC: Effect of pectin methylesterase
gene expression on pea root development. Plant Cell 1999,
11(6):1129-1140.
21. Hasunuma T, Fukusaki E, Kobayashi A: Expression of fungal pectin
methylesterase in transgenic tobacco leads to alteration in
cell wall metabolism and a dwarf phenotype. J Biotechnol 2004,
111(3):241-251.
22. Sidler M, Hassa P, Hasan S, Ringli C, Dudler R: Involvement of an
ABC transporter in a developmental pathway regulating
hypocotyl cell elongation in the light. Plant Cell 1998,
10(10):1623-1636.
23. Collett CE, Harberd NP, Leyser O: Hormonal interactions in the
control of Arabidopsis hypocotyl elongation. Plant Physiol 2000,
124(2):553-561.
24. Raz V, Koornneef M: Cell division activity during apical hook
development. Plant Physiol 2001, 125(1):219-226.
25. Saibo NJM, Vriezen WH, Beemster GTS, Van der Straeten D:
Growth and stomata development of Arabidopsis hypocot-
yls are controlled by gibberellins and modulated by ethylene
and auxins. Plant J 2003, 33(6):989-1000.
26. Gendreau E, Traas J, Desnos T, Grandjean O, Caboche M, Hofte H:
Cellular basis of hypocotyl growth in Arabidopsis thaliana.
Plant Physiol 1997, 114(1):295-305.
27. Sun TP, Goodman HM, Ausubel FM: Cloning the Arabidopsis Ga1
locus by genomic subtraction. Plant Cell 1992, 4(2):119-128.
28. Sun TP, Kamiya Y: The Arabidopsis Ga1 locus encodes the
cyclase ent-kaurene synthetase-a of gibberellin biosynthesis.
Plant Cell 1994, 6(10):1509-1518.
29. Koornneef M, Vanderveen JH: Induction and analysis of gibberel-
lin sensitive mutants in Arabidopsis thaliana (L) Heynh. Theor
Appl Genet 1980, 58(6):257-263.
30. King KE, Moritz T, Harberd NP: Gibberellins are not required for
normal stem growth in Arabidopsis thaliana in the absence
of GAI and RGA. Genetics 2001, 159(2):767-776.
31. Koornneef M, Elgersma A, Hanhart CJ, Vanloenenmartinet EP, Vanrijn
L, Zeevaart JAD: A gibberellin insensitive mutant of Arabidop-
sis thaliana. Physiol Plant 1985, 65(1):33-39.
32. Fleck B, Harberd NP: Evidence that the Arabidopsis nuclear
gibberellin signalling protein GAI is not destabilised by gib-
berellin. Plant J 2002, 32(6):935-947.
33. Harberd NP, King KE, Carol P, Cowling RJ, Peng JR, Richards DE:
Gibberellin: inhibitor of an inhibitor of ? Bioessays 1998,
20(12):1001-1008.
34. Richards DE, King KE, Ait-ali T, Harberd NP: How gibberellin reg-
ulates plant growth and development: A molecular genetic
analysis of gibberellin signaling. Annu Rev Plant Physiol Plant Molec
Biol 2001, 52:67-88.
35. Peng JR, Carol P, Richards DE, King KE, Cowling RJ, Murphy GP, Har-
berd NP: The Arabidopsis GAI gene defines a signaling path-
way that negatively regulates gibberellin responses. Genes
Dev 1997, 11(23):3194-3205.
36. Cowling RJ, Harberd NP: Gibberellins control Arabidopsis
hypocotyl growth via regulation of cellular elongation. J Exp
Bot 1999, 50(337):1351-1357.
37. Cowling RJ: Characterization of gibberellin responses in Ara-
bidopsis thaliana seedlings. PhD thesis 1997.
38. Chen LM, Carpita NC, Reiter WD, Wilson RH, Jeffries C, McCann
MC: A rapid method to screen for cell-wall mutants using dis-
criminant analysis of Fourier transform infrared spectra.
Plant J 1998, 16(3):385-392.
BMC Plant Biology 2007, 7:31 />Page 12 of 12
(page number not for citation purposes)
39. McCann MC, Chen L, Roberts K, Kemsley EK, Sene C, Carpita NC,
Stacey NJ, Wilson RH: Infrared microspectroscopy: Sampling
heterogeneity in plant cell wall composition and architec-
ture. Physiol Plant 1997, 100(3):729-738.
40. Schindelman G, Morikami A, Jung J, Baskin TI, Carpita NC, Derbyshire
P, McCann MC, Benfey PN: COBRA encodes a putative GPI-
anchored protein, which is polarly localized and necessary
for oriented cell expansion in Arabidopsis. Genes Dev 2001,
15(9):1115-1127.
41. Filippov MP, Kohn R: Determination of esterification degree of
carboxyl groups of pectin with methanol by means of infra-
red spectroscopy. Chemicke Zvesti 1975, 29(1):88-91.
42. Carbohydrate Active Enzymes database [s-
mrs.fr/CAZY/]
43. Hou WC, Chang WH: Pectinesterase-catalyzed firming effects
during precooking of vegetables. J Food Biochem 1997,
20(5):397-416.
44. Hwang JY, Lee CW, Wu MC, Chang HM: Transacylation and de-
esterification reactions of pectin as catalyzed by pectineste-
rases from tomato and citrus. J Agric Food Chem 2003,
51(21):6287-6292.
45. Maldonado MC, Desaad AMS, Callieri D: Purification and charac-
terization of pectinesterase produced by a strain of Aspergil-
lus niger. Curr Microbiol 1994, 28(4):193-196.
46. Shevchik VE, Condemine G, Hugouvieux-Cotte-Pattat N, Robert-
Baudouy J: Characterization of pectin methylesterase B, an
outer membrane lipoprotein of Erwinia chrysanthemi 3937.
Mol Microbiol 1996, 19(3):455-466.
47. Christgau S, Kofod LV, Halkier T, Andersen LN, Hockauf M, Dorreich
K, Dalboge H, Kauppinen S: Pectin methyl esterase from
Aspergillus aculeatus: Expression cloning in yeast and char-
acterization of the recombinant enzyme. Biochem J 1996,
319:705-712.
48. Roslan HA, Salter MG, Wood CD, White MRH, Croft KP, Robson F,
Coupland G, Doonan J, Laufs P, Tomsett AB, Caddick MX: Charac-
terization of the ethanol-inducible alc gene-expression sys-
tem in Arabidopsis thaliana. Plant J 2001, 28(2):225-235.
49. Francis KE, Lam SY, Copenhaver GP: Separation of Arabidopsis
pollen tetrads is regulated by QUARTET1, a pectin methyl-
esterase gene. Plant Physiol 2006, 142(3):1004-1013.
50. Zhang GF, Staehelin LA: Functional compartmentation of the
Golgi apparatus of plant cells - immunocytochemical analysis
of high-pressure frozen-substituted and freeze-substituted
sycamore maple suspension-culture cells. Plant Physiol 1992,
99(3):1070-1083.
51. Morris GA, Foster TJ, Harding SE: The effect of the degree of
esterification on the hydrodynamic properties of citrus pec-
tin. Food Hydrocolloids 2000, 14(3):227-235.
52. Chanliaud E, Gidley MJ: In vitro synthesis and properties of pec-
tin/Acetobacter xylinus cellulose composites. Plant J 1999,
20(1):25-35.
53. Kacurakova M, Smith AC, Gidley MJ, Wilson RH: Molecular inter-
actions in bacterial cellulose composites studied by 1D FT-IR
and dynamic 2D FT-IR spectroscopy. Carbohydr Res 2002,
337(12):1145-1153.
54. Wilson RH, Smith AC, Kacurakova M, Saunders PK, Wellner N, Wal-
dron KW: The mechanical properties and molecular dynam-
ics of plant cell wall polysaccharides studied by Fourier-
transform infrared spectroscopy. Plant Physiol 2000,
124(1):397-405.
55. Limberg G, Korner R, Buchholt HC, Christensen T, Roepstorff P,
Mikkelsen JD: Analysis of pectin structure part 1 - Analysis of
different de-esterification mechanisms for pectin by enzy-
matic fingerprinting using endopectin lyase and endopolyga-
lacturonase II from A. niger. Carbohydr Res 2000,
327(3):293-307.
56. Limberg G, Korner R, Buchholt HC, Christensen T, Roepstorff P,
Mikkelsen JD: Analysis of pectin structure part 3 - Quantifica-
tion of the amount of galacturonic acid residues in blockse-
quences in pectin homogalacturonan by enzymatic
fingerprinting with exo- and endo-polygalacturonase II from
Aspergillus niger. Carbohydr Res 2000, 327(3):321-332.
57. Liners F, Thibault JF, Van Cutsem P: Influence of the degree of
polymerization of oligogalacturonates and of esterification
pattern of pectin on their recognition by monoclonal-anti-
bodies. Plant Physiol 1992, 99(3):1099-1104.
58. Zwieniecki MA, Melcher PJ, Holbrook NM: Hydrogel control of
xylem hydraulic resistance in plants. Science 2001,
291(5506):1059-1062.
59. Savaldi-Goldstein S, Peto C, Chory J: The epidermis both drives
and restricts plant shoot growth. Nature 2007, 446:199-202.
60. Derbyshire P, Findlay K, McCann MC, Roberts K: Cell elongation
in Arabidopsis hypocotyls involves dynamic changes in cell
wall thickness. J Exp Bot 2007, doi: 10.1093/jxb/erm074:.
61. Giovane A, Servillo L, Balestrieri C, Raiola A, D'Avino R, Tamburrini
M, Clardiello MA, Camardella L: Pectin methylesterase inhibitor.
BBA-Proteins Proteomics 2004, 1696(2):245-252.
62. Raiola A, Camardella L, Giovane A, Mattei B, De Lorenzo G, Cervone
F, Bellincampi D: Two Arabidopsis thaliana genes encode func-
tional pectin methylesterase inhibitors. FEBS Lett 2004, 557(1-
3):199-203.
63. Wolf S, Grsic-Rausch S, Rausch T, Greiner S: Identification of pol-
len-expressed pectin methylesterase inhibitors in Arabidop-
sis. FEBS Lett 2003, 555(3):551-555.
64. Lionetti V, Raiola A, Camardella L, Giovane A, Obel N, Pauly M,
Favaron F, Cervone F, Bellincampi D: Overexpression of Pectin
Methylesterase Inhibitors in Arabidopsis Restricts Fungal
Infection by Botrytis cinerea. Plant Physiol 2007, 143:1871-1880.
65. Carpita NC, Kanabus J: Chemical structure of the cell walls of
dwarf maize and changes mediated by gibberellin. Plant Physiol
1988, 88(3):671-678.
66. Chen L, Higashitani A, Suge H, Takeda K, Takahashi H: Spiral
growth and cell wall properties of the gibberellin-treated
first internodes in the seedlings of a wheat cultivar tolerant
to deep sowing conditions. Physiol Plant 2003, 118(1):147-155.
67. Chen F, Nonogaki H, Bradford KJ: A gibberellin-regulated
xyloglucan endotransglycosylase gene is expressed in the
endosperm cap during tomato seed germination. J Exp Bot
2002, 53(367):215-223.
68. Keyes G, Sorrells ME, Setter TL: Gibberellic acid regulates cell
wall extensibility in wheat (Triticum aestivum L.). Plant Physiol
1990, 92(1):242-245.
69. Jones RL: The role of gibberellins in plant cell elongation. CRC
Critical Reviews in Plant Sciences 1983, 1(1):23-47.
70. Taylor A, Cosgrove DJ: Gibberellic acid stimulation of cucum-
ber hypocotyl elongation - effects on growth, turgor,
osmotic pressure, and cell wall properties. Plant Physiol 1989,
90(4):1335-1340.
71. Kawamura H, Kamisaka S, Masuda Y: Regulation of lettuce
hypocotyl elongation by gibberellic acid - correlation
between cell elongation, stress-relaxation properties of cell
wall and wall polysaccharide content. Plant Cell Physiol 1976,
17(1):23-34.
72. Montague MJ: Gibberellic acid promotes growth and cell wall
synthesis in Avena internodes regardless of the orientation
of cell expansion. Physiol Plant 1995, 94(1):7-18.
73. Scheres B, Wolkenfelt H, Willemsen V, Terlouw M, Lawson E, Dean
C, Weisbeek P: Embryonic origin of the Arabidopsis primary
root and root meristem initials. Development 1994,
120(9):2475-2487.
74. Blumenkrantz N, Asboe-Hansen G: New method for quantitative
determination of uronic acids. Analytical Biochemistry 1973,
54:484-489.
75. Armitage P, Berry G: Statistical Methods in Medical Research.
2nd edition. Oxford , Blackwell Scientific Publications; 1987:90-92.
76. Clough SJ, Bent AF: Floral dip: a simplified method for Agro-
bacterium-mediated transformation of Arabidopsis thal-
iana. Plant J 1998, 16(6):735-743.
77. Laval V, Koroleva OA, Murphy E, Lu CG, Milner JJ, Hooks MA, Tomos
AD: Distribution of actin gene isoforms in the Arabidopsis
leaf measured in microsamples from intact individual cells.
Planta 2002, 215(2):287-292.