báo cáo khoa học: " An extensive (co-)expression analysis tool for the cytochrome P450 superfamily in Arabidopsis thaliana" docx
Bạn đang xem bản rút gọn của tài liệu. Xem và tải ngay bản đầy đủ của tài liệu tại đây (1.47 MB, 19 trang )
BioMed Central
Page 1 of 19
(page number not for citation purposes)
BMC Plant Biology
Open Access
Research article
An extensive (co-)expression analysis tool for the cytochrome P450
superfamily in Arabidopsis thaliana
Jürgen Ehlting
1
, Vincent Sauveplane
1
, Alexandre Olry
1
, Jean-
François Ginglinger
1
, Nicholas J Provart
2
and Danièle Werck-Reichhart*
1
Address:
1
Institute of Plant Molecular Biology, Centre National de la Recherche Scientifique UPR 2357, Université Louis Pasteur, 28 rue Goethe,
67000 Strasbourg, France and
2
Department of Cell and Systems Biology, University of Toronto, 25 Willcocks Street, Toronto, ON M5S 3B2,
Canada
Email: Jürgen Ehlting - ; Vincent Sauveplane - ;
Alexandre Olry - ; Jean-François Ginglinger - ;
Nicholas J Provart - ; Danièle Werck-Reichhart* -
* Corresponding author
Abstract
Background: Sequencing of the first plant genomes has revealed that cytochromes P450 have
evolved to become the largest family of enzymes in secondary metabolism. The proportion of P450
enzymes with characterized biochemical function(s) is however very small. If P450 diversification
mirrors evolution of chemical diversity, this points to an unexpectedly poor understanding of plant
metabolism. We assumed that extensive analysis of gene expression might guide towards the
function of P450 enzymes, and highlight overlooked aspects of plant metabolism.
Results: We have created a comprehensive database, 'CYPedia', describing P450 gene expression
in four data sets: organs and tissues, stress response, hormone response, and mutants of Arabidopsis
thaliana, based on public Affymetrix ATH1 microarray expression data. P450 expression was then
combined with the expression of 4,130 re-annotated genes, predicted to act in plant metabolism,
for co-expression analyses. Based on the annotation of co-expressed genes from diverse pathway
annotation databases, co-expressed pathways were identified. Predictions were validated for most
P450s with known functions. As examples, co-expression results for P450s related to plastidial
functions/photosynthesis, and to phenylpropanoid, triterpenoid and jasmonate metabolism are
highlighted here.
Conclusion: The large scale hypothesis generation tools presented here provide leads to new
pathways, unexpected functions, and regulatory networks for many P450s in plant metabolism.
These can now be exploited by the community to validate the proposed functions experimentally
using reverse genetics, biochemistry, and metabolic profiling.
Background
Cytochrome P450 monooxygenases, which catalyze sub-
strate-, regio- and stereo-specific oxygenation steps in
plant metabolism, have evolved to a huge superfamily of
enzymes. Plant genome sequencing initiatives recently
revealed 39 full-length P450 genes in Chlamydomonas rein-
hartii, 71 in the moss Physcomitrella patens, 246 in Arabi-
dopsis thaliana, 356 in rice and 312 in Populus trichocarpa
Published: 23 April 2008
BMC Plant Biology 2008, 8:47 doi:10.1186/1471-2229-8-47
Received: 2 February 2008
Accepted: 23 April 2008
This article is available from: />© 2008 Ehlting et al; licensee BioMed Central Ltd.
This is an Open Access article distributed under the terms of the Creative Commons Attribution License ( />),
which permits unrestricted use, distribution, and reproduction in any medium, provided the original work is properly cited.
BMC Plant Biology 2008, 8:47 />Page 2 of 19
(page number not for citation purposes)
[1]. However, according to the most recent survey [2],
only 41 of the 246 coding sequences in the A. thaliana
genome have been associated with a specific biochemical
function(s). The high complexity of the P450 superfamily
as opposed to the relatively scarce information available
on the functions of individual P450 enzymes was one of
the surprises of the first sequenced plant genomes [3-5].
Assuming that P450 number and diversification in plants
mirrors the evolution of chemical-, ecological- and bio-
diversity, it points to an unexpectedly poor understanding
of secondary metabolism, even in model plants. This led
us to assume that an extensive analysis of P450 gene
expression might actually be used to identify the meta-
bolic networks, to highlight overlooked aspects of plant
metabolism, and to reveal functions of "orphan" P450
enzymes.
An extensive and sustained annotation of the P450 genes
in sequenced organisms, including plants, is being carried
out and has been made publicly available on a University
of Tennesse website maintained by David Nelson (Table
1). Annotation of A. thaliana P450 genes has also been
curated and collated in other databases by different organ-
izations (Table 1). They include comments on genomic,
cDNA and protein sequences, genetic maps, phylogeny,
function, available mutants and tissue-specific gene
expression based on a boutique P450 gene microarray.
On the other hand, information on the expression of indi-
vidual P450 genes can be obtained from large scale digital
gene expression databases. Also several large scale co-
expression tools are available to compare the expression
profile of a gene of interest with individual genes, or all
genes available on the microarray [6-10] (Table 1).
Such resources have been used as a starting point to create
the comprehensive database, 'CYPedia' (see Availability
and requirements section for URL), which combines large
scale P450 (co-)expression data with functional annota-
tion. In a first step, Affymetrix ATH1 microarray data were
extracted from publicly available experiments to generate
comprehensive gene expression matrices for all P450s. In
a second step, correlation of the expression of each P450
gene with the expression of 4,130 selected and carefully
re-annotated genes representative of plant metabolism
was examined. Such a comparative analysis reveals highly
complex and divergent expression patterns for the major-
ity of P450s, and provides novel clues on P450 functions,
related pathways, and corresponding regulatory networks.
This paper describes the construction of the database, its
content, and provides some examples of general and more
specific information, which can be extracted from it.
Results and Discussion
P450 gene family information and expression data
A total of 271 P450s from A. thaliana are listed in the
PlaCe Arabidopsis P450 database [11]. Using the corre-
Table 1: Internet resources referred to in this manuscript
Name used Full name Uniform resource locator (URL)
P450 resources
Nelson Cytochrome P450 homepage />Schuler Functional genomics of Arabidopsis P450s
PlaCe Arabidopsis cytochrome P450 />Krochko P450s in plants />General gene information resources
TAIR The Arabidopsis information resource
MAtDB MIPS Arabidopsis thaliana database />TIGR Arabidopsis thaliana genome project />SIGnAL T-DNA express: Arabidopsis gene mapping tool />Expression data resources
Genevestigator Arabidopsis thaliana microarray database and analysis
toolbox
/>BAR The bio-array resource for Arabidopsis functional genomics
PRIMe Platform for RIKEN metabolomics
ATTED II Arabidopsis thaliana trans-factor and cis-element prediction
database
Pathway annotation resources
TAIR-GO Gene Ontology annotations at TAIR />functional_annotation/go.jsp
AraCyc AraCyc pathways at TAIR />KEGG KEGG orthology (KO) – Arabidopsis thaliana />kegg/brite/ath
FunCat MIPS functional catalogue />AcyLipid The Arabidopsis lipid gene database />BioPathAt Biochemical pathway knowledge database />BMC Plant Biology 2008, 8:47 />Page 3 of 19
(page number not for citation purposes)
sponding locus identifiers (Atxgxxxxx) 227 genes were
found to be represented on the Affymetrix ATH1 microar-
ray represented by 216 probe sets (see Methods for
details). A list of all P450 genes, the associated AGI loci,
and the probe sets used can be found in Additional File 1
and at the 'CYPedia' homepage. A description of their bio-
chemical function is also given (if known) and links to rel-
evant publications as well as to information in external
databases, such as 'MAtDB, 'TAIR', or 'SIGnAL' (Table 1).
We retrieved normalized gene expression data for the
selected probe sets from the 'Genevestigator Digital
Northern' tool [10] covering more than 1,800 microar-
rays. Upon background correction, the mean intensity
ratios of replicates from each experiment was placed in
one of the following four categories: i) organ and tissue
samples from wild type plants (compared to background
levels), ii) stress treatment of wild type plants (compared
to untreated control), iii) hormone, nutrient (depriva-
tion), and other treatments (compared to control), and
iv) mutant plants (compared to wild type samples).
Organ and tissue-specific expression
Across the organ and tissue data set, only seven P450
genes (represented by six probe sets) are not expressed
more than twofold above background in any sample. An
additional 6 genes (represented by 5 probe sets) are
expressed in only one sample, and two genes in only two
samples (Additional File 1). These may thus be consid-
ered as not detectably expressed in the organ sample set.
This group includes all putative pseudogenes represented
on the Affymetrix array. Conversely, 93 probe sets do
show expression in more than two experiments, but in
less than 20% of the 277 organ and tissue samples (Addi-
tional File 1; corresponding to the first four bins in Figure
1a), indicating highly specialized expression for 43% of
the P450 genes represented on the array. Groups of
flower, root, or leaf specific P450s are apparent. For exam-
ple, 56 probe sets exhibit expression (twofold above back-
ground) in more than 80% of all root samples (23
experiments); of these, nine are expressed in less than
20% of other samples (Figure 1b). Using the same defini-
tion, we also identified five flower specific and four leaf
specific P450s. These represent the most specifically
expressed genes (Figure 1b). On the other hand, only 16
probe sets indicate expression in more than 80% of the
tissue and organ samples covered (Additional File 1), and
the corresponding 18 P450 genes may thus be considered
constitutively expressed or house-keeping genes (last four
bins in Figure 1a). The complete P450 organ and tissue
expression matrix can be found at the 'CYPedia' web page
following the link 'view matrices'.
We compared expression of the highly specific genes with
expression data generated using a dedicated P450 array
generated by spotting gene specific PCR products [2].
Most organ specific genes identified here also show a pre-
dominant or exclusive expression in the respective organs
using the boutique array (not shown). Also on a larger
scale, the expression profile observed with the ATH1 array
is in good agreement with results from the boutique array
(Figure 2). We selected samples similar to those used on
the boutique array from the Affymetrix organ data set and
generated mean centered expression ratios from roots
compared to the average expression in all organs ana-
lyzed. The majority of P450s follow the same trend in
both array platforms with R
2
-values for a linear regression
of 0.508 (Figure 2). Another group is ambiguous, as its
expression is different from the average (more than two-
fold) using one platform, while the other suggests close to
average expression. Only for four genes opposing results
were obtained in the comparison of the two platforms.
Although correlations were less pronounced in the other
organ comparisons (data not shown), they also suggest a
good agreement between the different methods, in partic-
ular given the large difference in the biological material
used. The present analysis, however, benefits from a much
larger set of experiments.
Stress response
A large group of P450s is responsive to one or several
stresses across the 239 stress treatment experiments. More
genes are up-regulated than down-regulated. While 38
probe sets show induction in more than 20 experiments,
only two genes are repressed in more than 20 treatments.
The complete stress response matrix of all P450s can be
found at the 'CYPedia' web page following the link 'view
matrices'. To highlight stress induction of P450s, we
selected 49 probe sets representing 53 P450s showing
more than twofold up-regulation in at least 30% of the
experiments, within at least one of the treatment groups
(Additional File 2). A group of nine probe sets represent-
ing eleven P450s stands out as being strongly induced by
bacterial and fungal pathogens (Figure 3). These genes are
induced rapidly in incompatible interactions between A.
thaliana and Pseudomonas syringae, while induction in
compatible interactions is comparatively slower as it has
been observed for many defense related genes [12,13].
They are also induced by elicitors and by some abiotic
stresses including oxidative, osmotic, and UV stress (Fig-
ure 3, Additional File 2). Among these genes, CYP71B15
has been well characterized as being pathogen-responsive
and has been shown to encode an enzyme involved in the
last step of camalexin biosynthesis, the major A. thaliana
phytoalexin [14,15]. More recently, CYP71A13, was
shown to catalyze an earlier step in camalexin formation
[16]. Also previously characterized as differentially regu-
lated in compatible and incompatible interactions and
senescence is CYP76C2 [17], although in this case the pro-
tein function was not elucidated. Conversely, CYP710A1
had not been implicated in defense response, but was
BMC Plant Biology 2008, 8:47 />Page 4 of 19
(page number not for citation purposes)
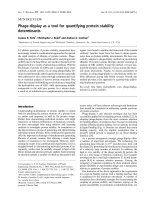
Expression in the organ and tissue datasetFigure 1
Expression in the organ and tissue dataset. Microarray data were retrieved from the Genevestigator database. Back-
ground was defined for each probe set as the mean intensity of all samples the probe set was called 'absent' (not significantly
higher (p < 0.06) than the signal observed with the corresponding mismatch probe set). a) Histogram describing the frequency
distribution of P450 genes expressed in the organ and tissue data set. Given in each bin is the number of probe sets represent-
ing P450 genes expressed more than twofold above background in 0% to 5%, 5% to 10%, etc., up to 95% to 100% of the 277
organ and tissue hybridization experiments. The number of genes in each bin is given on top of each bin. b) Genes that are
expressed in more than 80% of root, whole flower, or leaf samples (>twofold above background), but not in more than 20% of
all other samples (from a total of 277 samples) were selected. Shown are expression data of these genes in leaf, root, and
flower samples as indicated on top. Expression intensities are compared to background (defined as the mean intensity of all
samples called 'absent'
Number of genes
40
30
20
10
0
% of samples with detectable expression
0 20406080100
43
27
19
17
10
17
11
10
7
55
4
8
7
66
7
5
3
1
leaves
roots
flowers
floral
organs
71A19
86A1
81F3
705A20
705A22
708A1
71A16
705A1
705A13
96A2
705A24
86A7
96A15
706A3
71B24
71B36
76C5 / C6
log
2
()
sample
background
5
0
a) b)
BMC Plant Biology 2008, 8:47 />Page 5 of 19
(page number not for citation purposes)
shown to be involved in stigmasterol biosynthesis [18].
So far, no function or involvement in defense has been
described for the remaining genes in this group.
Another distinct cluster is defined by a group of 13 P450s
(starting with CYP74A in Additional File 2). These genes
are not (or weakly) responsive to pathogens, but are
induced by several abiotic stresses, in particular by
wounding, oxidative stresses (such as treatment with
paraquat, ozone or H
2
O
2
), genotoxic stress (imposed by
bleomycin), and by osmotic and salt stress (treatment
with mannitol and NaCl, respectively). Within this group
are the well characterized allene oxide synthase (AOS,
CYP74A) and the hydroperoxyde lyase (HPL, CYP74B2)
[19]. Both enzymes are involved in the oxylipin pathway
leading to the biosynthesis of jasmonate and other oxy-
genated lipid derivatives involved in stress signaling. Also
in this group is CYP86A2, which encodes an enzyme that
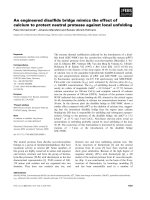
Comparison of expression data between platformsFigure 2
Comparison of expression data between platforms. P450 expression data generated using a spotted microarray cover-
ing gene specific PCR products (CYP-array) were retrieved from the 'Functional Genomics of Arabidopsis P450s' web page
(Table 1). In this analysis, signal intensities in roots from 1 week old seedlings were generated by comparison to a 'universal
RNA' sample [2]. Not detectable intensities were artificially set to a ratio of 0.05 compared to the 'universal control' and after
log
2
-transformation expression data were mean centered across the experiments. Expression data from published Affymetrix
ATH1 array hybridizations were processed as described in Methods. The mean intensities from 17 experiments derived from
young roots were selected. To generate a control similar to the 'universal RNA', mean intensities from 69 experiments cover-
ing similar samples were calculated and log
2
ratios were generated. Shown is a 2 × 2 plot comparing the mean centered expres-
sion ratios [log
2
(sample/mean)] from both platforms using data for all P450 genes represented on both array types. Data points
following the same trend are shown in black, points which are more than twofold different from the average expression in one
platform, but less than twofold different in the other are shown in gray. Red dots indicate genes with opposing expression
using the two platforms
CYP-array [log
2
(root/mean)]
ATH1-array [log
2
(root/mean)]
6
4
2
0
-2
-4
-6
-4 -2 0 2 4 6
BMC Plant Biology 2008, 8:47 />Page 6 of 19
(page number not for citation purposes)
?-hydroxylates fatty acids and is involved in cuticle oxyli-
pin metabolism [20,21].
Hormone response
Many P450s appear induced by treatment with methyl jas-
monate (MeJ) (Figure 4). While 22 P450s are induced in
more than 30% of all MeJ treatment experiments, only
three are repressed (Figure 4a). Among the former are
again CYP74A and CYP74B2, involved in the metabolism
of fatty acid hydroperoxides [19], which are well known
to be induced by jasmonate, but also a large number of
additional P450s (Figure 4b). Not all these are expected to
be involved in oxylipin metabolism, but the group may
include genes involved in other pathways regulated by jas-
monate. This holds true for CYP79B3, which converts
tryptophan to the corresponding oxime, thus leading to
the biosynthesis of indole glucosinolates, to camalexin,
and to auxin [22-24]. It is interesting to note that
CYP79B3 is repressed upon indole acetic acid (IAA) treat-
ments. Other obvious groups comprise P450s that are
strongly induced by IAA treatment (top of Figure 4b), or
repressed by gibberellic acid (GA) in seeds (lower part of
Figure 4b, starting with CYP84A1). In general, an exten-
sive crosstalk between different hormone responses is
apparent: eleven P450s are responsive to more than one
hormone (> twofold) in at least three treatment experi-
ments per hormone group. Antagonistic transcriptional
responses of individual P450s are apparent between IAA
and GA, MeJ and IAA, and cytokinin and IAA (Figure 4b).
Strikingly, most of the hormone responsive P450s, when
their functions are characterized, are themselves involved
in hormone biosynthesis or catabolism: e.g. CYP734A1
(BAS1) and CYP72C1 (SOB7) are both involved in brassi-
nosteroids catabolism [25,26], CYP735A2 is catalyzing
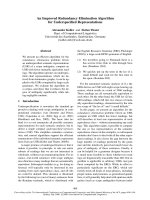
Pathogen induced expression of selected P450sFigure 3
Pathogen induced expression of selected P450s. Microarray expression data were retrieved from the 'Genevestigator'
database and processed as described in Methods. Selected genes that are up-regulated (>twofold) in more than 30% of at least
one treatment group as indicated on top are shown. The complete set of genes fulfilling this criterion is shown in Additional
File 2. Background corrected expression intensities were compared to untreated control experiments and log
2
-ratios were
used for visualization. The resulting heatmap is color coded as indicated. Details on the individual samples can be found in
Additional File 2.
CYP81F2
CYP71B15
CYP71A13/A12
CYP81D8
CYP710A1
CYP76C2
CYP71B23
CYP71A12
CYP82C2/C4
bacteria
fungi
elicitors
log
2
()
treatment
control
-2
2
0
BMC Plant Biology 2008, 8:47 />Page 7 of 19
(page number not for citation purposes)
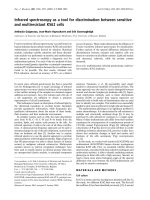
Hormone responsive expressionFigure 4
Hormone responsive expression. Microarray expression data were retrieved from the 'Genevestigator' database and
processed as described in Material and Methods. Background corrected expression intensities were compared to untreated
control experiments and log
2
-ratios were used. Genes that are up- or down-regulated (>twofold) in more than 30% of each
treatment group as indicated were selected. a) Number of P450s which are responsive to each treatment. b) Hierarchical clus-
ter analysis with complete linkage. The resulting heatmap is color coded as indicated.
CYP78A7
CYP734A1
CYP72C1
CYP81F2
CYP83B1
CYP81F4
CYP94C1
CYP94B1
CYP89A5
CYP71A19
CYP81D1
CYP74A
CYP81D11
CYP96A4
CYP74B2
CYP705A12
CYP84A4
CYP71A16
CYP79B2
CYP79B3
CYP705A1
CYP81F1
CYP51A2
CYP710A3/A4
CYP708A3
CYP705A25
CYP71B37
CYP82F1
CYP96A1
CYP707A2
CYP94B3
CYP707A1
CYP707A3
CYP86A4
CYP709B2
CYP89A9
CYP705A3
CYP76C5/C6
CYP71B36
CYP735A2
CYP87A2
CYP71B7
CYP706A7
CYP716A1
CYP72A14/A11/A13
CYP71B3/B24
CYP71B22
CYP84A1
CYP89A2
CYP71B14/B12/B13
CYP71B4
CYP71B26
CYP714A1
CYP77A6
CYP81H1
CYP85A2
CYP90A1
CYP709B3
IAA
CYT
GA
ABA
MeJA
ACC
BL
induced
repressed
20
15
10
5
0
number of genes
a)
b)
log
2
()
treatment
control
-3 3
0
BMC Plant Biology 2008, 8:47 />Page 8 of 19
(page number not for citation purposes)
trans-zeatin formation [27], and CYP79B2 is involved in
IAA biosynthesis [24,28]. Other hormone-responsive
P450s with so far uncharacterized functions may thus also
participate in hormone metabolic networks.
Mutant wild type comparisons
The mapping of P450 expression in mutants most often
highlights very specific responses in isolated mutants or
mutant groups. In a few cases only, subsets of ten or more
genes are co-regulated in response to one or several muta-
tions. Such coordinate responses provide leads to meta-
bolic pathways as shown below. The most striking feature
revealed by this data set is a very strong positive correla-
tion of the activation of the set of P450 genes involved in
stress response with the activation of the LEAFY gene [29].
The complete P450 mutant response matrix can be found
at the 'CYPedia' web page following the link 'view matri-
ces'.
In summary, expression matrices identify groups of genes
with specific functions during plant development or roles
in plant defense, and signaling networks. These may guide
further investigation into the function of individual mem-
bers of this large gene family, including fine expression
analyses, description of mutant phenotypes and tissue-
targeted metabolic profiling. Obvious hormonal network-
ing and cross-talk may help to identify other enzymes
involved in hormonal homeostasis and to highlight new
and so far overlooked signaling pathways.
Co-expression analysis
P450s catalyze slow and irreversible steps in all branches
of the plant secondary metabolism. The underlying
hypothesis of the CYPedia approach assumes that genes
acting in the same biochemical pathway are co-expressed.
When their function is known, P450s are usually co-regu-
lated with other enzymes in the same branch-pathway
[6,30]. Assuming that this may hold true also for yet
uncharacterized P450s, we performed a comprehensive
co-expression analysis comparing the expression of each
P450 with that of 4,130 selected genes involved in A. thal-
iana metabolism. These were retrieved from diverse data-
bases including 'KEGG', 'AraCyc, 'AcylLipid', BioPathAt',
and selected publications devoted to the annotation of
secondary metabolic pathways (Litpath) [30-35]. A list of
all pathways and the associated genes can be found from
the 'CYPedia' page following the link 'browse pathways'.
For these genes, we then added annotations derived from
the 'Functional Catalogue' at 'MatDB' [36] and manually
curated 'GeneOntology' terms from 'TAIR' [37], as well as
gene descriptions from 'TAIR' (Table 1). Based on a man-
ual assessment of the combined annotations and litera-
ture reviews, each gene was given an annotation score
reflecting the accuracy of the annotation (see Methods for
details).
The annotation information of each gene was combined
with expression data as described above for the P450
genes. Using the four expression vectors for each P450 as
bait we calculated Pearson correlation coefficients (r-
value) with each of the 4,130 selected genes for a total of
3.78 × 10
6
calculations on a Beowulf computer cluster. For
each P450, similarly expressed genes (r > 0.5) were kept.
Based on the number and annotation score of co-
expressed genes, co-expressed pathways were identified
for each P450 and expression dataset. The lists of co-
expressed pathways can be found from the 'CYPedia'
home page following the 'pathway maps' link for each
P450. From there, links can be found to the individual
heatmaps depicting the expression profile and detailed
information of all co-expressed genes in each of the four
data sets.
Validation of pathway prediction: the phenylpropanoid
metabolism as an example
In most cases, predicted functions based on top scoring
co-expressed pathways agree well with the actual function
of characterized P450s (Additional File 3). For 27 out of
43 P450s with known functions the correct pathway was
predicted using this approach (63% success rate). For an
additional four P450s, no co-expressed pathways were
identified. This was in most cases because the gene was
not expressed to detectable levels in any experiment. Of
the eleven P450s for which a wrong pathway was pre-
dicted based on co-expression analysis, three had the cor-
rect pathway present within the ten highest scoring
pathways. This leaves eight genes for which no correct
pathway was identified (19% false identification rate).
Most of those are involved in hormone metabolism.
Among the correctly predicted P450s are all three hydrox-
ylases involved in lignin part of the phenylpropanoid
pathway [38]. For example, when using CYP73A5 encod-
ing cinnamate 4-hydroxylase (C4H) as bait, both in the
organ and stress data sets all other genes characterized to
act in the general phenylpropanoid pathway were
retrieved with r-values higher than 0.5 (Additional File 4).
Correlations were less pronounced in the remaining two
datasets, but the annotated pathways 'Phenylpropanoid
Metabolism' (BioPath) and 'Lignin biosynthesis' (AraCyc)
were the top scoring pathways found in all four data sets
in accordance with the actual biochemical function of
CYP73A5 [39]. Not only genes of different branches of the
downstream phenylpropanoid pathways, but also iso-
forms for all upstream steps in the shikimate pathway [30]
leading to phenylalanine biosynthesis are co-expressed,
thus reconstituting the full pathway (Additional File 4).
It is important to note that a significant proportion of
P450s might act in biochemical pathways not yet eluci-
dated and may produce natural compounds which were
BMC Plant Biology 2008, 8:47 />Page 9 of 19
(page number not for citation purposes)
never described. Obviously, genes in such unknown path-
ways have not been annotated, and it is therefore impos-
sible to predict these pathways using the co-expression
approach. However, even in such cases valuable informa-
tion can be obtained by careful inspection of co-expressed
genes. This may be exemplified using the CYP98 family.
CYP98A3 encodes p-coumaroyl shikimate/quinate 3'-
hydroxylase (C3'H) and is involved in the biosynthesis of
monolignols [40,41]. This gene is tightly co-expressed
with C4H and most other characterized genes involved in
the general phenylpropanoid pathway (Additional File 4).
Two other genes of the same family (CYP98A8 and
CYP98A9) share extensive sequence similarity with
CYP98A3, but were shown not to encode C3'H [41]. Both
CYP98A8 and CYP98A9 share an overlapping expression
pattern that is very distinct from C3'H, with expression
predominantly in floral tissues (Figure 5 & Additional File
5). In the organ data set, the top scoring co-expressed
pathway for both genes appears as 'miscellaneous acyl
lipid metabolism' (AcylLipid) due to a large number of
putative and known genes related to fatty acid metabo-
lism, which are likely involved in pollen coat/wall devel-
opment. However, several genes related to the
phenylpropanoid pathway are also co-expressed with
CYP98A8 and CYP98A9 (highlighted in orange in Figure
5). Altogether, they encode 'phenylpropanoid-like'
enzymes with unknown functions sharing sequence simi-
larities with characterized phenylpropanoid enzymes
Expression analysis using CYP98A8 as baitFigure 5
Expression analysis using CYP98A8 as bait. Data from published Affymetrix microarrays representing 167 organ and tis-
sue samples were retrieved from the Genevestigator database [10]. Background correction and ratio log
2
-ratio generation was
performed as describe in Methods. The expression vector of CYP98A8 was compared to those of 4,119 genes annotated in
diverse databases to be involved in any metabolic pathway using the 'ExpresionAngler' algorithm [9]. Expression profiles of co-
expressed genes with a correlation coefficient of more than 0.6 are shown as a heatmap. Groups of samples are indicated on
top of the heatmap. Mean-centered signal intensity ratios are color coded as indicated on the bottom of the heatmap. Genes
with similarity to enzymes of the phenylpropanoid pathway are highlighted in orange. Genes related to lipid metabolism are
highlighted in blue. Detailed information on the co-expressed genes and samples can be found in Additional File 5. To the right
a section of the phenylpropanoid pathway is outlined in red and the putative duplicated pathway as hypothesized based on the
co-expression analysis of CYP98A8 is outlined in orange.
4-coumarate
4-coumaroyl-CoA
4-coumaroyl-shikimate
4-caffeoyl-shikimate
4-caffeoyl-CoA
4-feruloyl-CoA
coniferaldehyde
coniferyl-alcohol
4CL
HCT
HCT
CCoAOMT
CCR
CAD
C3'H,
CYP98A3
?? -COOH
?? -CoA
?? -shikimate(?)
HO- ?? -shikimate(?)
OH- ?? -CoA
H3C-O- ?? -CoA
4CL-like
HCT-like
HCT-like
CCoAOMT-like
DFR-like
H3C-O- ?? -C
O
H
C3'H-like,
CYP98A8 / A9
Phenylpropanoid
pathway
New pathway
phenylpropanoid like genes
lipid metabolism related genes
suspension cells
calli
seedlings
leaves
roots
stems
shoot apices
flowers
pollen
siliques/seeds
At1g74540
At5g60500
At5g60510
At4g14815
At1g13150
At1g01280
At1g13140
At5g07520
At4g29250
At5g07560
At2g19070
At3g51590
At1g75940
At3g52160
At1g08065
At1g28430
At5g07510
At1g71160
At5g07530
At5g07540
At1g30350
At4g34850
At1g62940
At5g07550
At5g07230
At3g11980
At3g26125
At1g06250
At1g67990
At4g28395
At2g23800
At1g66850
At1g23240
At4g14080
At1g03390
At5g62080
At3g07450
At3g52130
At4g16270
At5g13380
At5g52160
At1g74550
At1g21540
At4g35420
At5g14980
At4g32170
At1g23250
At5g54010
At1g63710
At5g49070
At5g55720
At1g02050
At5g17200
CYP98A8
LTP-family
CYP86C4
CYP703A2
CYP86C3
GRP18
GRP20
HCT-like
LTP-family
ATA27
CYP705A24
GRP14
GRP17
GRP16
CHS-like
4CL-like
GRP19
LTP-family
MS2
CYP86C2
lipase family
CCOMT-like
ATA7
GGPS2
LTP-family
ATA6
HCT-like
LTP-family
LTP-family
LTP-family
PER40
GH3-like
LTP-family
CYP98A9
ABP-like
DFR-like
lipase-family
CYP96A2
CYP86A
CUT-like
CHS-family
H3C-O- ?? -CH
2
OH
log
2
()
treatment
control
-3 3
0
?
BMC Plant Biology 2008, 8:47 />Page 10 of 19
(page number not for citation purposes)
[30,32,35]. This co-expression group thus appears to
result from the duplication of at least a portion of the phe-
nylpropanoid pathway and its subsequent recruitment for
a novel flower specific pathway (Figure 5). Identification
of the substrate(s) of any of these enzymes should lead to
the elucidation of this 'phenylpropanoid-like pathway'.
In summary, these examples show that co-expression
analysis combined with pathway mapping of co-
expressed genes is a powerful tool to identify genes encod-
ing enzymes acting in the same biochemical pathway. As
a proof of concept, the majority of known P450s were
placed in the expected pathway. But the approach also
provides leads to novel pathways for a large set of orphan
P450s.
P450s related to plastidial activity (chlorophyll/carotenoid
pathways)
One of the most striking features revealed by the co-
expression analysis is an unexpectedly large subset of
P450 genes being mapped to pathways identified as 'plas-
tidial isoprenoids' (BioPath), 'photosystems' (BioPath),
'photosynthesis' (KEGG or FunCat), and 'biogenesis of
the chloroplast' (FunCat). At the 'CYPedia' homepage fol-
low the link 'browse pathways' and 'CYP => pathway' to
the corresponding database for detailed information.
Their pathway predictions scores, frequently far above
500, are the highest of the whole analysis. Those include
CYP97A3 and CYP97C1 that were recently shown to be
involved in the hydroxylation of the ?- and ?-rings of car-
otenoids [42,43], but also as many as 79 other still orphan
P450 genes.
All these genes show very similar expression patterns, as
exemplified in Figure 6 (see also Additional File 6) for
CYP97A3, with very high expression in all green tissues.
They also frequently show down-regulation upon patho-
gen attack in leaf tissues (not shown). Eleven of them are
predicted to have a plastidial localization based on a
ChloroP prediction. Based on manual assessment, Schuler
and co-workers identified eleven P450s to be likely local-
ized to the plastids [2]; seven of these are among the
group with predicted plastidial activity. This may suggest
that the role of P450 oxygenases in the metabolism of
plastidial (di)terpenoid derivatives, such as carotenoids,
chlorophyll prosthetic group, tocopherols, phyllo- and
plastoquinones, was so far overlooked. It may also indi-
cate that a number of plant P450 enzymes have functions
related to primary photosynthetic metabolism for the syn-
thesis of antioxidants, plastidial structural components,
signaling molecules related to energetic metabolism or
light perception. The latter case is illustrated by CYP90A1
that shows the typical expression pattern depicted in Fig-
ure 6. CYP90A1 catalyzes the 23-hydroxylation step in the
biosynthesis of brassinosteroids [44] and was recently
reported to be under diurnal light-dependent control
[45]. On the other hand, some P450 in this group may
have house-keeping function or be involved in the bio-
synthesis of constitutive natural products, which are spa-
tially and temporally coupled to energy production and
active plant growth. CYP86A2, which was recently
described as involved in the biosynthesis of cuticular lip-
ids [21], may be representative of this latter category.
Candidate P450s acting on triterpenoid compounds
Terpenoids are C5 isoprene-derived compounds which
form the largest and most diverse class of natural prod-
ucts. In plants, they play important roles in development
and adaptation via hormones and antioxidants, but most
of them are mediators of antagonistic or beneficial inter-
actions with other organisms, such as defense against
pathogens or attraction of pollinating insects [46]. Among
these, triterpenes are produced from 2,3-oxidosqalene by
triterpene synthases (TTPS) encoded by 13 genes (includ-
ing the sterol cyclases CAS and LAS) in A. thaliana [47].
Each TTPS produces a unique set of terpenoids, which
may then be further modulated, e.g. hydroxylated, by
P450s to generate the plethora of decorated triterpenoid
compounds. While many TTPS genes have been character-
ized, only one P450 involved in triterpenoid modification
has been identified [48]. Our pathway mapping approach
identified 63 P450s as co-expressed with genes placed in
the category 'triterpene, sterol, and brassinosteroid metab-
olism' (LitPath) among them 27 belonging into the cate-
gory 'triterpene biosynthesis' (from the 'CYPedia'
homepage follow the link 'browse pathways' and 'path-
way => CYP' to 'LitPath'). In order to further identify indi-
vidual pairs of TTPS and P450 genes possibly acting in
concert, we calculated, for each expression data set, corre-
lation coefficients comparing expression vectors of each
TTPS with each P450. For seven of the TTPS genes, up to
six tightly co-expressed P450s (r > 0.75) were identified
(Table 2). A total of 20 P450s (represented by 18 probe
sets) are co-expressed with at least one TTPS in at least one
of the datasets. None of these P450s has been character-
ized to date. Seven of these belong to the CYP705 family,
while no other family is represented by more than two co-
expressed genes, indicating a particular role for this family
in triterpenoid modulation, which may be driven by
CYP705/TTPS co-evolution.
The strongest correlations were found for TTPS6 and
TTPS5 (MRN1). TTPS6 (thalianol synthase) catalyzes the
cyclization of 2,3-epoxysqualene to form the tricyclic trit-
erpene thalianol [49], while MRN1 catalyzes an atypical
epoxysqualene cyclization into a monocyclic iridal triter-
pene named marneral [50]. Neither product nor further
metabolites have yet been identified in planta. Related
iridal triterpenoids were however described in Iridaceae.
MRN1 and TTPS6 share an overlapping expression pattern
BMC Plant Biology 2008, 8:47 />Page 11 of 19
(page number not for citation purposes)
Co-expression analysis of a P450 associated with plastidial activity: CYP97A3Figure 6
Co-expression analysis of a P450 associated with plastidial activity: CYP97A3. Microarray expression data were
retrieved from the 'Genevestigator' database and processed as described in Methods. The organ expression vector of CYP97A3
was used as bait for co-expression analysis as described in Figure 4. The expression vector of the bait CYP97A3 (first row) is
shown across 167 organ and tissue samples. 50 co-expressed genes having a correlation coefficient of r > 0.84 are shown in
subsequent rows. The resulting heatmap is color coded as indicated. Highlighted in green are genes from the categories 'plas-
tidial isoprenoids' (BioPath), 'photosystems' (BioPath), 'photosynthesis' (KEGG or FunCat), and 'biogenesis of the chloroplast'
(FunCat). Detailed information on the co-expressed genes and samples can be found in Additional File 6. Up to 80 additional
P450s in the CYPedia analysis share a similar expression profile and pathway prediction.
At1g31800
At2g26500
At2g35370
At4g21280
At5g23120
At1g62750
At2g30390
At5g36700
At5g36790
At5g66190
At3g63140
At1g20020
At2g29630
At4g18480
At4g34190
At4g09650
At4g33010
At3g51820
At4g04640
At1g42970
At1g32470
At3g26570
At3g55800
At1g20340
At3g55330
At4g38970
At5g13510
At1g12900
At1g67740
At5g04140
At1g09340
At1g03630
At1g17220
At3g48420
At1g06680
At5g17230
At1g31330
At3g50820
At4g35250
At5g46110
At1g44575
At5g13630
At5g47840
At1g60950
At4g37930
At5g09660
At3g12780
At3g53920
At4g39970
At3g26650
At1g10960
petM
GDCH
PSBQ1
HCF136
CHLI1
ATPC1
GAPB
PHT2.1
SBPase
DRT112
PSBY
GLU1
PORC
OEC23
PSY
PsbO
APE2
NPQ4
GUN5
FED A
SHM1
PGK1
SIGC
GAPA
suspension
cells
calli
seedlings
leaves
roots
stems
shoot apices
flowers
pollen
siliques/seeds
CYP97A3,
LUT5
log
2
()
sample
average
-3 3
0
BMC Plant Biology 2008, 8:47 />Page 12 of 19
(page number not for citation purposes)
with the same set of four P450s in all data sets, though
most pronounced in the organ data (Figure 7, Additional
File 7). They are highly expressed in roots, seedlings
(potentially the root part thereof), and some cell cultures.
Within the cluster, CYP705A5 and CYP708A2 are
expressed more similar to TTPS6, while CYP705A12 and
CYP71A16 share a more similar organ pattern with
MRN1, being expressed mainly in more mature root sam-
ples (Figure 7). Likewise, this gene set forms a separate
cluster in the hormone data set, with induced expression
upon cytokinin (zeatin) and MeJ treatments, with again
the same sub-clustering (Additional File 7). MRN1 is not
stress responsive (and therefore having no co-expressed
P450s in the stress data set), but TTPS6, CYP705A5 and
CYP708A2 form a clear cluster characterized by induced
expression in roots upon wounding, drought, and some
other stressors, although r-values are comparatively low
(Table 2, Additional File 7). The whole group forms again
a strong cluster in the mutant data set with a typical
expression pattern. It displays repressed expression in det2
and ga1 mutants (Additional File 7), which are blocked in
the biosynthesis of brassinosteroids and gibberellic acid,
respectively [51,52]. It appears thus that blockage of hor-
mone pathways branching upstream of TTPS action
results in down-regulation of these pathways as well.
In summary, two subgroups of strongly co-regulated
genes were identified. Among them, CYP705A5 and
CYP708A2 are good candidates for catalyzing further
modifications, possibly sequential hydroxylations, of
thalianol to form a stress responsive, root specific triterpe-
noid. While this manuscript was under evaluation, this
prediction was fully confirmed by the functional charac-
terization of the thalianol pathway by Fields and Osbourn
[53]. Their characterization of this pathway was guided by
an operon-like physical clustering of the co-expressed
genes. CYP705A12 and CYP71A1, on the other hand, are
more likely involved in modifications of marneral to form
a triterpene iridoid derivative, similar to multi-hydroxy-
lated iridoids so far considered as characteristic of Iri-
daceae [54]. Equally consistent leads were obtained from
the clustering analysis of other P450s related to triterpe-
noid pathways initiated by TTPS1, TTPS2, and TTPS3.
P450s related to plant hormone biosynthesis
Cytochrome P450s play central roles in the metabolism of
all classes of plant hormones [4]. Our co-expression
approach was in particular successful in the case of the
octadecanoid pathway leading to the biosynthesis of jas-
monate and other oxylipins. Jasmonate is a well character-
ized stress response signal that also fulfills hormonal
actions in stamen and pollen development [55]. Both
characterized P450s acting in this pathways, allene oxide
Table 2: Pearson correlation coefficients comparing expression vectors of triterpene synthase (TTPS) genes with P450s
r-values
Name Description Co-expressed P450 Organ Stress Hormone Mutant
TTPS1 multiproduct triterpene synthase(At1g78500/
263123_at)
CYP81D6 or D7 (At2g23220 or At2g23190,
245072_s_at)
0.91 0.07 0.01 0.95
CYP705A23 (At3g20140, 257114_at) 0.50 0.01 0.91 0.71
CYP72A9 (At3g14630, 258111_at) 0.87 0.08 -0.07 0.22
CYP702A1 (At1g65670, 264634_at) 0.83 0.03 -0.13 -0.49
CYP81D2 (At4g37360, 253091_at) 0.82 -0.15 -0.03 0.32
CYP709B1 (At2g46960, 266736_at) 0.75 0.03 0.04 0.54
TTPS2 arabidiol synthase CYP705A25 (At1g50560, 261878_at) 0.80 0.28 0.65 -0.08
(At4g15340/245258_at) CYP705A27 (At1g50520, 261879_at) 0.77 0.38 0.25 0.20
TTPS3 2,3-oxidosqualene cyclase-like CYP702A2 (At4g15300, 245547_at) 0.88 0.75 0.09 0.07
(At4g15370/245553_at) CYP705A2 (At4g15350, 245551_at) 0.82 0.61 0.26 -0.16
MRN1, marneral synthase CYP705A12 (At5g42580, 249202_at) 0.82 0.36 0.67 0.78
TTPS5 (At5g42600/249205_at) CYP71A16 (At5g42590, 249203_at) 0.80 0.42 0.73 0.74
TTPS6 thalianol synthase CYP705A5 (At5g47990, 248727_at) 0.92 0.55 0.89 0.84
(At5g48010/248729_at) CYP708A2 (At5g48000, 248728_at) 0.92 0.77 0.90 0.87
CYP71A16 (At5g42590, 249203_at) 0.83 0.44 0.60 0.81
CYP705A12 (At5g42580, 249202_at) 0.77 0.31 0.55 0.68
LS1 multiproduct triterpene synthase (At1g66960/
255912_at)
CYP89A7/A4 (At1g64930/At2g12190,
262865_at)
-0.02 NA 0.92 0.01
TTPS4 2,3-oxidosqualene cyclase-like CYP716A2 (At5g36140, 249686_at) 0.49 0.30 0.79 0.29
(At5g36150/249687_at) CYP716A1 (At5g36110, 249684_s_at) 0.26 0.21 0.78 0.12
CYP722A1 (At1g19630, 261134_at) -0.10 0.08 0.76 0.07
For each TTPS, all P450s are shown that have an r-value of more than 0.75 in at least one data set with the given TTPS.
BMC Plant Biology 2008, 8:47 />Page 13 of 19
(page number not for citation purposes)
synthase (AOS, CYP74A) and hydroperoxide lyase (HPL1,
CYP74B2) [19], were correctly placed in the pathways 'jas-
monic acid biosynthesis' (TAIR-GO) and 'lipoxygenase
pathway' (AraCyc), respectively. However, additional
P450s might be involved in the metabolism of jasmonate
(e.g. catalyzing hydroxylations of jasmonate) and other
oxylipins. In addition, a subset of genes involved in
defense or plant development is expected to be selectively
activated by the jasmonate cascade. Indeed, as many as
ten additional P450s are co-expressed with genes related
to jasmonate signaling (i.e. being placed into the catego-
ries 'jasmonic acid biosynthesis' [AraCyc], 'jasmonic acid
biosynthesis' [TAIR-GO], or 'response to jasmonic acid
stimulus' [TAIR-GO]). Table 3 lists correlation coefficients
with jasmonate related genes for P450s, which have co-
expressed gene in at least two data sets, and which have
more than five co-expressed genes in at least one data set.
Four so far uncharacterized P450s share a common hor-
mone-response profile with many jasmonate related
genes (top of Table 3), due to a strong and specific induc-
tion upon methyljasmonate treatment. These genes also
share a common profile with jasmonate related genes in
other datasets (Table 3). Phylogeny and in vitro functional
analysis predicts most of them (CYP94s, CYP96A4) to be
involved in the metabolism of oxylipins [56]. For a sec-
ond group of genes, correlated expression with the jas-
monate pathway is especially striking in the organ data set
(bottom of Table 3). Those are known or predicted to par-
ticipate in the light perception/plastidial activity
(CYP97B3, CYP90A1[44], CYP72A11), or the biosythesis
of glucosinolates (CYP83B1 [57], CYP71B7). It is interest-
ing to note that in the case of 12-oxophytodienoate
reductases, OPR3 is co-expresssed with most of P450s
(including AOS and HPL1) in the hormone and stress
data sets, while OPR2 shares a similar expression with
P450s exclusively in the organ data set.
Distinct P450 subsets were associated with various other
hormone pathways (not shown). However, r-values are
generally lower compared to the jasmonate related genes
and co-expression is limited to fewer genes in the respec-
tive pathways. This may be due to the fact that metabo-
lism of these hormones is less characterized, or, more
likely, due to the relatively low and cell/tissue specific
expression of most of the genes involved in these hormo-
nal pathways.
In summary, the co-expression approach associates
groups of P450s with specific hormonal pathways. The
analysis is however more informative in the case of stress
signaling which involves strong responses than in the case
of low concentration hormones controlling plant devel-
opment. It is thus expected to mainly support characteri-
zation of new stress signaling pathways.
Conclusion
The abundance of publicly available microarray expres-
sion data provides a stunning amount of information that
Organ expression of co-expressed triterpene synthases (TTPS) and P450sFigure 7
Organ expression of co-expressed triterpene synthases (TTPS) and P450s. Microarray expression data were
retrieved from the 'Genevestigator' database and processed as described in Methods. Expression vectors from the organ and
tissue data sets of five TTPS genes (from A. thalaina was used as a bait for co-expression analysis comparing it's expression with
that of all P450 genes. We retained five TTPS genes, which were co-expressed (r > 0.75) with at least one P450 in the organ
and tissue expression data set, and the corresponding P450s (Table 2). This set of genes was used visualize expression. TTPS (in
bold) and correlated P450 genes with high correlation coefficients are color coded.
CYP709B1
CYP702A1
CYP81D2
CYP81D6 / D7
CYP72A9
TTPS1
CYP705A25
TTPS2
CYP705A27
CYP702A2
CYP705A2
TTPS3
CYP708A2
CYP705A5
TTPS6
CYP705A12
CYP71A16
TTPS5
suspension
cells
calli
seedlings
leaves
roots
stems
flowers
floral organs
siliques /
seeds
name
shoot apexes
BMC Plant Biology 2008, 8:47 />Page 14 of 19
(page number not for citation purposes)
has been exploited only sparsely to date. A correlation
between gene expression and their biological/biochemi-
cal roles is necessary, and when genes encode metabolic
enzymes acting in the same pathway, they are expected to
be co-regulated. The data presented here covering known
pathways largely confirm these assumptions. Based on co-
expression analysis of the complete P450 superfamily in
A. thaliana we have generated novel hypotheses regarding
biochemical and biological functions for a large number
of individual genes or gene groups involved in common
pathways. Strikingly, the first validation of a new pathway
predicted from our data was published independently
during evaluation of this manuscript [53], thus further
confirming the potential of this approach. More leads will
emerge from this analysis in the next years, supported by
an increasing number of characterized genes functions.
New hypotheses can now be addressed experimentally by
exploiting the expanding toolbox of reverse genetics, such
as insertion mutants combined with targeted metabolic
profiling, and by reverse biochemistry using collections of
recombinant proteins and medium throughput screening
of substrate collections [58]. The same approach can also
be extended to other gene families, including transcrip-
tion factors, and thus has the potential to considerably
accelerate the molecular understanding of plant natural
product metabolic networks and regulation.
Materials and Methods
Probe set selection and expression data of P450 genes
A collection of all cytochromes P450 from A. thaliana
(271 genes as of April 2005) and the corresponding AGI
(Arabidopsis Genome Initiative) locus identifiers
(Atxgxxxxx) were retrieved from the' PlaCe Arabidopsis
P450 database' (Table 2). For 21 P450 genes annotated at
PlaCe, no AGI locus was associated. Those included 18
annotated pseudogenes. Two pairs of P450 genes were
associated with the same AGI-locus (CYP71A27P and
CYP71A28: At4g20240; CYP71A23 and CYP71A24:
At3g48290), leaving a total of 248 AGI loci. These were
used to identify corresponding probe sets on the Affyme-
trix ATH1 microarray using the 'Genevestigator' probe
selection tool [10]. 21 genes were not represented on the
array. The remaining 227 genes were represented by a
total of 229 probe sets, with 26 genes being represented by
more than one probe set, and 32 probe sets representing
more than one gene. Using the 'Genevestigator' probe
selection tool we identified all genes recognized by these
probe sets, and if more than one probe set was present for
a given gene, we selected a single, specific (if available)
probe set for that gene. This resulted in 216 selected probe
sets; of these 191 recognize a single P450 gene, 21 recog-
nize two genes, 3 probe sets may hybridize with three
genes and one recognizes four genes for a total of the 227
Table 3: Pearson correlation coefficients comparing expression vectors of jasmonate related genes
P450 name Data set Correlation coefficient (r-value) of P450 with jasmonate related gene
LOX2 LOX3 LOXL1 LOXL2 AOS HPL1 AOC1 AOC2 AOC4 OPR2 OPR3 OPRL1/2 TAT3 JR2
CYP74A organs 0.64 - - - 1.00 - 0.88 - - 0.56 0.69 - 0.60 0.70
AOS stress 0.67 0.58 - - 1.00 0.60 0.81 - - - 0.71 - - -
hormones 0.57 0.81 - 0.79 1.00 0.59 0.80 0.80 - - 0.86 - 0.71 0.55
mutants - 0.61 0.50 - 1.00 - 0.62 - - - - - - 0.51
CYP81D1 organs - - - - - - - - - - - 0.55 0.66 -
stress 0.52 - - - 0.57 0.51 0.50 - - - 0.60 - 0.61 0.53
hormones - 0.51 - - 0.52 - 0.63 - - - 0.61 - 0.54 -
CYP94C1 stress - 0.58 - - - - - 0.67 - - 0.61 - - -
hormones - 0.79 - 0.79 0.69 - 0.58 0.63 - - 0.79 - 0.55 -
mutants - 0.69 - 0.71 - - - 0.62 - - 0.61 - - -
CYP94B1 hormones - 0.64 - 0.61 0.61 0.53 0.51 - - - 0.64 - - -
mutants - 0.62 - 0.51 0.63 - 0.51 - - - 0.60 - - -
CYP96A4 organs 0.60 0.56 - 0.50 0.64 0.52 0.61 - - - 0.61 - 0.65 0.57
hormones - 0.64 - 0.60 0.74 0.71 0.60 - - - 0.72 - - -
CYP74B2 organs 0.73 - - - - 1.00 - - 0.52 - - - - 0.62
HPL1 stress 0.67 - - - 0.60 1.00 0.53 - - - 0.57 - - 0.54
CYP97B3 organs 0.71 - - - 0.58 0.59 0.63 - - - - 0.66 - 0.65
CYP90A1 organs 0.63 - - - 0.56 - 0.57 - 0.66 - - 0.51 - 0.56
CYP72A11 organs 0.74 - - - 0.69 - 0.78 - 0.53 - 0.56 0.65 0.52 0.67
CYP83B1 organs - - - - 0.76 - 0.69 - - 0.57 0.63 - 0.58 0.55
CYP71B7 organs - - - - 0.80 - 0.82 - - 0.61 0.52 - 0.52 0.56
CYP72A8 organs 0.59 - - - 0.56 - 0.62 - - 0.60 - 0.68 0.59 -
Shown are genes in the pathways, which have at least one co-expressed P450; only P450s are shown, which have at least six co-expressed jasmonate genes (r > 0.5) in at least
one data set. Abbreviations of genes (AGI locus and Affymetrix probe set are given in brackets): LOX2: lipoxygenase 2 (At3g45140, 252618_at); LOX3: lipoxygenase 3
(At1g17420; 261037_at); LOXL1: lipoxygenase like 1 (At1g67560; 260190_at); LOXL2: (At1g72520; 260399_at); AOS, CYP74A: allene oxide synthase (At5g42650;
249208_at); HPL1, CYP74B2: hydroperoxide lyase 1 (At4g15440; 245253_at); AOC1: allene oxide cyclase 1 (At3g25760; 257641_s_at); AOC2: allene oxide cyclase 2
(At3g25780; 257644_at); AOC4: allene oxide cyclase 4 (At1g13280; 259366_at); OPR2: 12-oxophytodienoic acid reductase 2 (At1g76690; 259875_s_at); OPR3: 2-
oxophytodienoate reductase 3 (At2g06050; 265530_at); OPRL1/2: 12-oxophytodienoate reductase like 1 and 2 (At1g17990/At1g18020; 255895_at); TAT3: tyrosine
aminotransferase 3 (At2g24850; 263539_at); JR2: cystine lyase, jasmonic acid response 2.
BMC Plant Biology 2008, 8:47 />Page 15 of 19
(page number not for citation purposes)
represented P450s, and three non-P450 genes (flanking
genes that are also recognized by the probe set). The probe
sets used and the genes recognized by these probe sets can
be found at the 'CYPedia' home page.
We then retrieved normalized expression data for these
probe sets from the 'Genevestigator Digital Northern' tool
[10]. Data were downloaded in May 2005 (dataset 1), cov-
ering 1,823 microarray experiments, and in April 2006
(dataset 2, an update including dataset 1) covering 2,202
microarrays. For each probe set, background was defined
as the average signal intensity of all probes called 'absent'
by the Affymetrix software, and all absent probes were set
to this background value. If replicate arrays were available,
the mean intensity of all replicates was determined. Each
experiment was placed in one of the following four cate-
gories: i) organ and tissue samples from wild type plants,
ii) stress treatment of wild type plants, iii) hormone,
nutrient (deprivation), and other treatments of wild type
plants, and iv) mutant plants compared to wild type sam-
ples treated equally (if applicable). Signal intensities from
organ and tissue samples were then compared to the back-
ground intensities, thus generating log
2
-ratios over back-
ground. Intensities from both treatment groups were
compared to signal intensities from the corresponding
control samples generating log
2
-ratios comparing treat-
ment with control, and intensities from mutant samples
were compared with intensities from equally treated wild
type samples thereby generating log
2
-ratios for mutants
compared to wild-type. Each dataset was divided into 30
expression groups using K-means clustering and the com-
bined heatmaps from all clusters can be found at the
'CYPedia' home page following the link 'view matrices'.
For visualization of the expression matrices the 'HeatMap-
per' tool at the 'Bio-Array Resource (BAR)' [9] was used
and the resulting heatmaps were incorporated into com-
monly used spreadsheet formats (Adobe PDF, Microsoft
Excel and OpenOffice Calc).
Selection of metabolic genes
A list of genes related to any aspect of plant metabolism
(pathway database) was generated by retrieving all A. thal-
iana genes, which were annotated in the following data-
bases: i) 'KEGG Orthology (KO) – Arabidopsis thaliana'
(KEGG) [59], ii) the 'Metabolic Pathways' at 'The Arabi-
dopsis Information Resource' (AraCyc) [60]; iii) the 'Ara-
bidopsis Lipid Gene Database' (AcylLipid) [61], iv) the
'Biochemical Pathway Knowledge Database' (BioPathAt)
[34], v) a selection of publications devoted to the annota-
tion of secondary metabolic pathways (Litpath) [30-
33,35,62]. Information from all databases were combined
in one data matrix and Affymetrix probe sets were selected
for the set of unique genes as described above resulting in
4,129 unique probe sets. For this set of genes, annotations
were added that were derived from the 'Functional Cata-
logue' at the 'Munich Information Center for Protein
Sequences (MIPS-FunCat) [36] and manually curated
'GeneOntology' terms from TAIR [63] (i.e. having the evi-
dence codes IDA [inferred from direct assay], IMP
[inferred from mutant phenotype] and/or TAS [traceable
author statement].
Each gene was given a pathway annotation score with: ten
points for biochemically characterized genes (i.e. annota-
tion as 'functional' in 'AcylLipid' or 'BioPath', or identified
in literature reviews); nine points for genes with immedi-
ate biochemical function described as IDA in TAIR-GO,
eight point for genes annotated as 'functional(?)' or
'inferred from mutant phenotype' in 'AcylLipid', 'Bio-
Path', or literature; seven points for genes with evidence
code IMP at TAIR-GO; six points for genes with a
described mutant phenotype, but with unclear molecular
function; five points for genes with high similarity (WU-
BLAST e < 10
-50
) to a characterized plant gene; four point
for genes with high similarities to another plant gene, but
function of that gene not validated; three points for genes
with similarity (WU-BLAST 10
-10
e < 10
-50
) to a character-
ized plant gene; two points for genes with low similarities
(WU-BLAST e > 10
-10
) to a characterized plant gene; one
point for members of large gene families with low similar-
ities (WU-BLAST e > 10
-10
) to a characterized plant gene.
Co-expression analysis and pathway mapping
Affymetrix expression data for the selected 4,129 probe
sets were retrieved and processed as described above for
the P450s and the expression matrices were merged. Co-
expression analysis was performed as described earlier [9].
In brief, expression vectors were mean-centered and Pear-
son correlation coefficients (r-values) were calculated
between the expression vector of each P450 and those of
the 4,129 genes in the "pond" for each data set. Subse-
quent manipulations were performed using the R envi-
ronment [64]. For each P450 and data set co-expressed
genes with r > 0.5 were retrieved and the corresponding
biochemical pathways were extracted from the pathway
database (see above). For each pathway, the number of
co-expressed genes was counted and the sum of annota-
tion scores (see above) was calculated. The pathway was
retained only when at least one gene in the list had more
than six annotation points. The number and the score of
co-expressed genes in a given pathway was compared to
the total number and score of all genes in that pathway.
Based on a tailed hypergeometric distribution analysis
only pathways over-represented in the group of co-
expressed genes (p [hyper] < 0.005) were retained. Subse-
quently, pathways identified in all four datasets were
identified and the number and scores of genes found in
each dataset were summed. The resulting tables were
sorted according to scores and imported into an OpenOf-
fice Calc (OpenOffice.org) template and thumbnails of
BMC Plant Biology 2008, 8:47 />Page 16 of 19
(page number not for citation purposes)
the actual expression heatmaps, generated using the
'Heatmapper plus' tool at the 'BAR' [9], were added and
saved in html format. Results for each P450 can be found
at the 'Pathway Map' webpage for each P450. Expression
data and pathway information data for co-expressed genes
(r > 0.5 for a maximum of 50 genes) were merged and
sorted according to r-value. Expression tables were color
coded using the 'Heatmapper plus' tool at the 'BAR' and
saved as static web pages linked to the corresponding
pathway maps.
Array platform comparison
P450 expression data generated using a spotted microar-
ray covering gene specific PCR products were retrieved
from the 'Functional Genomics of Arabidopsis P450s'
web page (Table 1). Using this dual channel platform
(CYP-array), signal intensities in roots from 1 week old
seedlings (and four other organs) were generated by com-
parison to a 'universal RNA' sample. This 'universal RNA'
consists of a mixture of RNAs derived from roots and
shoots from seedlings and leaves, stems and flowers from
mature plants [2]. In order to generate a similar 'universal
control' from public ATH1 microarrays, we selected 14
shoot samples from seedlings, 9 leaf samples from mature
plants, 17 root samples from seedlings, 19 whole flower
samples, and 10 stem samples from the processed organ
data set (see above). We then calculated the mean log
2
intensities over background form all samples and com-
pared it to the mean intensity of the root samples and
thereby created root/'universal control' ratios similar to
those from the CYP-array. For the latter, not detectable
intensities were artificially set to a ratio of 0.05 compared
to the universal control and ratios were log
2
-transformed.
Expression data for genes represented on both platforms
were mean centered across the experiments. Based on a
linear regression model comparing the two data sets an R
2
value was calculated.
Availability and requirements
CYPedia: />Authors' contributions
JE analyzed the microarray data, and designed and built
the 'CYPedia' database. VS and AO helped building the
web interface. JFG was/is involved in updating the data-
base. NJP performed the co-expression analysis. DWR and
JE conceived of the project. DWR directed the study and
helped with interpretation of data. JE and DWR wrote the
manuscript. All authors read and approved the final man-
uscript.
Additional material
Additional File 1
Locus and probe set information for P450s. Given are the Affymetrix
AtH1 microarray probe sets used for cytochromes P450 and the name and
AGI loci recognized by these probe sets. In addition, the number of exper-
iments in the respective data sets with detectable expression (more than
twofold difference from the control) is given, as well as the fraction of sam-
ples with detectable expression. In the organ data sets control is defined for
each probe set as the average signal intensity on arrays were this probe set
was called 'absent' by the Affymetrix software. In the stress and hormone
data sets control is defined as the signal intensities of untreated control
samples. In the mutant data set control is defined as the signal intensities
in the corresponding wild type samples.
Click here for file
[ />2229-8-47-S1.xls]
Additional File 2
Stress responsive expression of P450s. Microarray expression data were
retrieved from the 'Genevestigator' database and processed as described in
Methods. Only genes that are up-regulated (>twofold) in more than 30%
of at least one treatment group as indicated on top were selected. Back-
ground corrected expression intensities were compared to untreated control
experiments and log
2
-ratios were used for hierarchical cluster analysis
with complete linkage. The resulting heatmap is color coded as indicated
in the overview image in Sheet 1 (overview). Details on the individual
samples can be found in Sheet2 (details) of this spreadsheet.
Click here for file
[ />2229-8-47-S2.xls]
Additional File 3
Pathway predictions based on co-expression analysis of P450s with
known functions. Top scoring co-expressed pathways for P450s with
characterized biochemical functions.
Click here for file
[ />2229-8-47-S3.pdf]
Additional File 4
Co-expression analysis using CYP73A5 encoding cinnamate 4-hydrox-
ylase as bait. Data from published Affymetrix microarrays (representing
a) 167 organ and tissue samples and b) 243 stress related treatments)
were retrieved from the Genevestigator database [10]. Background correc-
tion and ratio log2-ratio generation was performed as describe in Meth-
ods. The expression vectors of CYP73A5 were compared to those of 4,119
genes annotated in diverse databases to be involved in any metabolic path-
way using the 'ExpresionAngler' algorith [9]. Expression profiles of co-
expressed genes with a correlation coefficient of more than 0.5 are shown
as a heatmap. Groups of samples are indicated on top of the heatmap.
Mean centred signal intensity ratios are colour coded as indicated on the
bottom of each heatmap. Genes encoding enzymes of the phenylpropanoid
and shikimate pathways are highlighted in red and green, respectively.
Sheet 1 shows overview image, detailed information on the co-expressed
genes and samples can be found in sheets 2 (organs) and 3 (stress) of this
file.
Click here for file
[ />2229-8-47-S4.xls]
BMC Plant Biology 2008, 8:47 />Page 17 of 19
(page number not for citation purposes)
Acknowledgements
This work was supported by an International Reintegration Grant of the
European Union to JE (MIRG-CT-2006-036537). VS and AO are grateful for
support of BayerCropScience and VS to the support of Agence Nationale
de la Recherche Technique for a CIFRE funding. JFG was funded by the
Human Frontier Programme RGP0065/2005-C. We would like to thank
François Bernier for critically reading the manuscript, as well as Franck
Pinot and Hubert Schaller for numerous helpful discussions.
References
1. Nelson D: Plant cytochrome P450s from moss to poplar. Phy-
tochem Rev 2006, 5:193-204.
2. Schuler M, Duan H, Bilgin M, Ali S: Arabidopsis cytochrome
P450s through the looking glass: a window on plant biochem-
istry. Phytochem Rev 2006, 5:205-237.
3. Werck-Reichhart D: Cytochromes P450. The Arabidopsis book
2002 [ />ment&issn=1543-8120&volume=2&issue=1&page=1]. Rockville MD,
American Society of Plant Biologists, Rockville, MD
4. Schuler MA, Werck-Reichhart D: Functional genomics of P450s.
Annu Rev Plant Biol 2003, 54:629-667.
5. Nelson DR, Schuler MA, Paquette SM, Werck-Reichhart D, Bak S:
Comparative genomics of rice and Arabidopsis. Analysis of
727 cytochrome P450 genes and pseudogenes from a mono-
cot and a dicot. Plant Physiol 2004, 135:756-772.
6. Aoki K, Ogata Y, Shibata D: Approaches for extracting practical
information from gene co-expression networks in plant biol-
ogy. Plant Cell Physiol 2007, 48:381-390.
7. Barrett T, Troup DB, Wilhite SE, Ledoux P, Rudnev D, Evangelista C,
Kim IF, Soboleva A, Tomashevsky M, Edgar R: NCBI GEO: mining
tens of millions of expression profiles database and tools
update. Nucleic Acids Res 2007, 35:D760-D765.
8. Parkinson H, Kapushesky M, Shojatalab M, Abeygunawardena N,
Coulson R, Farne A, Holloway E, Kolesnykov N, Lilja P, Lukk M, Mani
R, Rayner T, Sharma A, William E, Sarkans U, Brazma A: ArrayEx-
press a public database of microarray experiments and
gene expression profiles. Nucleic Acids Res 2007, 35:D747-D750.
9. Toufighi K, Brady SM, Austin R, Ly E, Provart NJ: The Botany Array
Resource: e-northerns, expression angling, and promoter
analyses. Plant J 2005, 43:153-163.
10. Zimmermann P, Hirsch-Hoffmann M, Hennig L, Gruissem W: GEN-
EVESTIGATOR. Arabidopsis microarray database and anal-
ysis toolbox. Plant Physiol 2004, 136:2621-2632.
11. Paquette SM, Bak S, Feyereisen R: Intron-exon organization and
phylogeny in a large superfamily, the paralogous cyto-
chrome P450 genes of Arabidopsis thaliana. DNA Cell Biol 2000,
19:307-317.
12. Katagiri F: A global view of defense gene expression regula-
tion a highly interconnected signaling network. Curr Opin
Plant Biol 2004, 7:506-511.
13. Tao Y, Xie Z, Chen W, Glazebrook J, Chang HS, Han B, Zhu T, Zou
G, Katagiri F: Quantitative nature of Arabidopsis responses
during compatible and incompatible interactions with the
bacterial pathogen Pseudomonas syringae. Plant Cell
2003,
15:317-330.
14. Schuhegger R, Nafisi M, Mansourova M, Petersen BL, Olsen CE, Sva-
tos A, Halkier BA, Glawischnig E: CYP71B15 (PAD3) catalyzes
the final step in camalexin biosynthesis. Plant Physiol 2006,
141:1248-1254.
15. Zhou N, Tootle TL, Glazebrook J: Arabidopsis PAD3, a gene
required for camalexin biosynthesis, encodes a putative
cytochrome P450 monooxygenase. Plant Cell 1999,
11:2419-2428.
16. Nafisi M, Goregaoker S, Botanga CJ, Glawischnig E, Olsen CE, Halkier
BA, Glazebrook J: Arabidopsis cytochrome P450 monooxyge-
nase 71A13 catalyzes the conversion of indole-3-acetaldox-
ime in camalexin synthesis. Plant Cell 2007, 19:2039-2052.
17. Godiard L, Sauviac L, Dalbin N, Liaubet L, Callard D, Czernic P, Marco
Y: CYP76C2, an Arabidopsis thaliana cytochrome P450 gene
expressed during hypersensitive and developmental cell
death. FEBS Lett 1998, 438:245-249.
18. Morikawa T, Mizutani M, Aoki N, Watanabe B, Saga H, Saito S,
Oikawa A, Suzuki H, Sakurai N, Shibata D, Wadano A, Sakata K, Ohta
D: Cytochrome P450 CYP710A encodes the sterol C-22
desaturase in Arabidopsis and tomato. Plant Cell 2006,
18:1008-1022.
19. Chehab EW, Perea JV, Gopalan B, Theg S, Dehesh K: Oxylipin path-
way in Rice and Arabidopsis. J Integr Plant Biol 2007, 49:43-51.
20. Duan H, Schuler MA: Differential expression and evolution of
the Arabidopsis CYP86A subfamily. Plant Physiol 2005,
137:1067-1081.
Additional File 5
Co-expression analysis using CYP98A8 as bait. Data from published
Affymetrix microarrays representing 167 organ and tissue samples were
retrieved from the 'Genevestigator' database [10]. Background correction
and ratio log
2
-ratio generation was performed as describe in Methods. The
expression vector of CYP98A8 was compared to those of 4,119 genes
annotated in diverse databases to be involved in any metabolic pathway
using the 'ExpresionAngler' algorithm [9]. Expression profiles of co-
expressed genes with a correlation coefficient of more than 0.6 are shown
as a heatmap table. Brief descriptions of the experiments and the experi-
ment identifier from the 'Genevestigator' database are indicated on top of
the heatmap. Mean-centred signal intensity ratios are colour coded as
indicated to the right.
Click here for file
[ />2229-8-47-S5.xls]
Additional File 6
Co-expression analysis using CYP98A8 as bait. Data from published
Affymetrix microarrays representing 167 organ and tissue samples were
retrieved from the Genevestigator database [10]. Background correction
and ratio log2-ratio generation was performed as describe in Methods. The
expression vector of CYP97A3 was compared to those of 4,119 genes
annotated in diverse databases to be involved in any metabolic pathway
using the 'ExpresionAngler' algorithm [9]. Expression profiles of co-
expressed genes with a correlation coefficient of more than 0.84 are shown
as a heatmap table. Brief descriptions of the experiments and the experi-
ment identifier from the Genevestigator database are indicated on top of
the heatmap. Mean-centered signal intensity ratios are color coded as
indicated to the right. This table corresponds to Figure 6.
Click here for file
[ />2229-8-47-S6.xls]
Additional File 7
Cluster analysis of triterpene synthases (TTPS) and P450s. Microarray
expression data were retrieved from the 'Genevestigator' database and
processed as described in Methods. Expression vectors from the four data
sets of all twelve TTPS genes from A. thaliana were used as bait for co-
expression analysis comparing its expression with that of all P450 genes.
We retained seven TTPS genes, which were co-expressed (r > 0.75) with
at least one P450 in at least one of the four expression data sets and the
corresponding P450s (Table 2). This set of genes was used for hierarchical
clustering with complete linkage in a) the organ expression data set and
b) the mutant data set as shown in the overview image in Sheet 1. TTPS
and clusters with P450 genes with high correlation coefficients are colour
coded. Detailed information on the co-expressed genes and samples can be
found in sheets 2 (organs), 3 (stress), 4 (hormones), and 5 (mutants) of
this file. The numbers in brackets refer to the experiment ID from the Gen-
evestigator database.
Click here for file
[ />2229-8-47-S7.xls]
BMC Plant Biology 2008, 8:47 />Page 18 of 19
(page number not for citation purposes)
21. Xiao F, Goodwin SM, Xiao Y, Sun Z, Baker D, Tang X, Jenks MA,
Zhou JM: Arabidopsis CYP86A2 represses Pseudomonas
syringae type III genes and is required for cuticle develop-
ment. EMBO J 2004, 23:2903-2913.
22. Glawischnig E: The role of cytochrome P450 enzymes in the
biosynthesis of camalexin. Biochem Soc Trans 2006,
34:1206-1208.
23. Mikkelsen MD, Petersen BL, Glawischnig E, Jensen AB, Andreasson E,
Halkier BA: Modulation of CYP79 genes and glucosinolate
profiles in Arabidopsis by defense signaling pathways. Plant
Physiol 2003, 131:298-308.
24. Zhao Y, Hull AK, Gupta NR, Goss KA, Alonso J, Ecker JR, Normanly
J, Chory J, Celenza JL: Trp-dependent auxin biosynthesis in Ara-
bidopsis: involvement of cytochrome P450s CYP79B2 and
CYP79B3. Genes Dev 2002, 16:3100-3112.
25. Turk EM, Fujioka S, Seto H, Shimada Y, Takatsuto S, Yoshida S, Denzel
MA, Torres QI, Neff MM: CYP72B1 inactivates brassinosteroid
hormones: an intersection between photomorphogenesis
and plant steroid signal transduction. Plant Physiol 2003,
133:1643-1653.
26. Turk EM, Fujioka S, Seto H, Shimada Y, Takatsuto S, Yoshida S, Wang
H, Torres QI, Ward JM, Murthy G, Zhang J, Walker JC, Neff MM:
BAS1 and SOB7 act redundantly to modulate Arabidopsis
photomorphogenesis via unique brassinosteroid inactivation
mechanisms. Plant J 2005, 42:23-34.
27. Takei K, Yamaya T, Sakakibara H: Arabidopsis CYP735A1 and
CYP735A2 encode cytokinin hydroxylases that catalyze the
biosynthesis of trans-zeatin. J Biol Chem 2004, 279:41866-41872.
28. Mikkelsen MD, Hansen CH, Wittstock U, Halkier BA: Cytochrome
P450 CYP79B2 from Arabidopsis catalyzes the conversion of
tryptophan to indole-3-acetaldoxime, a precursor of indole
glucosinolates and indole-3-acetic acid. J Biol Chem 2000,
275:33712-33717.
29. William DA, Su Y, Smith MR, Lu M, Baldwin DA, Wagner D:
Genomic identification of direct target genes of LEAFY. Proc
Natl Acad Sci U S A 2004, 101:1775-1780.
30. Ehlting J, Mattheus N, Aeschliman DS, Li E, Hamberger B, Cullis IF,
Zhuang J, Kaneda M, Mansfield SD, Samuels L, Ritland K, Ellis BE, Bohl-
mann J, Douglas CJ: Global transcript profiling of primary
stems from Arabidopsis thaliana identifies candidate genes
for missing links in lignin biosynthesis and transcriptional
regulators of fiber differentiation. Plant J 2005, 42:618-640.
31. Aubourg S, Lecharny A, Bohlmann J: Genomic analysis of the ter-
penoid synthase ( AtTPS) gene family of Arabidopsis thal-
iana. Mol Genet Genomics 2002, 267:730-745.
32. Costa MA, Collins RE, Anterola AM, Cochrane FC, Davin LB, Lewis
NG: An in silico assessment of gene function and organiza-
tion of the phenylpropanoid pathway metabolic networks in
Arabidopsis thaliana and limitations thereof. Phytochemistry
2003, 64:1097-1112.
33. Kliebenstein DJ, Kroymann J, Mitchell-Olds T: The glucosinolate-
myrosinase system in an ecological and evolutionary con-
text. Curr Opin Plant Biol 2005, 8:264-271.
34. Lange BM, Ghassemian M: Comprehensive post-genomic data
analysis approaches integrating biochemical pathway maps.
Phytochemistry 2005, 66:413-451 [ />ence?_ob=ArticleURL&_udi=B6TH7-4FC8V01-
2&_user=113008&_coverDate=02%2F01%2F2005&_rdoc=3&_fmt=s
ummary&_orig=browse&_srch=doc-
info(%23toc%235275%232005%23999339995%23565818%23FLA%2
3display%23Volume)&_cdi=5275&_sort=d&_docanchor=&view=c&_
ct=11&_acct=C000008898&_version=1&_urlVersion=0&_userid=11
3008&md5=0575077fc8e852b4d3210b60d0aadf9b].
35. Raes J, Rohde A, Christensen JH, Van de PY, Boerjan W: Genome-
wide characterization of the lignification toolbox in Arabi-
dopsis. Plant Physiol 2003, 133:1051-1071.
36. Ruepp A, Zollner A, Maier D, Albermann K, Hani J, Mokrejs M, Tetko
I, Guldener U, Mannhaupt G, Munsterkotter M, Mewes HW: The
FunCat, a functional annotation scheme for systematic clas-
sification of proteins from whole genomes. Nucleic Acids Res
2004, 32:5539-5545.
37. Berardini TZ, Mundodi S, Reiser L, Huala E, Garcia-Hernandez M,
Zhang P, Mueller LA, Yoon J, Doyle A, Lander G, Moseyko N, Yoo D,
Xu I, Zoeckler B, Montoya M, Miller N, Weems D, Rhee SY: Func-
tional annotation of the Arabidopsis genome using control-
led vocabularies. Plant Physiol 2004, 135:745-755.
38. Ehlting J, Hamberger B, Million-Rousseau R, Werck-Reichhart D:
Cytochrome P450 in phenolic metabolism. Phytochem Rev
2006, 5:239-270.
39. Urban P, Mignotte C, Kazmaier M, Delorme F, Pompon D: Cloning,
yeast expression, and characterization of the coupling of two
distantly related Arabidopsis thaliana NADPH-cytochrome
P450 reductases with P450 CYP73A5. J Biol Chem 1997,
272:19176-19186.
40. Franke R, Humphreys JM, Hemm MR, Denault JW, Ruegger MO,
Cusumano JC, Chapple C: The Arabidopsis REF8 gene encodes
the 3-hydroxylase of phenylpropanoid metabolism. Plant J
2002, 30:33-45.
41. Schoch G, Goepfert S, Morant M, Hehn A, Meyer D, Ullmann P,
Werck-Reichhart D: CYP98A3 from Arabidopsis thaliana is a
3'-hydroxylase of phenolic esters, a missing link in the phe-
nylpropanoid pathway. J Biol Chem 2001, 276:36566-36574.
42. Kim J, DellaPenna D: Defining the primary route for lutein syn-
thesis in plants: The role of Arabidopsis carotenoid b-ring
hydroxylase CYP97A3. Proc Natl Acad Sci USA 2006,
103:3474-3479.
43. Tian L, Musetti V, Kim J, Magallanes-Lundback M, DellaPenna D: The
Arabidopsis LUT1 locus encodes a member of the cyto-
chrome P450 family that is required for carotenoid e-ring
hydroxylation activity. Proc Natl Acad Sci USA 2004, 101:402-407.
44. Szekeres M, Nemeth K, Koncz-Kalman Z, Mathur J, Kauschmann A,
Altmann T, Redei GP, Nagy F, Schell J, Koncz C: Brassinosteroids
rescue the deficiency of CYP90, a cytochrome P450, control-
ling cell elongation and de-etiolation in Arabidopsis. Cell
1996, 85:171-182.
45. Bancos S, Szatmari AM, Castle J, Kozma-Bognar L, Shibata K, Yokota
T, Bishop GJ, Nagy F, Szekeres M: Diurnal regulation of the
brassinosteroid-biosynthetic CPD gene in Arabidopsis. Plant
Physiol 2006, 141:299-309.
46. Gershenzon J, Dudareva N: The function of terpene natural
products in the natural world. Nat Chem Biol 2007, 3:408-414.
47. Lodeiro S, Xiong Q, Wilson WK, Kolesnikova MD, Onak CS, Matsuda
SPT: An oxidosqualene cyclase makes numerous products by
diverse mechanisms: A challenge to prevailing concepts of
triterpene biosynthesis. J Am Chem Soc 2007, 129:11213-11222.
48. Shibuya M, Hoshino M, Katsube Y, Hayashi H, Kushiro T, Ebizuka Y:
Identification of beta-amyrin and sophoradiol 24-hydroxy-
lase by expressed sequence tag mining and functional
expression assay. FEBS J 2006, 273:948-959.
49. Fazio GC, Xu R, Matsuda SP: Genome mining to identify new
plant triterpenoids. J Am Chem Soc 2004, 126:5678-5679.
50. Xiong Q, Wilson WK, Matsuda SP: An Arabidopsis oxidos-
qualene cyclase catalyzes iridal skeleton formation by Grob
fragmentation. Angew Chem Int Ed Engl 2006, 45:1285-1288.
51. Fujioka S, Li J, Choi YH, Seto H, Takatsuto S, Noguchi T, Watanabe
T, Kuriyama H, Yokota T, Chory J, Sakurai A: The Arabidopsis
deetiolated2 mutant is blocked early in brassinosteroid bio-
synthesis. Plant Cell 1997, 9:1951-1962.
52. Sun TP, Kamiya Y: The Arabidopsis GA1 locus encodes the
cyclase ent-kaurene synthetase A of gibberellin biosynthesis.
Plant Cell 1994, 6:1509-1518.
53. Field B, Osbourn AE: Metabolic diversification - Independent
assembly of operon-like gene clusters in plants. Science 2008,
320:543-7.
54. Fang R, Houghton PJ, Luo C, Hylands PJ: Isolation and structure
determination of triterpenes from Iris tectorum. Phytochemis-
try 2007, 68:
1242-1247.
55. Wasternack C: Jasmonates: An Update on Biosynthesis, Signal
Transduction and Action in Plant Stress Response, Growth
and Development. Ann Bot (Lond) 2007.
56. Benveniste I, Saito T, Wang Y, Kandel S, Huang HW, Pinot F, Kahn
RA, Salaun JP, Shimoji M: Evolutionary relationship and sub-
strate specificity of Arabidopsis thaliana fatty acid omega-
hydroxylase. Plant Sci 2006, 170:326-338.
57. Naur P, Petersen BL, Mikkelsen MD, Bak S, Rasmussen H, Olsen CE,
Halkier BA: CYP83A1 and CYP83B1, two nonredundant cyto-
chrome P450 enzymes metabolizing oximes in the biosyn-
thesis of glucosinolates in Arabidopsis. Plant Physiol 2003,
133:63-72.
58. Olry A, Schneider-Belhaddad F, Heintz D, Werck-Reichhart D: A
medium-throughput screening assay to determine catalytic
activities of oxygen-consuming enzymes: a new tool for func-
Publish with BioMed Central and every
scientist can read your work free of charge
"BioMed Central will be the most significant development for
disseminating the results of biomedical research in our lifetime."
Sir Paul Nurse, Cancer Research UK
Your research papers will be:
available free of charge to the entire biomedical community
peer reviewed and published immediately upon acceptance
cited in PubMed and archived on PubMed Central
yours — you keep the copyright
Submit your manuscript here:
/>BioMedcentral
BMC Plant Biology 2008, 8:47 />Page 19 of 19
(page number not for citation purposes)
tional characterization of cytochrome P450 and other oxy-
genases. Plant J 2007, 51:331-340.
59. Mao X, Cai T, Olyarchuk JG, Wei L: Automated genome annota-
tion and pathway identification using the KEGG Orthology
(KO) as a controlled vocabulary. Bioinformatics 2005,
21:3787-3793.
60. Zhang P, Foerster H, Tissier CP, Mueller L, Paley S, Karp PD, Rhee
SY: MetaCyc and AraCyc. Metabolic pathway databases for
plant research. Plant Physiol 2005, 138:27-37.
61. Beisson F, Koo AJ, Ruuska S, Schwender J, Pollard M, Thelen JJ, Pad-
dock T, Salas JJ, Savage L, Milcamps A, Mhaske VB, Cho Y, Ohlrogge
JB: Arabidopsis genes involved in acyl lipid metabolism. A
2003 census of the candidates, a study of the distribution of
expressed sequence tags in organs, and a web-based data-
base. Plant Physiol 2003, 132:681-697.
62. Lange BM, Ghassemian M: Genome organization in Arabidopsis
thaliana: a survey for genes involved in isoprenoid and chlo-
rophyll metabolism. Plant Mol Biol 2003, 51:925-948.
63. Rhee SY, Beavis W, Berardini TZ, Chen G, Dixon D, Doyle A, Garcia-
Hernandez M, Huala E, Lander G, Montoya M, Miller N, Mueller LA,
Mundodi S, Reiser L, Tacklind J, Weems DC, Wu Y, Xu I, Yoo D,
Yoon J, Zhang P: The Arabidopsis Information Resource
(TAIR): a model organism database providing a centralized,
curated gateway to Arabidopsis biology, research materials
and community. Nucl Acids Res 2003, 31:224-228.
64. Team RDC: R: A language and environment for statistical computing 2006
[
]. Vienna, Austria, R Foundation for Statis-
tical Computing