GIS for Environmental Decision Making - Chapter 11 pptx
Bạn đang xem bản rút gọn của tài liệu. Xem và tải ngay bản đầy đủ của tài liệu tại đây (1.58 MB, 12 trang )
Part III
___________________________________________________________________
Participation in Decision-
Making
© 2008 by Taylor & Francis Group, LLC
181
CHAPTER 11
Developments in Public Participation and Collaborative
Environmental Decision-Making
I. Bishop
11.1 INTRODUCTION
Human actions have consequences. In happy circumstances everyone benefits
from the actions; the win-win cliché. This is, however, seldom the case; usually
there are winners and losers. The classical basis of decision-making, cost-benefit
analysis, suggests that provided the benefits outweigh the costs by a reasonable
margin (to account for error and uncertainty) the action should proceed.
Nevertheless, this apparently sensible approach is constantly running into protests
from those who bear the costs, those who rate the costs higher than the analysts, or
politicians and others who appoint themselves as guardians of people or
environments that will bear the cost in the future.
The cost-benefit paradigm as traditionally applied does pay some heed to the
future; however the typical discount rates used (e.g., 3% or 6%) mean that any
consequences beyond about a decade have little influence on the analysis. On the
other hand, a key aspect of the analysis which is often wholly ignored, by the
analysts if not the public, is the spatial distribution of costs and benefits.
Frequently costs are quite local – e.g., under the flight path, affected by
pollutants or in the viewshed – whereas the benefits are regional or national. This
has given rise to the NIMBY syndrome in which people recognize the national
benefit but ask why they should carry the cost. This is a perfectly reasonable
question. Sometimes governments or corporations will seek to nullify the
perceived cost by offering some form of compensation – a new community
swimming pool, jobs or even direct payments.
While there will always be some who perceive disadvantage and will fight for
their rights, a substantial part of the contention can be eliminated by more explicit
upfront analysis and communication of spatial and temporal aspects of the
consequences of actions and, in particular, cost and benefit estimation
1
. In order
for people to accept a decision, there appear to be certain specific aspects of the
process or the outcome which must be partly or wholly satisfied. For example,
from an individual perspective the criteria might be:
• My views have been recognized and taken into account
• The decision leaves me minimally worse off
© 2008 by Taylor & Francis Group, LLC
182 GIS for environmental decision-making
• The costs and benefits are transparent
• Anyone who benefits more than me should be deserving (i.e., not already
better off than me)
• The outcome is valid into the future (sustainable).
Although NIMBYism is a recent phrase, the phenomenon of local project
opposition has been around for many years and spatial scientists have been arguing
that there are better ways of making decisions which will be more transparent and
hopefully fairer and more sustainable. As spatial scientists we have argued that
good decision-making demands good information. This argument has not changed
but now it is increasingly recognized that in addition: decision-making must carry
those affected along with it. Consequently, process is as important as information.
There are two aspects to achieving this improved condition: (a) analysis (i.e.,
the base knowledge of where/when costs or benefits will accrue) and (b)
communication (i.e., allowing the people affected – on both sides – to understand
these distributions). The question for spatial analysts was (and remains): how can
we put our tools and skills to work to improve decision-making and public
confidence in decisions?
For many people the answer has been to try to improve the models: the
technical process of distributing costs and benefits. Other researchers have focused
on public engagement, tools for the presentation of information, the design of
stakeholder processes etc. This chapter concentrates on this second aspect and
reflects a personal perspective on where we have been, where we are now and
where we might be going in the specific context of changes in the landscape.
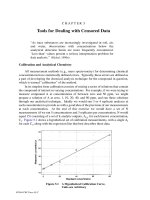
First, however, we need some sort of framework for public participation. One
attempt at classifying the extent of public involvement comes from Arnstein
2
.
Figure 11.1 shows Arnstein’s ladder of citizen participation. The terminology is
somewhat judgmental but it provides a starting point for further analysis.
Figure 11.1 The ladder of citizen engagement (after Arnstein
2
).
© 2008 by Taylor & Francis Group, LLC
Tools for collaborative decision-making 183
11.2 SEPARATE DEVELOPMENT: GIS AND VISUALIZATION
In the 1970s several groups began working with GIS-like programs with a view
to generating frameworks for more rational land use planning. Prominent among
these were the group under Carl Steinitz at the Harvard Graduate School of Design,
assisted by software from the Harvard Computer Graphics Lab from which sprang
many of the leaders of early, and contemporary, GIS development (e.g., Jack
Dangermond and Dana Tomlin). Near neighbors, and to some degree competitors,
was a group under Julius Fabos at the University of Massachusetts in Amherst.
Their system was called METLAND
3
. Both Steinitz and Fabos are landscape
architects and their software tools were essentially raster based in their analysis and
mapping. In Canberra, Australia, Doug Cocks and his team had similar objectives
with their SIRO-PLAN method, but took a rather different parcel based approach
4
.
In all three cases scope for public involvement was an element of the procedural
design. However, the procedures used and the computer power available did not
really permit these groups to think in terms of interactive mapping or visualization
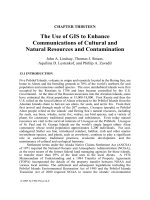
systems. Public involvement was orientated more towards the gathering of views
in the form of weightings for aspects of the landscape or for ‘policies’ relating to
land use locations (Figure 11.2). Generally the 'public' were experts, interest
groups or the planners themselves rather than the broader community. In addition,
participants often had to decide for themselves if they would be affected by
particular changes in land use. There was not a lot by way of spatial models to
predict the outcomes of particular actions and, especially, the populations who
might be impacted.
Figure 11.2 Alternative land-use plans based on different factor weightings (from McDonald and
Brown
5
). Copyright Elsevier 1984 (with permission).
© 2008 by Taylor & Francis Group, LLC
184 GIS for environmental decision-making
Among the early software products designed to determine consequences
algorithmically were programs which estimated who would see or be otherwise
affected by the land use changes. Landmark computer programs including
VIEWIT
6
and MAP (Map Analysis Package)
7
led the way in provision of tools for
landscape analysis and visual modelling. Indeed, some of their features, such as
visual magnitude estimation and partial screening, are seldom found in
contemporary software. These products recognized the potential of the computer to
answer questions about the visual relationship between different parts of the
landscape, as well as the effect of surface features on these relationships. VIEWIT
was developed primarily for use in a forest management context while MAP
combined the facilities of VIEWIT with a wider range of map algebra functions
making it a prototypical geographic information system (GIS).
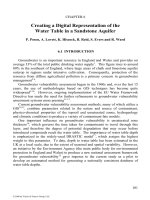
At the same time, the first examples of computer based landscape simulation
were appearing. For forestry applications, wholly computer drawn images with
arrows for trees were setting the standard (Figure 11.3a)
8
. In other contexts, simple
perspective drawings of power stations or other industrial facilities were being
superimposed onto photographs in what was then regarded as a photomosaic (e.g.,
Bureau of Land Management
9
) and might now be called a low-level form of
augmented reality (Figure 11.3b). The purpose of these simulations was to
communicate specific proposals. In certain cases alternatives were explored, but
the general trend was for environmental analysis to come well after the design
process was completed on functional grounds.
(a) (b)
Figure 11.3 Approaches to 3D visualization for public presentation: (a) early example of forest
simulation (from Myklestad and Wagar
8
), (b) modern photomontage (from Benson
10
). Copyright (a)
Elsevier 1977 and (b) Taylor & Francis 2005 (with permission).
11.3 CONVERGING TECHNOLOGIES: GIS-DRIVEN VISUALIZATION
Communities are increasingly seeking opportunities to actively and deliberately
manage their futures. Software products such as What if?
11
and CommunityViz
12
assist communities in exploring and envisioning possible future conditions and in
© 2008 by Taylor & Francis Group, LLC
Tools for collaborative decision-making 185
assessing the consequences of planning decisions. What if? is a very clear and
direct descendent of the METLAND and SIRO-PLAN systems of 20 years earlier.
It is map based and relies on definition of homogenous parcels exactly as SIRO-
PLAN did. The intention is to incorporate the preferences and assumptions of the
user and then create a plan which is supposedly the best (or close to best) way of
meeting those aspirations. This qualifies What if? as a Decision Support System
(DSS) in conventional terms.
Some recent papers
13
have adopted the language of Tufte
14
and begun to use the
term ‘envisioning system’ (EvS). An EvS differs from a DSS following the
reasoning of Brail and Klosterman
15
. The goals of EvS are longer range than
typical for DSS and less analytical. EvS is less directed towards identifying best
solutions and more directed towards identifying achievable directions. EvS
attempts to facilitate collaboration rather than enable executive decisions. This is
very similar to what Michael Kwartler calls ‘visioning’. In his terms: ‘The quality
of place, the combination of its experiential and functional attributes and group
values and identity, is fundamental to visioning’
16, p 252
. He goes on to discuss the
importance of a visual representation of outcomes and the way in which this can
provoke a ‘…that’s not what I meant at all’ reaction to outputs of DSS.
Bishop et al.
13
describe an EvS designed to help rural communities contemplate
landscape scale changes. Simulations and models project current conditions into
the future according to the constraints of scenario-based planning and available
land use choices. Possible future conditions are represented visually through maps,
simulations and indicator icons. The goal of an EvS is to help community members
negotiate desired future conditions and implement policies which shape land use
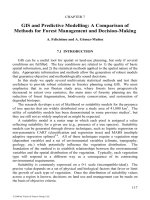
changes to produce these outcomes. Figure 11.4 shows an example of an EvS setup
with back-projected screen displays and participants equipped with Personal Digital
Assistants (PDAs) for input, query and response recording purposes
17
.
Figure 11.4 Example of a hardware setup for an envisioning system (after Stock and Bishop
17
).
© 2008 by Taylor & Francis Group, LLC
186 GIS for environmental decision-making
Another approach to stakeholder participation is taken by Paez et al.
1
. Using a
system dubbed DISCUSS they show how the spatially aggregated output of
traditional cost-benefit analysis can be disaggregated using a combination of
technical (process model based) and perceptual (fuzzy stakeholder input) mapping.
DISCUSS works with a single user at a time who, with the aid of a trained operator,
can input their perception of the distribution of costs and benefits by either:
• Agreeing with the outputs of a technical analysis
• Allocating costs and benefits to existing land parcels, or
• Drawing their own free-form polygons representing areas with different
levels of impact.
In this last case the system will interpolate the mapping, using one of three
different interpolation procedures, to give full spatial coverage of costs and
benefits. Any output which does not fit the stakeholder perception can be adjusted
iteratively. Thus, there should be no cases of ‘…that’s not what I meant at all’.
Once all the stakeholders have made their inputs, DISCUSS will map areas of
consensus or dispute based on a selection of agreement metrics.
The trend towards recognition of individual preferences and behaviours is also
manifest in the adoption of agent-based modelling
18
in decision-making contexts.
Agent modelling is not itself a form of public participation, but the process of
calibrating agent models requires close study of individuals through surveys,
behavior monitoring or, eventually, observation in controlled virtual world
conditions
19
. As this technology develops it provides another medium for public
involvement. However the possibility exists that it could be used at either end of
the Arnstein ladder – for manipulation or empowerment.
11.4 INTEGRATED TECHNOLOGIES: COLLABORATIVE WORLDS
Key factors determining the current range of possible approaches to public
participation are: data availability, spatial modelling, presentation, networking and
communications. Rapid changes are occurring in all these areas. Some which
demand particular attention are:
Desktop graphics. Development happens fast in computer hardware – the
famous Moore's law suggests a doubling of capability every 18 months. Even three
years ago few people bought computers with specialized graphics cards; today they
are virtually standard equipment. This means that complex 3D models can be
explored interactively by most users – as they already do in computer games.
Spatial Data Infrastructures (SDI). While data has been collected digitally for
sometime, and while this has increasingly been coordinated and made accessible
on-line, the talk now is about adding a layer of widely accessible generic tools
© 2008 by Taylor & Francis Group, LLC
Tools for collaborative decision-making 187
between the data and the user in order to allow individual value-adding to
transparently available data
20
. Transparency is also aided by the development of
spatial and domain specific ontologies.
Interactive linkages. Systems integration, especially using existing software
packages and widely recognized standards and protocols (such as those being
developed by the Open Geospatial Consortium
21
), is another trend that seems likely
to accelerate in association with SDI.
Internet bandwidth. Enhanced connectivity will allow people to download
complex 3D models in a reasonable time. Their graphics cards will give them the
ability to move around these models in real-time. Another step forward is the
process already prevalent in the world of computer gaming in which people can
fight, or better collaborate, with each other through the web.
Having moved from expert-based citizen involvement in decision-making
towards a more inclusive model supporting public forums and workshops, these
developments will support the emergence of on-line collaborative visualization
based on SDI. MacEachren and Brewer
22
and MacEachren
23
have explored this
potential and developed an extensive conceptual framework for system
development.
A sub-class of collaborative systems involves the use of virtual environments in
which people appear as avatars and have an ability to observe and manipulate the
environment in order to explore the decision space associated with a particular
issue at a particular location. This scenario has a lot in common with computer
games and so it is not surprising that commercial game engines are being used as
development platforms for visualization
24
and also for collaborative virtual
worlds
25-27
. Figure 11.5 shows example views of the system (SIEVE) which we are
developing in the context of rural planning and salinity issues
26
. The initial
challenges were:
• Automatic generation of virtual worlds from terrain, vegetation and built
element data from the SDI
• Integration of above and below ground aspects of the salinity issue by
joining hydrological modelling outcomes to realistic visualization of
environmental consequences
• Development of collaborative meeting protocols and support systems
© 2008 by Taylor & Francis Group, LLC
188 GIS for environmental decision-making
(a) Automatically generated virtual world. (b) Linkage of procedural flood model to tree
health.
Figure 11.5 Screen shots from the collaborative virtual environment system (SIEVE).
Figure 11.6 is a schematic view of our current developments and future plans
which are described more fully in Bishop et al.
28
For example, the idea of
providing visual representation of data to someone working in the field includes an
augmented reality approach to presentation. A farmer can see a soils map draped
over her paddock, can interactively plant new virtual trees into the landscape and,
by sending these back through the network for server-side model processing,
observe the effect of these on the water table beneath her own and surrounding
properties.
Figure 11.6 Schematic design of existing and future work towards a collaborative virtual environment.
© 2008 by Taylor & Francis Group, LLC
Tools for collaborative decision-making 189
The work to date is based on linkage of particular products: a geographic
information system (ArcGIS
®29
) and a games engine (Torque
30
), but will eventually
become more generic. We have developed procedures for passing data between
these systems both as exported files and through a live link. These provide
enormous developmental and operational flexibility.
Another key objective of our development is to support both expert users and
the broader public in terms of their needs for information. The expert is typically
willing to work with more abstract representations, seeks more interactivity and
often works alone or with a small team. The public may be best supported by more
realistic, natural modes of representation, may be content with less output or query
options, but may be part of a larger group accessing the information through a
planning workshop (same place) or on-line forum (different place). In addition,
there are those, like our farmer above, for who the information is integral to their
livelihood.
11.5 CONCLUSIONS
Technology, starting with GIS and moving into virtual worlds, has provided,
and continues to provide, new opportunities for involving people in spatial
decision-making. This rapid evolution has to some degree outstripped our
knowledge of how the technologies may be most efficiently or appropriately
applied. We also need further studies into the theory and application of
technologies such as the collaborative virtual world proposed here. Do we seek to
mimic face to face meeting or do we need other protocols? How does an on-line
facilitator get the measure of his/her audience? These and related issues will be
central to on-going research and development. As always, however, the success of
systems for public involvement will depend upon freely available information and
political will. Then there is a chance for win-win outcomes.
11.6 ACKNOWLEDGMENTS
Contributors to the recent work described here include Daniel Paez (DISCUSS);
Christian Stock, Alice O’Connor and Alex Tao Chen (SIEVE); and Lucy
Spottiswood (agent modelling). The work with SIEVE was funded by the CRC for
Spatial Information. The agent modelling development is funded by the Melbourne
University Research Grant Scheme (MRGS).
11.7 REFERENCES
1.
Paez, D., Bishop, I.D., and Williamson, I.P., DISCUSS: A soft computing approach to spatial
disaggregation in economic evaluation of public policies, Transactions in GIS, 10, 265-278, 2006.
© 2008 by Taylor & Francis Group, LLC
190 GIS for environmental decision-making
2.
Arnstein, S., A ladder of citizen participation, Journal of the American Institute of Planners, 35, 45-54,
1969.
3.
Fabos, J. Gy., and Caswell, S.J., Composite Landscape Assessment: Assessment Procedures for
Special Resources, Hazards and Development Suitability, Part II of the Metropolitan Landscape
Planning Model, Massachusetts Agricultural Experiment Station, Amherst, 1977.
4.
Cocks, K.D., Ive, J.R., Dans J.R., and Baird I.A., SIRO-PLAN and LUPLAN: An Australian approach
to land-use planning. 1. The SIRO-PLAN land-use planning method, Environment and Planning B:
Planning and Design, 10, 331-345, 1983.
5.
McDonald, G.T. and Brown, A.L., The land suitability approach to strategic land-use planning in
urban fringe areas, Landscape Planning, 11, 125-150, 1984.
6.
Travis, M.R., Elsner, G.H., Iverson, W.D., and Johnson, C.G., VIEWIT: Computation of Seen Areas,
Slope, and Aspect for Land-Use Planning, USDA Forest Service Gen. Tech. Rep. PSW-11/1975,
Berkeley, California, 1975.
7.
Tomlin, C. D. and Tomlin, S.M., An overlay mapping language, presented at the Annual Meeting of
American Society of Landscape Architects, 1981.
8.
Myklestad, E. and Wagar, J. A., PREVIEW: computer assistance for visual management of forested
landscapes, Landscape Planning, 4, 313-331, 1977.
9.
Bureau of Land Management, Visual Simulation Techniques, US Government Printing Office, US
Department of the Interior, Washington, DC, 1980.
10.
Benson, J.F., The visualization of windfarms, in Visualization in Landscape and Environmental
Planning, Bishop, I.D. and Lange, E., Eds., Taylor & Francis, London, 2005, 184-192.
11.
Klosterman, R.K., The What if? planning support system, in Planning Support Systems: Integrating
Geographic Information Systems and Visualization Tools, Brail, R.K. and Klosterman, R.E., Eds., ESRI
Press, Redlands, CA, 2001, 262-284.
12.
Kwartler, M. and Bernard, R.N., CommunityViz: an integrated planning support system, in Planning
Support Systems: Integrating Geographic Information Systems and Visualization Tools, Brail, R.K. and
Klosterman, R.E., Eds., ESRI Press, Redlands, CA, 2001, 285-308.
13.
Bishop, I. D., Hull, R. B., and Stock, C., Supporting personal world-views in an envisioning system,
Environmental Modelling & Software, 20, 1459-1468, 2005.
14.
Tufte, E.R., Envisioning Information, Graphics Press, Cheshire, CT, 1990.
15.
Brail, R.K. and Klosterman, R.E., Eds., Planning Support Systems: Integrating Geographic
Information Systems and Visualization Tools, ESRI Press, Redlands, CA, 2001.
16.
Kwartler M., Visualization in support of public participation, in Visualization in Landscape and
Environmental Planning, Bishop, I.D. and Lange, E., Eds., Taylor & Francis, London, 2005, 251-260.
17.
Stock, C. and Bishop, I.D., 2005., Helping rural communities envision their future, in Visualization in
Landscape and Environmental Planning, Bishop, I.D. and Lange, E., Eds., Taylor & Francis, London,
2005, 145-151.
18.
Arthur, W. B., Designing economic agents that act like human agents - a behavioral approach to
bounded rationality, American Economic Review, 81, 353-359, 1991
19.
Spottiswood, L. and Bishop, I.D., An agent-driven virtual environment for the simulation of land use
decision-making, in Proceedings of the International Congress on Modelling and Simulation,
Melbourne, December 12-15, 2005, 3085-3091.
© 2008 by Taylor & Francis Group, LLC
Tools for collaborative decision-making 191
20.
Williamson, I., Land administration and spatial data infrastructures: trends and developments, in
Proceedings of XXII FIG International Congress, Washington, DC, 2002.
21.
Open Geospatial Consortium, , 2006.
22.
MacEachren, A.M. and Brewer, I., Developing a conceptual framework for visually-enabled
geocollaboration, International Journal of Geographical Information Science, 18, 1-34, 2004.
23.
MacEachren, A.M., Moving geovisualization toward support for group work, in Exploring
Geovisualization, Dykes, J., MacEachren, A.M., and Kraak, M-J., Eds, Elsevier, Amsterdam, 2005, 445-
461.
24.
Herwig, A., Kretzler, E., and Paar, P., Using games software for interactive landscape visualization,
in Visualization in Landscape and Environmental Planning, Bishop, I.D. and Lange, E., Eds., Taylor &
Francis, London, 2005, 62-67.
25.
Bishop, I.D., Stock, C., O'Connor, A., Csaky, D., Pettit, C., and Creasey, J., Interfacing visualisation
with SDI for collaborative decision-making, presented at the Conference of the Spatial Science Institute,
Melbourne, September 12-16, 2005.
26.
O’Connor, A., Stock, C., and Bishop, I., SIEVE: An online collaborative environment for visualising
environmental model outputs, in Proceedings of the International Congress on Modelling and
Simulation, Melbourne, December 12-15, 2005, 3078-3084.
27.
Stock, C., Pettit, C., Bishop, I. D., and O’Connor, A N., Collaborative decision-making in an
immersive environment built on online spatial data integrating environmental process models, in
Proceedings of the International Congress on Modelling and Simulation, Melbourne, December 12-15,
2005, 3092-3098.
28.
Bishop, I.D., Stock, C., Pettit, C., Aurambout, J-P, Chen, T., O'Connor, A., and Spottiswood, L.,
Prospects and plans for a fully integrated collaborative virtual environment: from SDI to AR and back,
Cartography and Geographic Information Science (to appear in special issue on collaborative GIS),
2007.
29.
ESRI, ArcGIS 9.1, Environmental Systems Research Institute, , 2005.
30.
GarageGames, Torque Game Engine, , 2006.
© 2008 by Taylor & Francis Group, LLC