computer graphics c version phần 9 potx
Bạn đang xem bản rút gọn của tài liệu. Xem và tải ngay bản đầy đủ của tài liệu tại đây (2.36 MB, 67 trang )
We can rewrite this expression in the form
Section
14-6
Ray-Tracirig
Methods
where parameters such as
a,
b,
c, and
d
are used to represent the various dot
products. For example,
Finally, we can expre5s the denominator in
Eq.
14-46
as a Taylor-series expansion
and retain terms up to second degree in
x
and
y.
This yields
where each
T,
is a function of parameters
a,
b,
c,
and so forth.
Using forward differences, we can evaluate
Eq.
14-48
with only two addi-
tions for each pixel position
(x,
y)
once the initial forward-difference parameters
have been evaluated. Although fast Phong shading reduces the Phong-shading
calculations, it still takes approximately twice as long to render a surface with
fast Phong shading as it does with Gouraud shading. Normal Phong shading
using forward differences takes about six to seven times longer than Gouraud
shading.
Fast Phong shading for dihse reflection can
be
extended to include specu-
lar reflections. Calculations similar to those for diffuse reflections
are
used to
evaluate specular terms such as
(N
.
H)"s
in the basic
illumination
model. In ad-
dition, we can generalize the algorithm to include polygons other than triangles
and finite viewing positions.
14-6
RAY-TRACING
METHODS
In Section 10-15, we introduced the notion of
ray
cnsting,
where a ray is sent out
from each pixel position to locate surface intersections for object modeling using
constructive solid geometry methods. We also discussed the use of ray casting as
a
method for determining visible surfaces in a scene (Section
13-10).
kay
tracing
is
an extension of this basic idea. Instead of merely looking for the vislble surface
for each pixel, we continue to bounce the ray around the scene, as illustrated
in
Fig. 14-49, collecting intensity contributions. This provides a simple and power-
ful rendering technique for obtaining global reflection and transmission effects.
The basic ray-tracing algorithm also provides for visible-surface detection,
shadow effects, transparency, and multiple light-source illumination Many ex-
tensions to
the
basic algorithm have been developed to produce photorealistic
displays. Ray-traced displays can be highly realistic, particularly for shiny ob-
jects, but they require considerable computation time to generate. An example of
the global reflection and transmission effects possible with ray tracing is shown
in
Fig. 14-50.
Simpo PDF Merge and Split Unregistered Version -
Chapter
14
lllumination
Models
and
Surface-
point
Figure
14-49
Tracing a ray from the projection reference point through a pixel
position with multiple reflections and transmissions.
Basic
Ray-Tracing
Algorithm
We first set up a coordinate system with the pixel positions designated in the
r!/
plane. The scene description
is
given in this reference frame (Fig. 14-51]. From the
center of projection, we then determine a ray path that passes through the center
of each screen-pixel position. lllumination effects accumulated along this ray
path are then assigned to the pixel. This rendering approach is based on the prin-
ciples of geometric optics. Light rays from the surfaces in a scene emanate in
all
directions, and some will pass through the pixel positions in the projection plane.
Since there are an infinite number of ray paths, we determine the contributions to
a particular pixel by tracing a light path backward from the pixel to the scene. We
first consider the basic ray-tracing algorithm with one ray per pixel, which is
equivalent
to
viewing the scene through a pinhole camera.
A
iay-traced scene, showing global
reflection and transmission
illumination effects from object
-
<-
surfaces.
(Cuurtrsy
of
Ei,ans
6
Strlhcrln~td
)
Simpo PDF Merge and Split Unregistered Version -
pixel
screen
area
centered
on
vlswtng
coordinate
orig~n
.
-
prolecuon
reference
polnl
'
For each p~xcl ray, we test each surface
in
the hcene to determine
if
it is
ill-
tcrsected by the ray.
If
a surface is intersected, we calculate the distance from the
pixel to the surtace-intersection point. The smallest calculated intersection dis-
tance identifies the visible surface for that pixel. We then reflect the ray off the
\.~siblc surfact- along a spccular path (angle of refierticm equals angle
of
inci-
dence)
If
the surface is transparent, we also send a r.ay through the surface in the
retraction dircctmn. Reflection and refraction rays arc referred to as
x~lnrdny
r,11/2.
Thib proc,eJurr. is repeated for each secondary
:a!-:
Objects are tested for in-
tcmection, and the nearest surface along
a
vxond,~ry ray path is used to recur-
3n.ely produce the next generation
of
rdlec\lon and reiractiun paths.
As
the rays
from a p1xc.l ricochet through the scene, each succ~wively intersected surface is
'~dded to a blnary
my-lmcing
tree,
as shown in Fig
14-52.
We use left branches in
the trec to represent reflection paths, and right branches represent transmission
paths, Max~rnuni dtyth of the ray-tracing trees can be set as a user option, or it
i,ui be determined by the amount of storagc availal~lc.
A
path in the tree is then
terniina ted
if
it reaches the preset maximum
or
if
the ray strikes a light source.
The intensity assigned
to
a pixel is then determined by accumulating the in-
tensity contributions, starting at the bottoni (terminal nodes) of its ray-tracing
tree. Surface ~ntensity from each node in the tree is attenuated by the distance
from the "parent" surface (next node up the tree) and added to the intensity of
the parent surface.
Pixel
intensity is then the sum
of
the attenuated intensities
at
the root node of
Ihe
ray tree.
If
no surfaces are inter~ccted
by
a pixel ray the ray-
tracing tree
is
eniptv and the pixel is assigned the intensity value of the back-
ground
If
a pxcl my intersects a nonreflecting light source. the pixel can be as-
sped the mtensity of the source, although light sources are usuallv placed
hevond the path
of
the initial rays.
Figure
14-53
shows a surface intersected by a ray and the unit vectors
needed for the reflected light-intensity calculations. Unit vector
u
is in the direc-
t~on of the ray p.ith,
N
is the unit surface normal,
R
i\
the unit reflection \vctor,
L
it.
thc unit \~~tnr. pointing to the light source, and
H
15
the unit \.ector halfway
br-
t\\wn
V
toppusite
lo
u)
and
L.
The path along
L
ib rvterred to as the
shadow
ray.
It
,inv
object ~ntrrsects the shadow ray between thts surface
and
the point light
Section
14-6
E.lv-Trac~nfi
Methods
Simpo PDF Merge and Split Unregistered Version -
Chapter
I4
Illumination
Models
and
Surface.
Rendering
Methods
pro)ection
reference point
-
-
-
-
-
- -
-
A
Figure
14-52
(a)
Reflection and refraction
ray
paths
through
a
scene lor
a
screen pixel.
(b)
Binary ray-tracing
tree
for the
paths
shown
in
(a).
source, the surface is
in
shadow with respect to that source. Ambient light at the
surface is calculated as
kJ,;
diffuse reflection due to the source is proportional to
kd(N
.
L);
and the specular-reflection component is proportional to
k&H.
NP.
As
discussed in Section
14-2,
the specular-reflection direction for the secondary ray
path
R
depends on
the
surface normal and
the
incorning ray direction:
For a transparent surface, we also need to obtain intensity contributions
from light transmitted through the material.
We
can locate the source of this
con-
tribution
by
tracing a xcondary ray along the transmission direction
T,
as shown
in Fig.
14-54.
The unit transmission vector can
be
obtained from vectors
u
and
N
as
Simpo PDF Merge and Split Unregistered Version -
,
light
\,
,
-
.,
\.A
-
source
,!
$
\'\
Figur~.
14-53
Unit
vectors
at
the surface
of
an
objt
intersected
by an
incoming ray along direction
u.
Figure
14-54
Refracted
ray pathT
through
a
transparent material.
Parameters
qi
and
T,
are the indices of rehadion in the incident material and the
reha,cting material, respectively. Angle of refraction
0,
can be calculated from
Snell's law:
Ray-Surface
Intersection
Calculations
A ray can
be
described with an initial position
Po
and unit direction vector
u,
as
illustrated
in
Fig.
14-55.
The coordinates of any point
P
along the
ray
at
a
distance
s
from
Po
is
computed from the
ray equation:
Initailly,
Po
can be set to the position of the pixel on the projection plane, or it
could be chosen to
be
the projection reference point. Unit vector
u
is
initially ob-
Section
14-6
Ray-Tracing
Methods
Simpo PDF Merge and Split Unregistered Version -
Chapter
14
Illumination Models and Surface-
Rendering
Melhods
Figure
14-55
Describing a ray
with
an initial-
x
position vector
Po
and
unit
direction
vector
u.
tained from the position of the pixel through which the ray passes and the projec-
tion reference point:
At each intersected surface, vectors
Po
and
u
are updated for the secondary rays
at the ray-surface intersection point. For the secondary rays, reflection direction
for
u
is
R
and the transmission direction is
T.
To locate surface intersections, we
simultaneously solve the ray equation and the surface equation for the individ-
ual
objects in the scene.
The simplest
objects
to
ray
trace
are spheres.
If
we have
a
sphere of radius
r
and center position
P,
(Fig.
14-56),
then any point
P
on the surface must satisfy
the sphere equat~on:
Substituting the ray equatlon
14-53,
we have
If
we
let
AP
=
P,
-
P,,
md
expand the dot product, we obtain the quadrat~c equa-
tion
Simpo PDF Merge and Split Unregistered Version -
kcbion
14-6
Ray-Tracing
Mcthodr
Figun
14-57
A
"spherefhke"
rendered
with
ray
tracing
using
7381
spheres
and
3
light
sources.
(CouHcq
of
Eric
Hains,
3DIEYE Inc.)
whose solution is
If
the diinant
is
negative, the ray does not intersect
the
sphere. Otherwise,
the surfa~intersection coordinates
are
obtained from the ray equation
14-52
using the smaller of the two values
from
Eq.
14-57.
For
small
spheres that
are
far
from the initial ray position,
Eq.
14-57
is
sus-
ceptible
to
roundoff
emrs.
That
is,
if
we could lose the
9
term
in
the
precision
error of
I
AP
1
'.
We can avoid
this
for
most
cases
by rearranging the calculation for distance
s
as
Figure
14-57
shows a snowflake pattern of
shiny
spheres
rendered
with ray trac-
ing
to display global surface reflections.
Polyhedra
require
moxe processing
than
spheres to locate surface intersec-
tions. For that reason, it
is
often
better
to
do
an
initial intdon test on
a
bounding volume. For example, Fig.
14-58
shows a polyhedron bounded by a
sphere.
If
a ray does not intersect
the
sphexe,
we
do not
need
to do any
further
testing on the polyhedron. But
if
the ray does intersect the sphere,
we
first locate
"front"
faces
with the test
wh
N
is
a
surface normal. For each face
of
the polyhedron that
satisfies
in-
equality
14-59,
we solve the plane equation
for surface position
P
that also
satisfies
the ray equation
14-52.
Here,
N
=
(A,
B,
8
Simpo PDF Merge and Split Unregistered Version -
Chapter
14
Illumination Models and
Surface-
Rendering
Methods
-
Figure
11-58
Polyhedron enclosed
by
a
boundmg
sphere.
and
D
is the fourth plane parameter. Position
P
is both on the plane and on the
ray path
if
And the distance from the initial ray position to the plane is
This gives us a position on the infinite plane that contains the polygon face, but
this position may not be inside the polygon boundaries (Fig.
14-59).
So we need
to perform an "inside-outside" test (Chapter
3)
to determine whether the ray in-
tersected this face of the polyhedron. We perform this test for each face satisfying
inequality
14-59.
The smallest distance
s
to an inside point identifies the inter-
sected face of the polyhedron.
If
no intersection positions from
Eq.
14-62
are in-
side points, the ray does not intersect the objjt.
Similar procedures are used to calculate ray-surface intersection positions
for other objects, such as quadric or spline surfaces. We combine the ray equation
with the surface definition and solve for parameter
s.
In many cases, numerical
root-finding methods and incremental calculations are used to locate intersection
intersection
polygon
-
-
-
-
.
-
Fipr13
I+iY
Ray
intersection
with
the
plane
of
n
polvgon.
Simpo PDF Merge and Split Unregistered Version -
Section
14-6
Ray-Tracmg
Methods
I'ipre
14-60
A
ray-haced scene showing global reflection
of
surfacetexture
patterns.
(Courtesy
of
Sun
Micms.ystms.)
points over a surface. Figure
14-60
shows a ray-traced scene containing multiple
objects and texture patterns.
Reducing Object-Intersection Calculations
Raysurface intersection calculations can account for as much as
95
percent of the
processing time in a ray tracer. For a scene with many objects, most of the pro-
cessing time for each ray is spent checking objects that are not visible along the
ray path. Therefore, several methods have been developed for reducing the
pro-
cessing time spent on these intersection calculations.
One method for reducing the intersection calculations is to enclose groups
of adjacent objects within a bounding volume, such as a sphere or a box (Fig.
14-
61).
We can then test for ray intersections with the bounding volume. If the ray
does not intersect the bounding object, we can eliminate the intersection tests
with the enclosed surfaces. This approach can
be
extendcd to include a hierarchy
of bounding volumes. That is, we enclose several bounding volumes within a
larger volume and carry out the intersection tests hierarchically. First, we test the
outer bounding volume; then, if necessary, we test the smaller inner bounding
volumes; and so on.
Space-Subdivision Methods
Another way to reduce intersection calculations, is to use space-subdivision meth-
ods. We can enclose a scene within
a
cube, then we successively subdivide the
cube until each subregion (cell) contains no more than a preset maximum num-
ber of surfaces. For example, we could require that each cell contain no more
than one surface.
If
parallel- a11d vector-processing capabilities are available, the
maximum number of surfaces per cell can be determined by the size of the vector
bounding
sphere
Fqpn
14-hl
A
group of objects enclosed
within
a
bound~ng
sphere.
Simpo PDF Merge and Split Unregistered Version -
Chapter
14
lllum~nat~on Models and Sutiace-
Render~ng
Methods
pixel
ray
Figrcre
14-62
Ray intersertion with a cube
enclosing all objects in
a
scene.
registers and the number of processors. Space subdivision of the cube can be
stod in an octree or in a binary-partition tree. In addition, we can perform a
uniform subdivision
by dividing the cube into eight equal-size octants at each step,
or we can perform an
adaptive subdivision
and subdivide only those regions of the
cube containing objects.
We then trace rays through the individual cells of the cube, performing in-
tersection tests only within those cells containing surfaces. The first object surface
intersected by
a
ray is the visible surface for that ray. There is a trade-off between
the cell size and the number of surfaces per cell. If we set the maximum number
of surfaces per cell too low, cell size can become so small that much of the sav-
ings in reduced intersection tests
goes
into cell-traversal processing.
Figure
14-62
illustrates the intersection of a pixel ray with the front face of
the cube enclosing a scene. Once we calculate the intersection point on the front
face of the cube, we determine the initial cell intersection by checking the inter-
section coordinates against the cell boundary positions. We then need to process
the ray through the cells
by
determining the entry and exit points (Fig.
14-63)
for
each cell traversed by the ray until we intersect an object surface or exit the cube
enclosing the scene.
Given a ray direction
u
and
a
ray entrv position
Pi,
for
a
cell, the potential
exit faces are those for which
If the normal vectors for the cell faces in Fig.
14-63
are aligned with the coordi-
nates axes, then
Fixrrrc
14-63
Ray traversal through
a
subregion
(cell) of a cube enclosing
a
scene.
Simpo PDF Merge and Split Unregistered Version -
and we only need to check the sign of each component of
u
to determine the
sdi
14-6
,
three candidate exit planes. The exit position on each candidate plane
is
obtained
Ray-Trac~ng
Methods
hm the ray equation:
where
st
is the distance along the ray from Pi, to P,*. Substituting the ray equa-
tion into the plane equation for each cell face:
we can solve for the ray distance to each candidate exit face as
and then select smallest
s,.
This caiculation can
be
simplified
if
the normal vec-
tors
N,
are aligned with the coordinate axes. For example,
if
a candidate normal
vector is
(1,
0,
O),
then for that plane we have
where
u
=
(u,, u,,
u,),
and
xk
is the value of the right
boundary
face for the cell.
Various modifications can
be
made to the cell-traversal procedures to speed
up the processing. One possibility is to take a trial exit plane
k
as the one
perpen-
dicular to the direction of the largest component of
u.
The sector on the hial
plane (Rg.
14-61)
containing P,t,kdetermines the true exit plane.
If
the intersec-
tion point is in sector
0,
the trial plane is the true exit plane and we are
done.
If
the intersection point is sector
1,
the true exit plane
is
the top plane and
r$
4
we simply need to calculate the exit point on the top boundary of the cell. Simi-
larly, sector
3
identifies the bottom plane
as
the true exit plane; and sectors
4
and
2
identify the true exit plane as the left and right cell planes, respectively. When
8
the trial exit point falls in sector
5,6,7,
or
8,
we need to cany out two additional
intersection calculations to identify the true exit plane. Implementation of these
Fi,v,llr
methods on parallel vector machines provides further improvements in perfor-
sectors
of
the trial exit plane,
mance.
The scene
in
Fig.
14-65
was ray traced using spacesubdivision methods.
Without space subdivision, the ray-tracing calculations took
10
times longer.
Eliminating the polygons also speeded up the processing. For a scene containing
2048
spheres and no polygbns, the same algorithm executed
46
times faster than
the basic ray tracer.
Figure
14-66
illustrates another ray-traced scene using spatial subdivision
and parallel-processing methods. This image of Rodin's Thinker was ray traced
with over
1.5
million rays in
24
seconds.
The scene shown in Fig.
14-67
was rendered with a
light-buffer
technique,
a
form of spatial partitioning. Here, a
cube
is centered on each point light source,
and each side of the cube is partitioned with a grid of squares,
A
sorted list of ob-
jects that are visible to the light through each square is then maintained by the
ray tracer to speed up processing of shadow rays. To determine surface-illumina-
tion effects, the square for each shadow ray is computed and the shadow ray is
then processed against the list of objects for that square.
Simpo PDF Merge and Split Unregistered Version -
Chaptu
14
Intersection testa
in
ray-tracing programs can also
be
reduced with
direc-
illumination
~odels and
Surface-
tional
subdivision
procedures,
by
considering sectors that contain a bundle
of
Rendering
M*hods
rays.
W~thin
each sector, we can
sort
surfaces in depth order,
as
in Fig.
14-68.
Each
ray then only needs to test
objects
within the sector that contains that ray.
Antialiased
Ray
Tracing
Two
basic
tdmiques
for
antialiasing
in
ray-tracing algorithms are
supersmtrpling
and
adpptive
sampling.
Sampling
in
ray tracing
is
an extension
of
the sampling
methods we discussed
in
Chapter
4. In
supersampling and adaptive sampling,
Figure
14-65
A
parallel ray-traced scene containing
37
spheres
and
720
polygon
surfaces.
The ray-tracing algorithm
used
9
rays
per
pixel
and
a
tree
depth of
5.
Spatial
subdivision methods
pxocsd
the scene
10
times
faster
than
the
basic
ray-tracing algorithm on an
AUiant
FW8.
(Courtmy
of La-Hian
Quek,
Information
Tdnology
Imtihrtc, Republic
of
Singapon.)
-
Figirrr
:
1
This
ra;
14-66
y-traced scene took
24
seconds to render on
a
Kepdall
Square
Research KSRl parallel
computer with
32
~TOC~SSOIS.
Rodin's Thinker
was
modeled with
3036
primitives.
Two
light
sources
and one primary
ray
per pixel
were
used
to obtain
the
giobal
illumination effects from the
1,675,776
rays processed.
(Courtesy of
M.
1.
Kealps
and
R.
1.
Hubbold,
Dcpllrtmrnt
olCmnpuln
Scirnu,
Univmrfy of
Manchheslcr.)
Simpo PDF Merge and Split Unregistered Version -
Figure
14-67
A
room scene illuminated with
5
light
sources
(a) was rendered using
the ray-tracing light-buffer technique to
process
shadow
rays.
A
closeup
(b)
of part of the room shown
in
(a) fflustrates the global illumination
effects. The
mom
is modeled with
1298
polygons,
4
spheres,
76
cylinders, and
35
quadrics. Rendering time was
246
minutes
on
a
VAX
11
/780,
compared to
602
minutes without using light
buffers.
(Courtesy
of
Erlc
Heines end
Donald
I?
Grembng,
Ptvparn
of Computn
Graphics,
Cornell
Univnsify.)
Bundle
of
Rays
Figrcrc
14-68
Directional subdivision of
space.
All rays
in
this sector
only need to test the surfaces within the &or in depth
order.
the pixel is treated as a finite square area instead
of
a single point. Supersampling
uses multiple, evenly spaced rays (samples) over each pixel area. Adaptive sam-
pling
uses
unevenly spaced rays in some regions of the pixel area. For example,
more rays can
be
used
near
object
edges to obtain a better estimate of the pixel in-
tensities. Another method for sampling
is
to randomly distribute the rays over
the pixel
area.
We discuss this approach in
the
next
section.
When multiple rays
Simpo PDF Merge and Split Unregistered Version -
Illumination
Modcls
and
Surface-
Rendering
Mehods
Figure
14-70
Subdividing
a
pixel into
nine
subpixels
with one ray
at
each subpixel corner.
Fipn
14-71
Ray
positions
centered on
subpixel areas.
Pixel
Pmitiona
on
Pmjec(ion
Plane
Reference
Point
Figure
14-69
Supersampling with four rays per pixel,
one
at
each pixel corner.
per pixel are used, the intensities of the pixel rays are averaged to produce the
overall pixel intensity.
Figure
14-69
illustrates a simple supersampling procedure. Here, one ray is
generated through each comer of the pixel. If the intensities for the four rays are
not approximately equal, or if some sman object lies between the four rays, we
divide the pixel area into subpixels and repeat the process. As an example, the
pixel
in
Fig.
14-70
is
divided into nine subpixels using
16
rays, one at each sub-
pixel corner. Adaptive sampling
is
then used to further subdivide those subpixels
that do not have nearly equal-intensity rays or that subtend some small obj.
This
subdivision process can
be
continued until each subpixel has approximately
equal-intensity rays or an upper bound, say,
256,
has been reached for the num-
ber of rays
per
pixel.
The cover picture for this
book
was rendered with adaptive-subdivision ray
tracing, using Rayshade version
3
on a Macintosh
11.
An extended light
source
was used to provide realistic soft shadows. Nearly
26
million primary rays were
generated, with
33.5
million shadow rays and
67.3
million reflection rays.
Wood
grain and marble surface patterns were generated using solid texturing methods
with a noise function. Total rendering time with the extended llght source was
213
hours. Each image of the stereo pair shown in Fig.
2-20
was generated in
45
hours using a point light source.
Instead of passing rays through pixel
corners,
we can generate rays through
subpixel centers, as in Fig.
14-71.
With this approach, we can weight the rays ac-
cording to one of the sampling schemes discussed in Chapter
4.
Another method for antialiasing displayed scenes is to treat a pixel ray as a
cone,
as
shown in Fig.
14-72.
Only one ray is generated per pixel, but the ray now
has
a
finite
cross
section. To determine the percent of pixel-area coverage with
obpcts, we calculate the intersection of the pixel cone with the object surface. For
a sphere, this quires finding the intersection of two circles. For
a
polyhedron,
we must find the intersection of a circle with
a
polygon.
Distributed
Ray
Tracing
This
is a stochastic sampling method that randomly distributes rays according to
the various parameters in an illumination model. Illumination parameters in-
Simpo PDF Merge and Split Unregistered Version -
Section
14-6
Ray-Tracing
Methods
clude pixel area, reflection and refraction directions, camera lens area, and time.
Aliasing efferts are thus replaced with low-level "noise", which improves picture
quality and allows more accurate modeling of surface gloss and translucency,
fi-
nite camera apertures, finite light sourres, and motion-blur displays of moving
objects.
~istributcd
ray
tracing
(also referred to as distribution ray tracing) essen-
tially provides a Monte Carlo evaluation of the multiple integrals that occur in an
accurate description of surface lighting.
Pixel sampling is accomplished by randomly distributing a number of rays
over the pixel surface. Choosing ray positions completely at random, however,
can result in the rays clusteringtog&her in a small -%ion of the pixel area, and
angle, time, etc.), as explained in the following discussion. Each subpixel ray is
then processed through the scene to determine the intensity contribution for that
ray. The 16 ray intensities are then averaged to produce the overall pixel inten-
pi,e,
using
16
sity.
If
the subpixel intensities vary too much, the pixel is further subdivided.
subpixel
areas and a jittered
To model camera-lens effects, we set a lens of assigned focal length
f
in front
position from
!he
center
of the projection plane ,and distribute the subpixel rays over the lens area. As-
coordinates for each subarea.
suming we have 16 rays
per
pixel, we can subdivide the lens area into 16 zones.
Each ray is then sent to the zone corresponding to its assigned code. The ray po-
sition within the zone is set to a jittered position from the zone center. Then the
ray is projected into the scene from the jittered zone position through the focal
point of the lens. We locate the focal point for a ray at a distance
f
from the lens
along the line from the center of the subpixel through the lens center,
as
shown in
Fig. 14-74. Objects near the focal plane are projected as sharp images. Objects in
front or in back of the focal plane are blurred. To obtain better displays of out-of-
focus objects, we increase the number of subpixel rays.
Ray reflections at surfaceintersection points
are
distributed about the spec-
ular reflection direction
R
according to the assigned ray codes (Fig. 14-75). The
leaving other parts of the pixel unsampled.
A
better approximation of the light
distribution over a pixel area
is
obtained by using a technique called jittering on
a
regular subpixel grid. This
is
usually done by initially dividing the pixel area (a
unit square) into the 16 subareas shown in Fig. 14-73 and generating a random
jitter position in each subarea. The random ray positions are obtained by jittering
the center coordinates of each subarea by small amounts,
6,
and
Gy,
where both
6,
and
6,
are assigned values in the interval (-0.5,0.5). We then choose the ray po-
sition in a cell with center coordinates
(x,
y)
as the jitter position
(x
+
S,,
y
+
SY).
Integer codes 1 through 16 are randomly assigned to each of the 16 rays,
and a table Imkup is used to obtain values for the other parameters (reflection
-
a
e"*
Simpo PDF Merge and Split Unregistered Version -
,-
Focal
Ray
Direction
Figure
14-74
Distributing subpixel rays over
a
camera lens of focal length/.
incoming
maximum spread about
R
is divided into
16
angular zones, and each ray is re-
+
fleeted
in
a jittered position
from
the zone center corresponding to its integer
code. We can use the Phong model, cosn%$, to determine the maximum reflection
spread. If the material is transparent, refracted rays are distributed about the
transmission direction
T
in
a similar manner.
Extended light sources are handled by distributing a number of shadow
11'
rays over the area of the light source, as demonstrated in Fig.
14-76.
The light
source
is
divided into zones, and shadow rays are assigned jitter directions to the
various zones. Additionally, zones can
be
weighted according to the intensity of
Figure
14-75
the light source within that zone and the size of the projected zone area onto the
Dishibutingsub~ivelraYs
object surface. More sFdow rays are then sent to zones with higher weights. If
about
themfledion
direction
some shadow rays are blocked by opaque obws between the surface and the
R
and the transmission
light
source,
a penumbra
is
generated at that surface point.
Figure
14-77
illus-
diredion
T.
trates the regions for the umbra and penumbra on a surface partially shielded
from
a light source.
We create motion blur by distributing rays over time. A total frame time
and the frame-time subdivisions are'determined according to the motion dynam-
ics required for the scene. Time intervals are labeled with integer codes, and each
ray
is
assigned to a jittered time within the interval corresponding to the ray
code. 0bGts are then moved to their positions at that time, and the ray is traced
Figure
14-
76
Distributing shadow rays over a
finitesized light source.
Sun
Earth
Penumbra
Figure
14-77
Umbra and penumbra regions created by
a
solar eclipse on the surface
of the earth.
Simpo PDF Merge and Split Unregistered Version -
f
Scc(ion
11-6
Ray-Tracing
Mods
Figurr
24-78
A
scene,
entitled
1984,
mdered
withdisbibuted
ray
bating,
illustrating motion-blur
and
penumbra
em.
(Courtesy
of
Pimr.
Q
1984
Pirnr.
All
rights
d.)
through the scene. Additional rays are
us4
for highly
blurred
objects. To reduce
calculations, we can
use
bounding boxes or spheres for initial ray-intersection
tests.
That
is,
we move the bounding object according to the motion
requirements
and test for intersection. If the ray does not intersect the bounding obpct. we do
not need to process the individual surfaces within the bowding volume. Fip
14-78
shows a scene displayed
with
motion blur.
This
image was rendered using
distributed ray hacing with
40%
by
3550
pixels and
16
rays per pixel.
In
addition
to the motion-blurred reflections, the shadows
are
displayed with penumbra
areas resulting from the extended light sources around the room that are
illumi-
nating the
pool
table.
Additional examples of objects rendered with distributed ray-tracing meth-
ods are given in Figs. 14-79 and
14-80.
Figure
14-81
illushates focusing,
drat-
tion, and antialiasing effects with distributed ray tracing.
Fiprrc
14-79
A
brushed aluminum
wheel
showing reflectance
and
shadow
effects
generated with dishibuted
ray-tracing
techniques.
(Courtesy
of
Stephen
H.
Wcsfin,
Pmgram
of
Compvtn
Graphics,
Carnell
Uniwsity
)
Simpo PDF Merge and Split Unregistered Version -
Figurn
14-80
A
mom
scene
daPd
with
distributed
ray-tracing
methods.
~~rtcsy
of
jdrn
Snyder,
jd
Lm&
Dmoldm
Kalrn,
and
U
Bwr,
Computer
Gmphks
Lab,
C11if.Mlr
Imtihrte
of
Tachndogy.
Cqyright
O
1988
Gltcrh.)
Figurn
14-81
A
scene
showing
the
fodig,
antialias'i
and
illumination
effects
possible with a combination
of ray-tracing and radiosity
methods. Realistic physical models
of light illumination
were
used
to
generate the refraction effects,
including the caustic
in
the shadow
of
the
glass.
(Gurtrsy
of
Pctn
Shirley,
Department
of
Cmnputer
Science,
lndicrna
Unhity.)
14-7
RADlOSlTY
LIGHTING
MODEL
We
can
accurately model diffuse reflections from a surface
by
considering the
ra-
diant
energy
transfers between surfaces, subject to conservation of energy laws.
This
method for describing diffuse reflections
is
generally refermi to as
the
ra-
diosity model.
Basic
Radiosity
Model
In
this
method,
we need to consider the radiant-energy interactions
between
all
surfaces
in
a
scene. We do this by determining the differential amount of radiant
energy
dB
leaving
each
surface point in the scene and summing the energy
con-
hibutions over
all
surfaces to obtain the amount of
energy
transfer between sur-
faces. With mference to Fig.
14-82,
dB
is
the
visible radiant energy emanating
from the surface point in the direction given by angles
8
and
4
within
differential
solid angle
do
per unit time per unit surface
area.
Thus,
dB
has
units
of
joules/(sec-
ond
.
metd),
or
watts/metd.
Intensity
1,
or
luminance,
of the diffuse radiation
in
direction
(8,
4)
is
the ra-
diant energy
per
unit time per unit
projected
area
per
unit solid angle with units
mtts/(mete$
.
steradians):
Simpo PDF Merge and Split Unregistered Version -
/'
Direction of
Figure
14-82
Visible radiant energy emitted from
a surface point in direction
(O,+)
within
solid
angle
dw.
Figure
14-83
For a unit surface element, the
projected area
perpendicular
t'o the
direction of energy transfer is equal
to cos
+.
Radiosity Lighting
Model
Assuming the surface is an ideal diffuse reflector, we can
set
intensity
I
to a con-
stant for all viewing directions. Thus,
dB/do
is
proportional to the projected sur-
face area (Fig.
14-83).
To obtain the total rate of energy radiation
from
the surface
point, we need to sum the radiation for all directions. That is, we want the to-
tal energy emanating from a hemisphere centered on the surface point, as in
Fig.
14-84:
For a perfect
diffuse
reflector,
I
is
a constant,
so
we can express radiant energy
B
as
Also, the differential element of solid angle
do
can
be
expressed as (Appendix A)
Figure
14-84
Total radiant energy from a surface
point
is
the sum of the
contributions in all directions over a
hemisphere cented on the surface
point
Simpo PDF Merge and Split Unregistered Version -
Chapter
14
Illumination Models and Surface-
Rendering Methods
Figure
14-85
An enclosure of surfaces for the radiosity model.
so
that
A
model for the light reflections from the various surfaces is formed by set-
ting up an "enclosure" of surfaces (Fig.
14-85).
Each surface in the enclosure is ei-
ther a reflector, an emitter (light source), or a combination reflector-emitter. We
designate radiosity parameter
Bk
as the total rate of energy leaving surface
k
per
unitxea. Incident-energy parameter
Hk
is
the sum of the energy contributions
from all surfaces in the enclosure arriving at surface
k
per unit time per unit area.
That is,
where parameter
Flk
is the form factor for surfaces
j
and
k.
Form factor
Flk
is the
fractional amount of radiant energy from surface
j
that reaches surface
k.
For a scene with
n
surfaces in the enclosure, the radiant energy from surface
k
is described with the radiosity equation:
If surface
k
is
not
a
light source,
E,:
=
0.
Otherwise,
E,
is the rate of energy em~tted
from surface
k
per unit area (watts/meter?. Parameter
p,
is
the reflectivity factor
for surface
k
(percent of incident light that
is
reflected in all directions). This re-
flectivity factor is related to the diffuse reflection coefficient used in empirical
il-
lumination models. Plane and convex surfaces cannot "see" themselves, so that
no self-incidence takes place and the form factor
F,
for these surfaces
is
0.
Simpo PDF Merge and Split Unregistered Version -
To obtain the illumination effects over the various surfaces in the enclosure,
section
14-7
we need to solve the simultaneous radiosity equations for the
n
surfaces given
Radiosity
Lightmg
Model
the array values for
Ek,
pl,
and
Fjk
That is, we must solve
We then convert to intensity values
I!
by dividing the radiosity values
Bk
by
T.
For color scenes, we can calculate the mdwidual RGB components of the rad~os-
ity
(Bw,
B,,
BkB)
from
the color components of
pl
and
E,.
Before we can solve Eq.
14-74,
we need to determine the values for form
factors
Fjk
We do this by considering the energy transfer from surface
j
to surface
k
(Fig.
1486).
The rate of radiant energy falling on a small surface element
dAk
from
area element
dA,
is
dB,
dA,
=
(1,
cos
4j
do)dA,
(14-76)
But solid angle
do
can be written in terms of the projection of area element
dAk
perpendicular to the direction
dB,:
Figun
14-86
Rate of
energy
transfer
dB,
from
a surface element
with
area
dAj
to
surface element
dA,.
Simpo PDF Merge and Split Unregistered Version -
Chapter
14
so we can express Eq. 14-76 as
lllurninat~on
Models
and Surface-
Rendering Methods
The form factor between the two surfaces is the percent of energy emanating
from area dA, that is incident on dAk:
energy incident on dAk
F'IA,.IA~
=
total energy leaving dA,
- -
I, cos
4j
cos
4
dA, dAk
.
-
1
rZ
B,
dA,
Also
B,
=
rrl,,
so
that
The fraction
of
emitted energy from area dA, incident on the entire surface
k
is
then
where Ak is the area of surface
k.
We now can define the form factor between the
two surfaces as the area average of the previous expression:
COS~,
COS
4
dAk dA,
(14-82)
Integrals
14-82
are evaluated using numerical integration techniques and stipu-
lating the following conditions:
1;-
,F,,
=
1,
for all
k
(conservation of energy)
Af,,
=
AAFk, (uniform light reflection)
F,!
=
0,
for all
i
(assuming only plane or convex surface patches)
Each surface in the scene can
be
subdivided into many small polygons, and
the smaller the polygon areas, the more realistic the display appears. We can
speed up the calculation of the form factors by using a hemicube to approximate
the hemisphere. This replaces the spherical surface with a set of linear (plane)
surfaces. Once the form factors are evaluated, we can solve the simultaneous lin-
Simpo PDF Merge and Split Unregistered Version -
ear
qua
tions
14-74
using, say, Gaussian elimination or
LU
decomposition rneth-
%tion
14-7
ods (Append~x
A).
Alternatively, we can start with approximate values for the
B,
Radiosity
Lighting
Model
and solve the set of linear equat~ons iteratively using the Gauss-Seidel method.
At each iteration, we calculate an estimate of the radiosity for surface patch
k
using the previously obtained radiosity values in the radiosity equation:
We can then display the scene at each step, and an improved surface rendering is
viewed at each iteration until there is little change in the cal~lated radiosity val-
ues.
Progressive Refinement
Radiosity
Method
Although the radiosity method produces highly realistic surface rendings, there
are tremendous storage requirements, and considerable processing time
is
needed to calculate the form [actors. Using
progressive refinement,
we can reshuc-
ture the iterative radiosity algorithm to speed up the calculations and reduce
storage requirements at each iteration.
From the radiosity equation, the radiosity contribution between two surface
patches is calculated as
B,
due to
B,
=
(14-83)
Reciprocally,
B,
due to
Bk
=
p,B,F,,,
for all
j
(14-64)
which we can rewrite as
A
B,
due to
B,
=
pjBkFJk
;i:,
tor all
j
(14-851
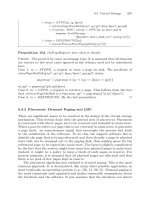
This relationship is the basis for the progressive rrfinement approach to the ra-
diosity calculations. Using a single surface patch
k,
we can calculate all form fac-
tors
F,,
and "shoot" light from that patch to all other surfaces in the environment
Thus, we need only to compute and store one hemicube and the associated form
factors at a time. We then discard these values and choose another patch for the
next iteration. At each step, we display the approximation to the rendering of the
scene.
Initially, we set
Bk
=
El:
for all surface patches. We then select the patch with
the highest radiosity value, which will
be
the brightest light
emitter,
and
calcu-
late the next approximation to the radiosity for all other patches. This process is
repeated at each step, so that light sources are chosen first in order of highest ra-
diant energy, and then other patches are selected based on the amount of light re-
ceived from the light sources. The steps in a simple progressive refinement ap-
proach are given In the following algorithm.
Simpo PDF Merge and Split Unregistered Version -
-
-
Chapter
1
4
llluminarion
Models
and
Surface
Rendering
Methods
-
Figure
14-87
Nave of Chams Cathedral
rendered with a progressive-
refinement radiosity model by John
Wallace and John Lin, using the
Hewlett-Packard Starbase Radiosity
and Ray Tracing
software.
Radiosity
form
factors were computed with
.
ray-tracing methods.
(Courtesy
of
Eric
Haines,
3D/EYE
Inc.
O
1989.
Hewklt-
Packrrrd
Co.)
For each patch
k
/'set
up
hemicube, calculate
form
factors
F,,
'/
for
each
patch
j
I
Arad
:=
p,B,FJkA,/At;
AB,
:=
AB,
+
Arad;
B,
:=
B,
+
Arad:
1
At each step. the surface patch with the highest value
for
ABdk
is selected as the
shooting patch, since radiosity is a measure of radiant energy per unit area. And
we choose the initial values as
ABk
=
Bk
=
Ek
for all surface patches. This progres-
sive refinement algorithm approximates the actual propagation of light through a
scene.
Displaying the rendered surfaces at each step produces a sequence of views
that proceeds from
a
dark scene to
a
fully illuminated one. After the first step, the
only surfaces illuminated are the light sources and those nonemitting patches
that are visible to the chosen emitter. To produce more useful initial views of the
scene, we can set an ambient light level so that all patches have some illumina-
tion. At each stage of the iteration, we then reduce the ambient light according to
the amount
of
radiant energy shot into the scene.
Figure
14-87
shows a scene rendered with the progressiverefinement ra-
diosity model. Radiosity renderings of scenes with various lighting conditions
are
illustrated in Figs.
14-88
to
14-90.
Ray-tracing methods are often combined
with the radiosity model to produce highiy realistic diffuse and specular surface
shadings, as in Fig.
14-81.
Simpo PDF Merge and Split Unregistered Version -
Rad~osily
Lighting
Model
Figure
14-88
lmage of a constructivist museum
rendered with
a
progressive-
refinement radiosity method.
(Courtesy
of
Shmchmg
Eric
Chm, Sfuart
I.
Feldman, and Inlic
Dorrty,
Program of
Computer Grapltics. Corndl Unimity.
O
1988,
Corndl Untmify, Program of
Gmpufcr Graphid
Figure
14-89
Simulation of the stair tower of
the Engineering
Theory
Center
Building at Cornell University
rendend with
a
progressive-
refinement radiosity method.
(Courtesy
of
Keith
Howie
and
Ben
hrmba,
Pmgrnm
ofhputer Gnphics.
Cmnrll Uniarsity.
0
1990,
Cornell
Unicmsity, Program of Computer
Graphin.)
Figrrrr
14-90
Simulation of two lighting schemes for the Parisian garret from the Metropolitan Opera's
production of
La
Boheme:
(a) day view and
(b)
night view.
(Courtesy of Jltlie Dorsq nnd Mnrk
Sltqard, Program
of
Compufrr Gmphics, Conrdl Ll~rirrrsity.
0
1991,
Cornell Uniiursiry, Progrntn of
Comptrlrr Graphics.)
Simpo PDF Merge and Split Unregistered Version -