Báo cáo y học: " Sputum neutrophils as a biomarker in COPD: findings from the ECLIPSE study" pdf
Bạn đang xem bản rút gọn của tài liệu. Xem và tải ngay bản đầy đủ của tài liệu tại đây (848.04 KB, 12 trang )
Singh et al. Respiratory Research 2010, 11:77
/>Open Access
RESEARCH
© 2010 Singh et al; licensee BioMed Central Ltd. This is an Open Access article distributed under the terms of the Creative Commons
Attribution License ( which permits unrestricted use, distribution, and reproduction in
any medium, provided the original work is properly cited.
Research
Sputum neutrophils as a biomarker in COPD:
findings from the ECLIPSE study
Dave Singh*
1
, Lisa Edwards
2
, Ruth Tal-Singer
3
and Stephen Rennard
4
Abstract
Introduction: The percentage of neutrophils in sputum are increased in COPD patients, and may therefore be a
biomarker of airway inflammation. We studied the relationships between sputum neutrophils and FEV
1
, health status,
exacerbation rates, systemic inflammation and emphysema, and long term variability at 1 year.
Methods: Sputum samples were obtained from 488 COPD patients within the ECLIPSE cohort. 359 samples were
obtained at baseline, and 297 after 1 year. 168 subjects provided samples at both visits. Serum interleukin-6 (IL-6), IL-8,
surfactant protein D and C-reactive protein levels were measured by immunoassays. Low-dose CT scans evaluated
emphysema.
Results: Sputum neutrophil % increased with GOLD stage. There was a weak association between % sputum
neutrophils and FEV
1
% predicted (univariate r
2
= 0.025 and 0.094 at baseline and year 1 respectively, p < 0.05 after
multivariate regression). Similar weak but significant associations were observed between neutrophil % and health
status measured using the St Georges Respiratory Questionairre. There were no associations between neutrophils and
exacerbation rates or emphysema. Associations between sputum neutrophils and systemic biomarkers were non-
significant or similarly weak. The mean change over 1 year in neutrophil % was an increase of 3.5%.
Conclusions: Sputum neutrophil measurements in COPD are associated weakly with FEV
1
% predicted and health
status. Sputum neutrophil measurements were dissociated from exacerbation rates, emphysema and systemic
inflammation.
Introduction
Chronic obstructive pulmonary disease (COPD) is a pro-
gressive inflammatory airway disease, the most impor-
tant cause of which is cigarette smoking. COPD is
characterised by persistent and progressive airway
inflammation [1]. The standard method for classifying
disease severity is the measurement of forced expiratory
volume in 1 second (FEV
1
) [2]. However, there is a need
for biomarkers that are reflective of the inflammatory
mechanisms involved in disease pathogenesis [3]. Such
biomarkers may be useful for monitoring disease pro-
gression, evaluating the effects of therapeutic interven-
tions or identifying disease sub-phenotypes with different
clinical characteristics.
A hallmark feature of COPD is the increased numbers
of pulmonary neutrophils that can secrete a wide range of
pro-inflammatory cytokines and chemokines [1,4,5], as
well as proteases that play a role in the development of
emphysema. Induced sputum is a non-invasive method
that allows evaluation of neutrophil numbers in the air-
way lumen [6]. The measurement of induced sputum
neutrophils fulfils some of the ideal characteristics of a
biomarker in COPD; neutrophils are thought to be mech-
anistically involved in disease pathophysiology [7], can be
easily measured in the target organ using a non-invasive
method, and are increased in patients with COPD com-
pared to controls [4,5]. There is a need to conduct large
cohort studies to further explore the potential utility of
this biomarker in COPD patients.
Systemic manifestations such as muscle wasting and
cardiovascular disease are common in COPD patients.
The relationship between pulmonary and systemic dis-
ease is not fully understood. Mechanisms that may cause
* Correspondence:
1
University of Manchester, Medicines Evaluation Unit, South Manchester
University Hospitals Trust, Southmoor Road, Manchester M23 9QZ, UK
Full list of author information is available at the end of the article
Singh et al. Respiratory Research 2010, 11:77
/>Page 2 of 12
systemic manifestations include; reduced efficiency of
pulmonary gas exchange leading to systemic hypoxia, the
systemic absorption of inhaled toxins from cigarette
smoke, genetic predisposition to systemic inflammation
[8] and a "spill over" of airway inflammation into the sys-
temic circulation [9,10]. If the "spill over" hypothesis is
true, one might expect induced sputum neutrophil
counts to be associated with systemic measurements of
inflammation such as neutrophil numbers in the systemic
circulation; a relationship would be suggestive of a
"global" activation of neutrophils in COPD patients.
In this analysis we have measured induced sputum neu-
trophils levels in COPD subjects participating in The
Evaluation of COPD Longitudinally to Identify Predictive
Surrogate Endpoints (ECLIPSE) cohort [11], with the aim
of furthering our understanding of the value of this bio-
marker in COPD. This paper reports an assessment of the
relationships between induced sputum neutrophil counts
and FEV
1
, health status, exacerbation rates, systemic
inflammation and CT scan quantification of emphysema.
Furthermore, we present longitudinal analysis of the
change in sputum neutrophil measurements after 1 year
to provide an estimate of long term variability.
Methods
Subjects
The design of the ECLIPSE cohort study (SCO104960,
NCT00292552) has been described elsewhere [11].
Briefly, ECLIPSE is a 3-year multicentre longitudinal pro-
spective study to identify novel endpoints in COPD. Spu-
tum induction was performed in a subset of patients
recruited at 14 sites as follows; Lebanon, Denver, Omaha
and Hartford (all USA), Halifax, Sainte-Foy, Montreal and
Hamilton (all Canada), Bergen (Norway), Edinburgh, Liv-
erpool and Manchester (all United Kingdom), Horn
(Netherlands) and Wellington (New Zealand). Inclusion
criteria were age 40-75 years, smoking history of > 10
pack-years, a post-bronchodilator ratio between forced
expiratory volume in 1 s (FEV
1
) and forced vital capacity
(FVC) < 0.7 and FEV
1
< 80%. Smoking (>10 pack-years)
and non-smoking (<1 pack-year) control subjects were
enrolled if they were aged 40-75 years and had normal
lung function. This study was ethically approved and all
participants provided written informed consent.
Sputum Induction and Processing
The same induction and processing procedure was used
at all 14 sites; all site staff received training in these meth-
ods. Sputum samples were obtained at the start of the
study (baseline) and after 1 year. Sputum induction was
performed using 3% saline given as 3 nebulisations each
lasting for 7 minutes. Selected sputum was weighed, and
samples greater than 0.15 g were mixed with 0.1% DTT
on ice in a ratio of 4:1 and processed as previously
described to obtain a cell pellet [12]. The cell pellet was
re-suspended in cold PBS so that a cell count could be
performed using trypan blue to assess the number of via-
ble cells. A cytopsin slide was prepared for differential
count. Cytospin preparations were air dried, fixed with
methanol and stained with Rapi-diff (Triangle, Skelmers-
dale, UK). All slides were read independently by two
readers, who were blinded to clinical details. Each reader
scored 500 cells. This was used to determine the percent-
age of squamous cells as a measure of sputum quality.
Samples with <30% squamous cells were scored as
acceptable, 30-60% as fair and >61% as inadequate. After
this, additional cells were counted so that a total of 500
non-squamous cells were counted. Agreement for the
reads was determined by comparing the differential
counts, which had to vary by less than 10% for the cell
types averaged. In the event the counts differed, slides
were read by a third reader. The results were expressed as
a percentage of the total non-squamous count, and a total
cell count/ml of sputum.
Blood biomarker measurements
Whole blood was collected in Vacutainer tubes. Auto-
mated neutrophil counts were provided by Quest Diag-
nostics Clinical Trials (Van Nuys, CA USA). Serum was
prepared by centrifugation at 1500 g for 15 minutes. The
serum was collected and stored at -80°C until analyzed.
Serum concentrations of interleukin-6 (IL-6), and IL-8
were determined by validated multiplexed immunoassays
(SearchLight Array Technology, Thermo Fisher Scien-
tific, Rockford, IL, USA). The limits of quantification for
IL-6 and IL-8 were 0.4 pg/ml, and 0.8 pg/ml respectively.
Serum surfactant protein D (SP-D) was measured using a
colorimetric sandwich immunoassay method (BioVendor
GmbH, Heidelberg, Germany) according to the manufac-
turer's instructions. The assay had a validated range of
1.56 to 100 ng/mL. A high sensitivity, sandwich enzyme-
linked immunoassay (SearchLight Protein Array Tech-
nology, Aushon Biosystems, Inc., Billerica, MA USA) was
used to measure CRP. Serum samples were diluted 500-
to 10,000-fold for analysis. The lower limit of quantifica-
tion was 6 ng/ml.
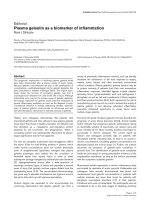
Figure 1 Sputum neutrophil % shown according to GOLD stage
at baseline and year 1. Medians (lines), interquartile ranges (boxes)
and ranges (error bars) are shown.
1 Year
Screening
20 40 60 80 100
n=180
n=141
n=38
n=102
n=58
Stage II
Stage III
Stage IV
n=20
Stage II
Stage III
Stage IV
Singh et al. Respiratory Research 2010, 11:77
/>Page 3 of 12
Table 1: Demographic characteristics and induced sputum cell counts.
Characteristic Baseline (n = 359) Year 1 (n = 297)
Age (y) 63.6 (6.86) 63.4 (6.53)
Gender, Male/Female 225 (63%)/134 (37%) 198 (67%)/99 (33%)
Current/Former Smokers 148 (41%)/211 (59%) 120 (40%)/177 (60%)
Number of pack years smoked 49.2 (28.07) 49.4 (27.97)
Inhaled steroid users 269 (75%) 227 (76%)
Long acting beta-agonist users 279 (78%) 244 (82%)
Long acting anticholinergic users 284 (79%) 243 (82%)
Post bronchodilator FEV1 % predicted 50.2 (15.46) 50.0 (15.94)
Post bronchodilator FEV1 (L) 1.368 (0.49) 1.396 (0.52)
Post bronchodilator FEV1/FVC ratio (%) 44.5 (11.91) 45.8 (11.94)
GOLD Stage II 180 (50%) 154 (52%)
GOLD Stage III 141 (39%) 110 (37%)
GOLD Stage IV 38 (11%) 33 (11%)
Sputum TCC (×10^6/ml) 2.92 (4.92) 3.32 (5.50)
Sputum Neutrophil TCC (×10^6/ml) 2.51 (4.59) 2.89 (5.24)
Sputum Macrophage TCC (×10^6/ml) 0.33 (0.42) 0.35 (0.53)
Sputum Eosinophil TCC (×10^6/ml) 0.028 (0.10) 0.035 (0.13)
Sputum Lymphocyte TCC (×10^6/ml) 0.018 (0.04) 0.015 (0.03)
Sputum Neutrophil % 78.9 (16.4) 82.5 (15.0)
Sputum Macrophage % 16.9 (14.4) 13.9 (13.1)
Sputum Eosinophil % 1.3 (2.6) 1.3 (4.1)
Sputum Lymphocyte % 0.7 (0.8) 0.5 (0.8)
Sputum Epithelial % 2.1 (4.51) 1.7 (3.13)
Data from subjects who produced evaluable sputum samples are shown. Data is mean (SD) or number of subjects (% of subjects) where
indicated. Total cell count data was available for n = 293 at baseline and n = 255 at year 1.
Singh et al. Respiratory Research 2010, 11:77
/>Page 4 of 12
Exacerbations
Exacerbations were defined as worsening symptoms of
COPD and classified as either moderate (requiring treat-
ment with antibiotics or oral corticosteroids) or severe
(requiring in-patient hospitalization). At baseline, the
patients were asked about the frequency of exacerbations
in the previous year. The number of exacerbations during
the year after the baseline visit was recorded at clinic vis-
its at 3, 6 and 12 months, and by monthly telephone calls.
Sputum samples were not collected within 4 weeks of an
exacerbation.
Health status
Health status was measured using the St Georges Respi-
ratory Questionairre for COPD (SGRQ-C).
Table 3: Linear and multivariate analysis of relationship between post-bronchodilator FEV
1
% predicted and sputum
sputum neutrophil percentage at 1 year.
Linear Regression Multiple Regression
Independent Variables in Model Estimate(SE) p-value R-square Estimate(SE) p-value R-square
Age -0.198 (0.137) 0.150 0.007 0.008 (0.129) 0.950 0.209
BMI 0.335 (0.158) 0.034 0.015 0.430 (0.151) 0.005
Concomitant ICS use 8.241 (2.070) <0.001 0.051 8.075 (1.960) <0.001
Current smoking status 2.486 (1.823) 0.174 0.006 0.959 (1.780) 0.590
Pack years -0.056 (0.032) 0.082 0.010 -0.036 (0.030) 0.230
Gender 7.052 (1.858) <0.001 0.047 7.588 (1.780) <0.001
Sputum neutrophil % -0.316 (0.057) <0.001 0.094 -0.272 (0.056) <0.001
Other independent variables were included in this analysis as shown.
Table 2: Linear and multivariate analysis of relationship between post-bronchodilator FEV
1
% predicted and sputum
neutrophil percentage at the baseline visit.
Linear Regression Multiple Regression
Independent Variables in Model Estimate(SE) p-value R-square Estimate(SE) p-value R-square
Age 0.095 (0.119) 0.425 0.002 0.197 (0.118) 0.097 0.139
BMI 0.341 (0.141) 0.016 0.016 0.381 (0.140) 0.007
Concomitant ICS use 5.047 (1.873) 0.007 0.020 6.759 (1.806) <0.001
Current smoking status 1.216 (1.658) 0.464 0.002 1.255 (1.689) 0.458
Pack years -0.015 (0.029) 0.602 0.001 0.001 (0.029) 0.976
Gender 7.904 (1.636) <0.001 0.061 8.785 (1.634) <0.001
Sputum neutrophil % -0.147 (0.049) 0.003 0.025 -0.127 (0.048) 0.009
Other independent variables were included in this analysis as shown.
Singh et al. Respiratory Research 2010, 11:77
/>Page 5 of 12
CT Scan
All subjects underwent a low-dose CT scan of the chest
at the baseline visit to exclude non-COPD-related disease
and to evaluate the degree of emphysema [13]. The CT
scans were evaluated at the central imaging unit at the
University of British Columbia, Vancouver. Emphysema
was assessed by the percentage of the lung with attenua-
tion below -950 HU using the Pulmonary Workstation
2.0 software (VIDA Diagnostics, Iowa City, IA, USA).
Statistical Analyses
In order to assess the relationship between clinical mea-
surements (pulmonary function, emphysema, and health
status) and sputum neutrophils, univariate and multivari-
ate linear regression analyses were conducted. Sputum
neutrophils were analysed as percentages and log-trans-
formed counts. The rate of exacerbations over the follow-
ing year was analysed by negative binomial regression.
Robust standard errors for the model coefficients were
determined by generalised estimating equations . An off-
set variable based on the log of the number of days on
study was included in the model. Covariates in the regres-
sion models included age, gender, body mass index
(BMI), concomitant ICS use, smoking history (current or
former smoking and pack years), prior exacerbations, and
FEV1 % predicted. Spearman correlations were calculated
to investigate the association between blood and sputum
neutrophils and systemic biomarkers. Bland-Altman
plots were constructed to evaluate the repeatability of
sputum neutrophil % and neutrophil number/ml over
time. To compare the limits of agreement between % and
number/ml, the data were log transformed before calcu-
lating the limits of agreement. These data were then
back-transformed to express the limits of agreements as
ratios. SAS
®
Version 9.1 was used to carry out all analyses.
Power curves were generated for change in sputum neu-
trophil percentage based on a 2 sample t-test with alpha
level 0.05 and standard deviation 14.4%.
Results
Sputum neutrophils: relationship with pulmonary function
Sputum induction was performed on a total of 538 sub-
jects; 416 subjects at baseline and 346 subjects at year 1.
The number of subjects recruited per site varied from 12
to 164 of the 538 subjects. The rate of successful sputum
inductions was >50% at every site. Evaluable sputum sam-
ples (defined as weight greater than 0.15 g plus sufficient
cells to produce cytospin slides) were obtained from 488
subjects, including 168 subjects who produced an evalu-
able sample at both visits. In total, 359 subjects produced
an evaluable sample at baseline, and 297 subjects after 1
year. The demography is shown in table 1; approximately
Table 4: Linear and multivariate analysis of relationship between SGRQ score and sputum neutrophil percentage at the
baseline visit.
Linear Regression Multiple Regression
Independent Variables in Model Estimate(SE) p-value R-square Estimate(SE) p-value R-square
Age -0.453 (0.148) 0.002 0.026 -0.471 (0.147) 0.001 0.179
BMI 0.387 (0.176) 0.028 0.014 0.428 (0.174) 0.014
Concomitant ICS use -6.813 (2.333) 0.004 0.024 -2.666 (2.293) 0.246
Current smoking status -1.941 (2.077) 0.351 0.003 -1.062 (2.089) 0.611
Pack years 0.051 (0.036) 0.163 0.006 0.086 (0.035) 0.014
Number of prior exacerbations 2.973 (0.649) <0.001 0.057 1.923 (0.651) 0.003
FEV
1
% predicted -0.328 (0.065) <0.001 0.069 -0.307 (0.068) <0.001
Gender 1.571 (2.115) 0.458 0.002 4.083 (2.121) 0.055
Sputum neutrophil % 0.113 (0.063) 0.077 0.009 0.130 (0.061) 0.035
Other independent variables were included in this analysis as shown. Post-bronchodilator FEV
1
was used.
Singh et al. Respiratory Research 2010, 11:77
/>Page 6 of 12
half of the subjects were GOLD stage 2, with the remain-
ing subjects being GOLD stage 3 or 4.
The mean squamous cell percentages at baseline and
year 1 were 11.7% (SD 15.2%) and 12.3% (SD 16.3%)
respectively. The sputum cell differential counts
expressed as a percentage of the non-squamous cell count
for all subjects are shown in table 1. The majority of sub-
jects had a total cell count recorded (293 at baseline and
255 at year 1; due to an error, the total cell count was not
recorded for the remaining subjects). The sputum neu-
trophil % increased numerically with the GOLD staging
of disease severity in both the baseline and year 1 samples
- see figure 1. This figure shows the wide range of mea-
surements obtained from different subjects. Univariate
analysis (tables 2 and 3) showed that the associations
between FEV
1
% predicted and sputum neutrophil % were
weak but statistically significant (r2 = 0.025, p = 0.003 and
0.094, p < 0.001 at baseline and year 1 respectively) and
remained statistically significant after adjustment by mul-
tivariate regression (p = 0.009 and p < 0.001 respectively).
Similarly weak, but significant, associations with FEV
1
were observed for gender (a higher FEV
1
% predicted was
associated with female gender), BMI and ICS use (a
higher FEV
1
% predicted was associated with a higher
BMI and no concomitant ICS use). Multivariate analysis
showed no association between sputum neutrophil num-
ber/ml and FEV
1
at baseline or year 1 (p = 0.64 and p =
0.19, respectively).
For the 359 subjects with induced sputum samples at
baseline, there was a small decline in FEV
1
after 1 year of
23.0 mL (p = 0.025). Neither sputum neutrophil percent-
age nor cell numbers at baseline was associated with the
change in FEV
1
over 1 year (p = 0.71 and 0.33 respectively
by multivariate analysis including age, gender, BMI, ICS
use, smoking history, number of exacerbations and FEV
1
% predicted at baseline as independent variables).
Sputum neutrophils: relationship with emphysema
There was a weak association between sputum neutro-
phil % and the degree of emphysema as measured by
%LAA (r2 = 0.04, p < 0.001 and r2 = 0.09, p = <0.001
respectively at baseline and year 1) by univariate analysis.
However, these associations did not persist after adjust-
ment for age, gender, BMI, concomitant ICS use, smoking
history, and FEV1 % predicted (p = 0.26 and p = 0.08 at
baseline and year 1 respectively).
Sputum neutrophils: relationship with health status
Univariate analysis (tables 4 and 5) showed a very weak
association between sputum neutrophil % and the SGRQ-
C score at baseline (r2 = 0.009, p = 0.077). After adjust-
Table 5: Linear and multivariate analysis of relationship between SGRQ score and sputum neutrophil percentage at year 1.
Linear Regression Multiple Regression
Independent Variables in Model Estimate(SE) p-value R-square Estimate(SE) p-value R-square
Age -0.174 (0.185) 0.348 0.003 -0.282 (0.175) 0.108 0.208
BMI 0.244 (0.213) 0.252 0.004 0.391 (0.207) 0.060
Concomitant ICS use -9.516 (2.814) <0.001 0.038 -3.751 (2.803) 0.182
Current smoking status -3.060 (2.454) 0.214 0.005 -1.049 (2.403) 0.663
Number of exacerbations during year 1 3.936 (0.666) <0.001 0.107 3.230 (0.683) <0.001
Pack years 0.146 (0.042) <0.001 0.039 0.157 (0.040) <0.001
FEV
1
% predicted -0.320 (0.076) <0.001 0.057 -0.190 (0.081) 0.020
Gender 0.633 (2.565) 0.805 0.000 3.038 (2.490) 0.223
Sputum neutrophil % 0.205 (0.080) 0.011 0.022 0.138 (0.078) 0.079
Other independent variables were included in this analysis as shown. Post-bronchodilator FEV
1
was used.
Singh et al. Respiratory Research 2010, 11:77
/>Page 7 of 12
ment, sputum neutrophil % was positively associated
with SGRQ-C (p = 0.035). At year 1, this association was
significant by univariate linear regression (r2 = 0.022, p =
0.011) but did not reach statistical significance upon
adjustment (p = 0.079). Multivariate analysis showed no
association between sputum neutrophil count/ml and
SGRQ-C at baseline or year 1 (p = 0.1 and p = 0.2, respec-
tively).
Sputum neutrophils: relationship to exacerbations
A total of 496 exacerbations (415 moderate, and 81
severe) were recorded during the 1 year follow up period.
Negative binomial regression (tables 6 and 7) showed no
relationship between sputum neutrophil % (p = 0.13) or
neutrophil number (p = 0.72) at baseline and the number
of exacerbations in the following year.
Relationship between blood and sputum neutrophils
There was no relationship between blood and sputum
neutrophils at baseline, whether expressed as a percent-
age (r2 = 0.004, p = 0.27) or absolute numbers/ml (r2 =
0.002, p = 0.47). At year 1, there was no relationship
between blood and sputum neutrophil percentages (r2 =
0.01, p = 0.076), although a very weak association was
observed between blood and sputum neutrophil num-
bers/ml (r = 0.017, p = 0.044).
Neutrophils and systemic biomarkers
Table 8 shows the relationships between neutrophil mea-
surements in sputum and blood and systemic biomarkers
at baseline. Weak associations were observed between
induced sputum neutrophil percentage and serum IL-8
(r2 = 0.02, p = 0.019), and induced sputum neutrophil
number/ml and serum SP-D (r2 = 0.02, p = 0.016). Blood
neutrophil absolute numbers and percentages were
weakly associated with serum IL-6, while neutrophil
numbers were weakly associated with serum CRP.
Longitudinal analysis of induced sputum neutrophil
measurements
Bland Altman plots for sputum percentage and numbers/
ml at baseline and 1 year are shown in Figure 2. For per-
centages, the mean change was a 3.5% increase at year 1
compared to baseline, with limits of agreement at 32.3%
to -25.4%. The changes between repeated measurements
at baseline and 1 year were smaller for samples with
higher neutrophil %, with most variability observed at
lower neutrophil %. The same pattern was observed for
neutrophil numbers/ml. Greater variability was observed
for neutrophil numbers/ml, as the limits of agreement
showed that a repeated measurement can be between
0.003 and 518.7 times the initial measurement. In con-
trast, for neutrophil %, the ratios lie between 0.61 and
1.50 times the initial measurement.
Table 6: Negative binomial regression analysis of relationship between exacerbation rates over the one year follow up
period and sputum neutrophil percentage at baseline.
Single Dependent Multiple Dependents
Independent Variables in Model Incidence
Rate Ratio
95% CI p-value Incidence
Rate Ratio
95% CI p-value
Age 0.99 (0.98,1.00) 0.173 0.99 (0.98,1.01) 0.370
BMI 1.00 (0.97,1.03) 0.862 1.00 (0.97,1.02) 0.817
Concomitant ICS use 2.02 (1.47,2.76) <0.001 1.75 (1.29,2.37) <0.001
Current smoking status 0.98 (0.76,1.28) 0.903 0.94 (0.73,1.20) 0.605
Pack years 1.00 (0.99,1.00) 0.732 1.00 (1.00,1.01) 0.817
FEV
1
% predicted 0.98 (0.97,0.99) <0.001 0.98 (0.97,0.99) <0.001
Gender 1.17 (0.90,1.52) 0.237 1.38 (1.06,1.81) 0.017
Sputum neutrophil % 1.00 (0.99,1.01) 0.568 0.99 (0.99,1.00) 0.127
Other independent variables were included in this analysis as shown. Post-bronchodilator FEV
1
was used.
Singh et al. Respiratory Research 2010, 11:77
/>Page 8 of 12
The within subject standard deviation for sputum neu-
trophils % was 14.4%. From these data, power curves for
future studies with the change in induced sputum neutro-
phils as an endpoint in an interventional or observational
trial in patients with COPD were constructed - see Figure
3.
Discussion
Neutrophils are thought to play a role in pulmonary
inflammation in COPD [7]. Induced sputum neutrophil
counts are raised in COPD patients compared to controls
[4,5], suggesting that this measurement has potential as a
biomarker of airway inflammation in COPD. We have
Table 8: Univariate associations between serum biomarkers and neutrophil total counts and % in blood and sputum.
No of
subjects
Median
(IQR)
Blood neutrophils Sputum neutrophils
Total Count % Total count/ml %
C-RP
mg/L
134 6.3 (11.0) r2 = 0.05 ; p = 0.011 NS NS r2 = 0.02; p = 0.070
IL-6
pg/ml
331 1.9 (4.3) r2 = 0.03; p = 0.001 r2 = 0.03; p = 0.001 NS NS
IL-8
pg/ml
332 7.7 (7.6) NS NS NS r2 = 0.02; p = 0.019
SP-D
ng/ml
279 126.7 (90.6) NS NS r2 = 0.02; p = 0.016 NS
IQR = interquartile range. NS = statistically non-significant
Table 7: Negative binomial regression analysis of relationship between exacerbation rates over the one year follow up
period and sputum neutrophil number/ml at baseline.
Single Dependent Multiple Dependents
Independent Variables in Model Incidence
Rate Ratio
95% CI p-value Incidence
Rate Ratio
95% CI p-value
Age 1.00 (0.98,1.01) 0.549 1.00 (0.98,1.02) 0.911
BMI 1.00 (0.96,1.03) 0.815 1.00 (0.97,1.03) 0.825
Concomitant ICS use 2.13 (1.46,3.12) <0.001 1.77 (1.21,2.58) 0.003
Current smoking status 0.90 (0.67,1.20) 0.470 0.91 (0.69,1.21) 0.520
Log sputum neutrophil number/ml 1.00 (0.95,1.06) 0.951 0.99 (0.94,1.04) 0.724
Pack years 1.00 (0.99,1.00) 0.857 1.00 (0.99,1.01) 0.974
FEV
1
% predicted 0.98 (0.97,0.99) <0.001 0.98 (0.97,0.99) <0.001
Gender 1.18 (0.88,1.57) 0.268 1.46 (1.08,1.98) 0.015
Other independent variables were included in this analysis as shown. Post-bronchodilator FEV
1
was used.
Singh et al. Respiratory Research 2010, 11:77
/>Page 9 of 12
investigated the characteristics of this biomarker in a
large group of COPD patients. The wide range of sputum
neutrophil measurements was indicative of the degree of
between subject variation. Sputum neutrophil measure-
ments were very weakly associated with FEV
1
% predicted
and SGRQ-C scores. Sputum neutrophil measurements
did not predict the change in FEV
1
after 1 year, or the rate
of exacerbations, and were not related to the degree of
emphysema. Additionally, we found little evidence of any
association between sputum neutrophils and biomarkers
of inflammation in the systemic circulation, including
blood neutrophil counts, CRP and SP-D.
Our findings raise the question; what is the value of
sputum neutrophil measurements in COPD ? There is a
need for biomarkers of airway inflammation in COPD
patients [3]; for example in clinical trials of anti-inflam-
matory interventions or in longitudinal observational
studies of the natural course of the disease. Sputum neu-
trophil levels are characteristically raised in COPD
patients [4,5], but this measurement of airway inflamma-
tion is only very weakly associated with FEV
1
and health
status. Our results suggest that measuring sputum neu-
trophils in COPD patients is principally a tool to assess
the burden of airway inflammation; it is not a major sur-
rogate of the other clinical and pathophysiological abnor-
malities measured in this study.
Generally, any weak but significant associations
between clinical parameters and sputum neutrophils
were observed for percentages and not numbers/ml.
Neutrophil numbers/ml also displayed a high degree of
variability over 1 year, and so appear to be less informa-
tive than the measurement of neutrophil % in COPD
patients.
A previous study in 44 COPD patients showed a statis-
tically significant relationship (p < 0.001) between FEV
1
%
predicted and sputum neutrophil percentage; the r value
Figure 2 Bland Altman plots of the mean measurements at baseline and 1 year (x-axis) and the difference between the measurements
(year 1 - baseline shown on y-axis) for (a) log10 sputum neutrophil numbers/ml and (b) sputum neutrophil % counts.
-8
-6
-4
-2
0
2
4
6
8
02468
Mean of Screening and Year 1
Difference between Screening and
Year 1
a
-60
-40
-20
0
20
40
60
0 20406080100120
Mean of Screening and Year 1
Difference between Screening and
Year 1
b
Singh et al. Respiratory Research 2010, 11:77
/>Page 10 of 12
was reported as -0.54, hence r2 = 0.29 [14]. This is a weak
relationship, and the current study in much larger num-
bers of subjects showed an extremely weak relationship
(r2 < 0.1) that again was statistically significant (p < 0.001
at both baseline and year 1). This suggests that sputum
neutrophil numbers play only a very minor role as a pre-
dictor of the degree of airflow obstruction in COPD
patients. Supporting evidence for this observation comes
from studies using principal component analysis that
have shown induced sputum neutrophil measurements to
be dissociated from pulmonary function measurements
[15,16]. While it is known that the number of neutrophils
in walls of the small airways are related to the severity of
airflow obstruction [1], our findings and previous studies
indicate that this relationship is very weak for measure-
ments of the number of neutrophils in the airway lumen.
A biomarker that could predict the rate of lung function
decline in COPD would be of great clinical usefulness. It
has previously been reported in a limited number of
COPD patients (n = 45) that the total neutrophil number/
gram sputum is related to the subsequent decline in pul-
monary function over 7 years, although no analysis for
neutrophil % was presented [17]. Additionally, a study in
38 smokers showed that lung function decline over 15
years was associated with sputum neutrophil percentage
[18]. It should be noted that the sputum samples were
obtained retrospectively at the end of the 15 year period.
Consequently, this was not a prospective study evaluating
whether sputum neutrophils are a biomarker of subse-
quent lung function decline. Our study had a much larger
number of patients (n = 359), than these previous studies
[17,18] but a shorter follow up period (1 year). The
decline in FEV
1
was 23 mls over this follow up period.
This is a rate of decline that is less than might be expected
in a COPD population and may reflect a Hawthorne
effect i.e. the rate of decline in these patients has been
reduced simply by inclusion in a clinical study. Addition-
ally, it is likely that a 1 year follow up in this population
was insufficient to properly study longitudinal decline.
There was no relationship between baseline neutrophil
numbers or percentage and the change in FEV
1
over this
time period. The ECLIPSE study will run for at least 3
years [11], and it will be of interest to observe if sputum
neutrophil measurements can predict FEV
1
decline over a
longer time period.
Neutrophils are known to be involved in the pathogen-
esis of emphysema, through the secretion of proteases
such as neutrophil elastase [7,19]. Other important fac-
tors involved in the pathogenesis of emphysema include
protease production by other cell types such as mac-
rophages, and the degree of anti-protease activity [19].
We observed no association using multivariate analysis
between sputum neutrophil counts and the degree of
emphysema measured by HRCT. This negative finding
suggests that the sputum neutrophil number is not reflec-
tive of the protease/anti-protease balance, which may not
be surprising as the number of neutrophils does not
inform us about overall protease and anti-protease levels
in the lungs. A previous study in smaller numbers of
COPD patients has also reported no association between
sputum neutrophils and HRCT quantification of emphy-
sema [20].
It is known that sputum neutrophil numbers are raised
in COPD exacerbations [21,22]. We were able to test
whether sputum neutrophil measurements during the
stable state are predictive of the future rate of exacerba-
tions, but found no evidence to support this hypothesis. It
is known that a subset of COPD patients suffer with more
frequent exacerbations, which is associated with a faster
decline in lung function [23]. It is possible that these fre-
quent exacerbators have increased levels of airway
inflammation even during the stable state between exac-
erbations, but in our study population any such increase
was not detectable by measuring sputum neutrophils.
The factors that impact quality of life in COPD are not
well understood, and it is possible that the degree of air-
way inflammation is a contributor. A previous study
showed a weak association between sputum macrophage
numbers and SGRQ-C, but no relationship to sputum
neutrophil numbers [24]. The current study had a larger
sample size, but still observed a very weak relationship
between SGRQ-C scores and sputum neutrophils. Other
weak predictors of SGRQ-C score were the number of
previous exacerbations, smoking history and FEV
1
% pre-
dicted. This analysis underscores the multicomponent
nature of COPD, with quality of life being determined by
a range of different clinical and pathophysiological fac-
tors.
It has been proposed that systemic inflammation in
COPD is a "spill-over" of inflammation from the lungs
Figure 3 Power calculations for a reduction in sputum neutrophil
% in a parallel group study. Y axis is the number of subjects required.
X axis is the effect size (e.g. 0.9 = 10% reduction).
0
50
100
150
200
250
300
350
400
450
0 0.1 0.2 0.3 0.4 0.5 0.6 0.7 0.8 0.9 1
Effect Size
N
Power=0.80 Power=0.90 Power=0.95
Singh et al. Respiratory Research 2010, 11:77
/>Page 11 of 12
[9,10]. Alternatively, systemic and pulmonary inflamma-
tion in COPD may arise due to distinct mechanisms. We
observed no consistent relationship between sputum and
blood neutrophil numbers or percentages. This argues
against any common mechanisms controlling neutrophil
recruitment into these separate compartments. Similarly,
we found no strong relationships between sputum neu-
trophils and systemic biomarkers of inflammation. It
appears that the degree of systemic inflammation in
COPD is independent of the level of airway neutrophils.
There are multiple mechanisms by which neutrophils
may be recruited into the airways. Thus, it is a reasonable
conjecture that similar numbers of neutrophils present in
the airways of different COPD patients may reflect differ-
ent pathophysiological processes. This is consistent with
the recognised clinical heterogeneity of COPD.
The mean change in sputum neutrophil percentages
over 1 year was only 3.5%, suggesting good reproducibil-
ity. However, the limits of agreement, which define the
level of variability that can be expected from a repeated
measurement in an individual, were approximately 30%.
The most variability was observed in samples with a low
neutrophil percentage, which suggests that a low neutro-
phil is often a transient phenomenon, and that repeated
measurements "regress to the mean" which is a higher
value.
The longitudinal assessment of change at 1 year can be
used to design future long term observational studies or
therapeutic trials in COPD. Previous studies with repeat
sputum measurements have been of shorter duration,
usually 3 months or less [25,26]. Our finding that the
mean change in sputum neutrophil percentage was 3.5%
can be used to guide the natural variability in this mea-
surement that can be expected over 1 year, and this varia-
tion appears to be greatest for individual subjects with
lower neutrophil percentage counts. The power calcula-
tions presented can be used for future clinical trials; for
example, to detect a difference of 10 percentage points in
mean sputum neutrophil % between two groups with 80%
power would require 34 subjects per treatment arm
based on a two-sample t-test and alpha level 0.05. As spu-
tum neutrophils appear to be only weakly associated with
clinical parameters such as FEV
1
, exacerbation rates and
quality of life, it is unclear at present whether reducing
sputum neutrophil numbers would actually produce a
clinical benefit in COPD patients. The data provided in
this paper shows the sample size that is required to be
able to show that a novel therapeutic intervention, such
as an inhibitor of neutrophil chemotaxis [27], can reduce
airway neutrophil numbers in COPD. The possible clini-
cal benefits of this type of approach remain unclear.
A strength of the current study is its size and multi-
centre design. All studies, including ECLIPSE, that have
evaluated induced sputum in COPD to date have
recruited "convenience" samples. Thus it is likely that all
studies to date have assessed populations that reflect
some degree of selection bias. The current study, which
recruited a large number of subjects from 14 sites is likely
to have recruited a more heterogeneous sample of COPD
patients than studies conducted at single centres with
smaller numbers of subjects.
In conclusion, sputum neutrophil counts do not appear
to be a major surrogate of other clinical or pathophysi-
ologal abnormalities in COPD. The value of this bio-
marker in COPD appears to be principally as a tool for
measuring the burden of neutrophils in the airways.
Competing interests
DS has received lectures fees, support for conference attendance, advisory
board fees and research grants from a range of pharmaceutical companies
including GSK, Chiesi Pharmaceuticals, AstraZeneca, CIPLA, Novartis. Forest,
MSD, Boehringer and Allmiral
LE and RT are employees of GSK
SR has consulted or participated in advisory boards for: Able Associates, Adel-
phia Research, Almirall/Prescott, APT Pharma/Britnall, Aradigm, AstraZeneca,
Boehringer Ingelheim, Chiesi, CommonHealth, Consult Complete, COPDFo-
rum, DataMonitor, Decision Resources, Defined Health, Dey, Dunn Group,
Eaton Associates, Equinox, Gerson, GlaxoSmithKline, Infomed, KOL Connection,
M. Pankove, MedaCorp, MDRx Financial, Mpex, Novartis, Nycomed, Oriel Thera-
peutics, Otsuka, Pennside Partners, Pfizer (Varenicline), PharmaVentures, Phar-
maxis, Price Waterhouse, Propagate, Pulmatrix, Reckner Associates, Recruiting
Resources, Roche, Schlesinger Medical, Scimed, Sudler and Hennessey, Targe-
Gen, Theravance, UBC, Uptake Medical, VantagePoint Management. SR has
given lectures for: American Thoracic Society, AstraZeneca, Boehringer
Ingelheim, California Allergy Society, Creative Educational Concept, France
Foundation, Information TV, Network for Continuing Ed, Novartis, Pfizer, SOMA.
SR has received industry-sponsored grants from: AstraZeneca, Biomarck, Cen-
tocor, Mpex, Nabi, Novartis, Otsuka.
Authors' contributions
DS was involved in study design and data interpretation, and drafted the man-
uscript. LE was the lead for statistical analysis. RT was involved in study design
and data interpretation. SR was involved in study design and data interpreta-
tion
All authors have read and approved the final manuscript.
Acknowledgements
We acknowledge the contribution of the ECLIPSE investigators. We acknowl-
edge the technical contribution of Amy Nelson ( University of Nebraska Medi-
cal Center, Omaha, NB, United States) and Jianhong Sun (University of
Nebraska Medical Center, Omaha, NB, United States for sputum cell counts,
and Bruce Miller (GlaxoSmithKline) for the coordination of systemic biomarkers
analysis. The ECLIPSE Study is funded by GlaxoSmithKline.
Author Details
1
University of Manchester, Medicines Evaluation Unit, South Manchester
University Hospitals Trust, Southmoor Road, Manchester M23 9QZ, UK,
2
GlaxoSmithKline, Respiratory Medicine Development Centre, Research
Triangle Park, NC, USA,
3
GlaxoSmithKline, Respiratory Centre for Excellence in
Drug Discovery, King of Prussia, PA, USA and
4
University of Nebraska Medical
Center, Omaha, NB, USA
References
1. Hogg JC, Chu F, Utokaparch S, Woods R, Elliott WM, Buzatu L, Cherniack
RM, Rogers RM, Sciurba FC, Coxson HO, Paré PD: The nature of small-
Received: 16 December 2009 Accepted: 15 June 2010
Published: 15 June 2010
This article is available from: 2010 Singh et al; licensee BioMed Central Ltd. This is an Open Access article distributed under the terms of the Creative Commons Attribution License ( which permits unrestricted use, distribution, and reproduction in any medium, provided the original work is properly cited.Respiratory Research 2010, 11:77
Singh et al. Respiratory Research 2010, 11:77
/>Page 12 of 12
airway obstruction in chronic obstructive pulmonary disease. N Eng J
Med 2004, 350:2645-2652.
2. The Global Initiative for Chronic Obstructive Lung Disease (GOLD)
[]
3. Barnes PJ, Chowdhury B, Kharitonov SA, Magnussen H, Page CP, Postma D,
Saetta M: Pulmonary biomarkers in chronic obstructive pulmonary
disease. Am J Respir Crit Care Med 2006, 174:6-14.
4. O'Donnell RA, Peebles C, Ward JA, Daraker A, Angco G, Broberg P, Pierrou
S, Lund J, Holgate ST, Davies DE, Delany DJ, Wilson SJ, Djukanovic R:
Relationship between peripheral airway dysfunction, airway
obstruction, and neutrophilic inflammation in COPD. Thorax 2004,
59:837-42.
5. Keatings VM, Collins PD, Scott DM, Barnes PJ: Differences in interleukin-8
and tumor necrosis factor-alpha in induced sputum from patients with
chronic obstructive pulmonary disease or asthma. Am J Respir Crit Care
Med 1996, 153:530-4.
6. Rutgers SR, Timens W, Kaufmann HF, van der Mark TW, Koëter GH, Postma
DS: Comparison of induced sputum with bronchial wash,
bronchoalveolar lavage and bronchial biopsies in COPD. Eur Respir J
2000, 15:109-15.
7. Cowburn AS, Condliffe AM, Farahi N, Summers C, Chilvers ER: Advances in
neutrophil biology: clinical implications. Chest 2008, 134:606-12.
8. Yanbaeva DG, Dentener MA, Spruit MA, Houwing-Duistermaat JJ, Kotz D,
Passos VL, Wouters EF: IL6 and CRP haplotypes are associated with
COPD risk and systemic inflammation: a case-control study. BMC Med
Genet 2009, 10:23.
9. Chung KF, Adcock IM: Multifaceted mechanisms in COPD:
inflammation, immunity, and tissue repair and destruction. Eur Respir J
2008, 31:1334-56.
10. Gan WQ, Man SF, Senthilselvan A, Sin DD: Association between chronic
obstructive pulmonary disease and systemic inflammation: a
systematic review and a meta-analysis. Thorax 2004, 59:574-80.
11. Vestbo J, Anderson W, Coxson HO, Crim C, Dawber F, Edwards L, Hagan G,
Knobil K, Lomas DA, MacNee W, Silverman EK, Tal-Singer R: ECLIPSE
investigators. Evaluation of COPD Longitudinally to Identify Predictive
Surrogate End-points (ECLIPSE). Eur Respir J 2008, 31:869-73.
12. Pizzichini E, Pizzichini MM, Efthimiadis A, Evans S, Morris MM, Squillace D,
Gleich GJ, Dolovich J, Hargreave FE: Indices of airway inflammation in
induced sputum: reproducibility and validity of cell and fluid-phase
measurements. Am J Respir Crit Care Med 1996, 154:308-17.
13. Coxson HO, Rogers RM, Whittall KP, D'yachkova Y, Paré PD, Sciurba FC,
Hogg JC: A quantification of the lung surface area in emphysema using
computed tomography. Am J Respir Crit Care Med 1999, 159:851-856.
14. O'Donnell RA, Peebles C, Ward JA, Daraker A, Angco G, Broberg P, Pierrou
S, Lund J, Holgate ST, Davies DE, Delany DJ, Wilson SJ, Djukanovic Rl:
Relationship between peripheral airway dysfunction, airway
obstruction, and neutrophilic inflammation in COPD. Thorax 2004,
59:837-42.
15. Roy K, Smith J, Kolsum U, Borrill Z, Vestbo J, Singh D: COPD phenotype
description using principal components analysis. Respir Res 2009, 10:41.
16. Lapperre TS, Snoeck-Stroband JB, Gosman MM, Stolk J, Sont JK, Jansen DF,
Kerstjens HA, Postma DS, Sterk PJ: Dissociation of lung function and
airway inflammation in chronic obstructive pulmonary disease. Am J
Respir Crit Care Med 2004, 170:499-504.
17. Donaldson GC, Seemungal TA, Patel IS, Bhowmik A, Wilkinson TM, Hurst
JR, Maccallum PK, Wedzicha JA: Airway and systemic inflammation and
decline in lung function in patients with COPD. Chest 2005,
128:1995-2004.
18. Stanescu D, Sanna A, Veriter C, Kostianev S, Calcagni PG, Fabbri LM,
Maestrelli P: Airways obstruction, chronic expectoration, and rapid
decline of FEV1 in smokers are associated with increased levels of
sputum neutrophils. Thorax 1996, 51:267-71.
19. Sharafkhaneh A, Hanania NA, Kim V: Pathogenesis of emphysema: from
the bench to the bedside. Proc Am Thorac Soc 2008, 5:475-7.
20. Boschetto P, Quintavalle S, Zeni E, Leprotti S, Potena A, Ballerin L, Papi A,
Palladini G, Luisetti M, Annovazzi L, Iadarola P, De Rosa E, Fabbri LM, Mapp
CE: Association between markers of emphysema and more severe
chronic obstructive pulmonary disease. Thorax 2006, 61:1037-42.
21. Caramori G, Romagnoli M, Casolari P, Bellettato C, Casoni G, Boschetto P,
Chung KF, Barnes PJ, Adcock IM, Ciaccia A, Fabbri LM, Papi A: Nuclear
localisation of p65 in sputum macrophages but not in sputum
neutrophils during COPD exacerbations. Thorax 2003, 58:348-51.
22. Papi A, Bellettato CM, Braccioni F, Romagnoli M, Casolari P, Caramori G,
Fabbri LM, Johnston SL: Infections and airway inflammation in chronic
obstructive pulmonary disease severe exacerbations. Am J Respir Crit
Care Med 2006, 173:1114-21.
23. Soler-Cataluña JJ, Martínez-García MA, Román Sánchez P, Salcedo E,
Navarro M, Ochando R: Severe acute exacerbations and mortality in
patients with chronic obstructive pulmonary disease. Thorax 2005,
60:925-31.
24. Snoeck-Stroband JB, Postma DS, Lapperre TS, Gosman MM, Thiadens HA,
Kauffman HF, Sont JK, Jansen DF, Sterk PJ: Airway inflammation
contributes to health status in COPD: a cross-sectional study. Respir Res
2006, 7:140.
25. Beeh K, Beier J, Kornmann O, Mander A, Buhl R: Long-term Repeatability
of Induced Sputum Cells and Inflammatory Markers in Stable,
Moderately Severe COPD. Chest 2003, 123:778-83.
26. Brightling C, Monteiro W, Green R, Parker D, Morgan MD, Wardlaw AJ,
Pavord D: Induced sputum and other outcome measures in chronic
obstructive pulmonary disease: safety and repeatability. Respiratory
Medicine 2001, 95:999-1002.
27. Chapman RW, Phillips JE, Hipkin RW, Curran AK, Lundell D, Fine JS: CXCR2
antagonists for the treatment of pulmonary disease. Pharmacol Ther
2009, 121:55-68.
doi: 10.1186/1465-9921-11-77
Cite this article as: Singh et al., Sputum neutrophils as a biomarker in COPD:
findings from the ECLIPSE study Respiratory Research 2010, 11:77