Báo cáo y học: "Regulation of IFN response gene activity during infliximab treatment in rheumatoid arthritis is associated with clinical response to treatment" potx
Bạn đang xem bản rút gọn của tài liệu. Xem và tải ngay bản đầy đủ của tài liệu tại đây (680.77 KB, 10 trang )
van Baarsen et al. Arthritis Research & Therapy 2010, 12:R11
/>Open Access
RESEARCH ARTICLE
© 2010 van Baarsen et al.; licensee BioMed Central Ltd. This is an open access article distributed under the terms of the Creative Com-
mons Attribution License ( which permits unrestricted use, distribution, and reproduc-
tion in any medium, provided the original work is properly cited.
Research article
Regulation of IFN response gene activity during
infliximab treatment in rheumatoid arthritis is
associated with clinical response to treatment
Lisa GM van Baarsen
1,2
, Carla A Wijbrandts
3
, François Rustenburg
1
, Tineke Cantaert
3
, Tineke CTM van der Pouw
Kraan
4
, Dominique L Baeten
3
, Ben AC Dijkmans
5
, Paul P Tak
3
and Cornelis L Verweij*
1,5
Abstract
Introduction: Cross-regulation between TNF and type I IFN has been postulated to play an important role in
autoimmune diseases. Therefore, we determined the effect of TNF blockade in rheumatoid arthritis (RA) on the type I
IFN response gene activity in relation to clinical response.
Methods: Peripheral blood from 33 RA patients was collected in PAXgene tubes before and after the start of infliximab
treatment. In a first group of 15 patients the baseline expression of type I IFN-regulated genes was determined using
cDNA microarrays and compared to levels one month after treatment. The remaining 18 patients were studied as an
independent group for validation using quantitative polymerase chain reaction (qPCR).
Results: Gene expression analysis revealed that anti-TNF antibody treatment induced a significant increase in type I IFN
response gene activity in a subset of RA patients, whereas expression levels remained similar or were slightly decreased
in others. The findings appear clinically relevant since patients with an increased IFN response gene activity after anti-
TNF therapy had a poor clinical outcome. This association was confirmed and extended for an IFN response gene set
consisting of OAS1, LGALS3BP, Mx2, OAS2 and SERPING1 in five EULAR good and five EULAR poor responders, by qPCR.
Conclusions: Regulation of IFN response gene activity upon TNF blockade in RA is not as consistent as previously
described, but varies between patients. The differential changes in IFN response gene activity appear relevant to the
clinical outcome of TNF blockade in RA.
Introduction
Cytokines are key regulators of pathogenic processes in a
variety of inflammatory and autoimmune diseases. Major
roles for both tumor necrosis factor (TNF) and type I
interferon (IFN) have previously been demonstrated.
Type I IFN (IFNα/β) plays an important role in systemic
lupus erythematosus (SLE) [1]. Evidence for the role of
IFN in SLE came from the induction of disease during
IFNα/β treatment and circulating IFN inducers [2,3].
Type I IFN activity in SLE is associated with disease
severity [1]. TNF was the first cytokine convincingly
demonstrated to contribute to chronic inflammation in
several autoimmune diseases, including rheumatoid
arthritis (RA) and Crohn disease [4]. Accordingly, block-
ade of TNF activity has proven to be highly beneficial in
the treatment of these diseases [5,6].
Blockade of TNF reduces the acute-phase reaction and
decreases the local and systemic levels of inflammatory
mediators in patients with RA (reviewed in [7]). However,
the improvement varies between patients, and approxi-
mately 30% of RA patients fail to respond to this therapy.
It has been suggested that TNF suppresses IFNα produc-
tion by inhibiting both the generation of plasmacytoid
dendritic cells (pDCs) and their IFNα secretion [8,9].
Accordingly, it was shown that TNF blockade in sys-
temic-onset juvenile idiopathic arthritis (SoJIA) patients,
which resulted in a poor or fair clinical response [10]. is
associated with a higher expression of IFN response
genes [9]. The in vivo IFN bioactivity was determined by
the measurement of the expression of type I IFN response
genes in the peripheral blood cells. Similar findings were
* Correspondence:
1
Department of Pathology, VU University Medical Center, De Boelelaan 1118,
1081 HZ, Amsterdam, The Netherlands
van Baarsen et al. Arthritis Research & Therapy 2010, 12:R11
/>Page 2 of 10
made for patients with primary Sjögren syndrome (SS)
who were treated with a TNF antagonist [11] in which no
evidence of efficacy of infliximab was observed [12].
Here, the type I IFN bioactivity in the blood was mea-
sured in an indirect manner, based on the use of a bioas-
say in which a serum sample is tested to induce the
expression of IFN response activity.
Since the finding of an increased IFN response gene
activity after TNF blockade was based on studies in dis-
eases in which the clinical response to therapy was shown
not to be optimal, we were interested to know whether
this effect also applied to diseases that showed a good
clinical response. Therefore, we aimed to determine the
effect of TNF blockade on the type I IFN response gene
activity in RA patients, for approximately two thirds of
whom TNF-blocking therapy is effective. Previously, we
and others demonstrated increased type I IFN response
gene activity in the peripheral blood cells of approxi-
mately 50% of anti-TNF treatment-naive RA patients
[13]. This analysis was based on the measurement of the
expression of a set of 34 type I IFN response genes.
Accordingly, others demonstrated increased levels of
IFNα in serum of a subset of RA patients [14]. Here, we
first studied whether TNF blockade in RA led to a consis-
tent increase in type I IFN response gene activity as was
reported for SoJIA and SS. Subsequently, we determined
whether anti-TNF-induced changes in IFN response
activity were associated with the clinical outcome of TNF
blockade in RA.
Materials and methods
Patients
Consecutive patients with RA according to the American
College of Rheumatology criteria were enrolled in the
study at the outpatient clinic of the Academic Medical
Center (AMC) in Amsterdam over a period of 1 year.
Inclusion criteria were 18 to 85 years of age, a failure of at
least two disease-modifying anti-rheumatic drugs
(including methotrexate [MTX]), and active disease (dis-
ease activity score using 28 joint counts [DAS28] of at
least 3.2). Patients with a history of an acute inflamma-
tory joint disease of different origin or previous use of a
TNF-blocking agent were excluded. Patients were on sta-
ble, maximally tolerable MTX treatment. Whole blood
samples (2.5 mL) were obtained using PAXgene tubes
(PreAnalytiX GmbH, Hilden, Germany) from 33 RA
patients prior to initiation of anti-TNF therapy with inf-
liximab (3 mg/kg intravenously at baseline and weeks 2
and 6 and subsequently every 8 weeks). After 4, 8, 12, and
16 weeks of treatment, another PAXgene tube was
obtained. All patients gave written informed consent, and
the study protocol was approved by the Medical Ethics
Committee (AMC). After 16 weeks of treatment, clinical
response was assessed using the European League
Against Rheumatism (EULAR) response criteria [15,16]
Table 1: Characteristics of patients at baseline
Array analysis
(n = 15)
qPCR analysis
(n = 18)
Age, years 51 (39-55) 58 (51-69)
Gender, female/male 7/8 14/4
Disease characteristics
DAS28 5.6 (4.6-7.0) 5.7 (5.0-6.6)
C-reactive protein, mg/dL 8 (6-22) 13 (5-44)
Erythrocyte sedimentation rate 25 (12-41) 32 (16-47)
ACPA titer, U/mL 100 (15-595) 541 (121-1,805)
IgM RF titer, U/mL 28 (14-133) 67 (22-182)
Disease duration, months 77 (29-240) 65 (36-1,992)
Erosions n = 13 n = 15
Medication
Methotrexate dose, mg/week 25 (20-30) 21 (15-25)
Prednisone n = 2 n = 5
NSAID n = 7 n = 12
Values are presented as median (interquartile range 25 to 75) unless indicated otherwise. ACPA, anti-citrullinated protein antibodies; DAS28,
disease activity score using 28 joint counts; NSAID, nonsteroidal anti-inflammatory drug; qPCR, quantitative polymerase chain reaction; RF,
rheumatoid factor.
van Baarsen et al. Arthritis Research & Therapy 2010, 12:R11
/>Page 3 of 10
as well as the reduction in DAS28 (response defined by a
decrease in DAS28 of at least 1.2) [17]. According to the
EULAR response criteria, 6 of the 33 patients had a poor
response whereas 12 patients displayed a good response
to treatment. An overview of the patients' characteristics
is presented in Table 1.
Blood sampling for RNA isolation
Blood (2.5 mL) was drawn in PAXgene blood RNA isola-
tion tubes (PreAnalytiX GmbH) and stored at -20°C.
Tubes were thawed for 2 hours at room temperature prior
to RNA isolation. Next, total RNA was isolated using the
PAXgene RNA isolation kit according to the manufac-
turer's instructions, including a DNAse (Qiagen, Venlo,
The Netherlands) step to remove genomic DNA. Quan-
tity and purity of the RNA were tested using the Nano-
Drop spectrophotometer (NanoDrop Technologies, Inc.,
Wilmington, DE, USA).
Microarray data
In 15 patients, the baseline expression of type I IFN-regu-
lated genes was determined using cDNA microarrays and
compared with levels 1 month after treatment. Therefore,
we used 43 K cDNA microarrays (from the Stanford
Functional Genomics Facility [18]) printed on aminosi-
lane-coated slides containing approximately 20,000
unique genes. DNA spots were UV-crosslinked to the
slide using 150 to 300 mJ. Sample preparation and
microarray hybridization were performed as described
previously [13,19]. Data storage and filtering were per-
formed using the Stanford Microarray Database [20,21]
as described previously [22]. Raw data (log2) can be
downloaded from the publicly accessible Stanford data-
base website [21]. In addition, data are stored in the Gene
Expression Omnibus [23] [GEO:GSE19821].
Interferon response gene set
Previously, we showed that a prominent cluster of highly
correlated type I IFN response genes is upregulated in a
subgroup of biological-naive RA patients compared with
healthy controls [13]. A gene set consisting of 34 type I
IFN response genes was obtained from these data. A
smaller IFN gene set consisting of 15 genes was selected
for validation analysis using a BioMark™ Real-Time PCR
[Polymerase Chain Reaction] System (Fluidigm Corpora-
tion, South San Francisco, CA, USA). Detailed informa-
tion of the gene lists is presented in Table 2.
Real-time quantitative polymerase chain reaction
RNA (0.5 μg) was reverse-transcribed into cDNA using
the Revertaid H-minus cDNA synthesis kit (MBI Fer-
mentas, St. Leon-Rot, Germany) according to the manu-
facturer's instructions. Real-time quantitative PCR
(qPCR) was performed using an ABI Prism 7900HT
Sequence detection system (Applied Biosystems, Foster
City, CA, USA) using SybrGreen (Applied Biosystems).
Primers were designed using Primer Express software
and guidelines (Applied Biosystems), and used primer
sequences are listed in Additional file 1. To calculate arbi-
trary values of mRNA levels and to correct for differences
in primer efficiencies, a standard curve was constructed.
Expression levels of target genes were expressed relative
to 18SRNA.
BioMark™ Real-Time PCR System
The BioMark™ 48.48 Dynamic Array (Fluidigm Corpora-
tion) for real-time qPCR was used to simultaneously
measure the expression of 15 IFN response genes (Table
2) in 47 samples (plus one negative control) in triplicate.
The 47 samples were derived from 10 patients (five poor
and five good EULAR responders) at baseline and 1, 2, 3,
or 4 months after treatment. From two poor and one
good responder patients, the 3-month time points are
missing. This experiment was performed at the outsourc-
ing company ServiceXS (Leiden, The Netherlands). Used
pre-designed Taqman Gene Expression Assays are listed
in Additional file 1. Expression levels of target genes were
expressed relative to 18SRNA.
Statistical analysis
Data were analyzed using software programs GraphPad
Prism 4 (GraphPad Software, Inc., San Diego, CA, USA)
and SPSS version 14.0 (SPSS Inc., Chicago, IL, USA).
Data were checked for normal (Gaussian) distribution.
Paired t test analysis was used to compare pre- and post-
treatment expression levels. Two-group comparisons
were analyzed using unpaired t test or two-way analysis
of variance (ANOVA), where appropriate. Data were con-
sidered significant with P values of less than 0.05.
Results
Differential effect of tumor necrosis factor blockade on
type I interferon signature
Previously, we compared the gene expression profiles of
peripheral blood cells of RA patients with those of
healthy controls and found that a subgroup of RA
patients has an increased expression of type I IFN
response genes [13]. This increased expression in IFN
response genes was highly variable between the individ-
ual RA patients and unrelated to medication and disease
activity. In the present study, we studied the effect of TNF
blockade on the transcription of type I IFN response
genes. Therefore, we used the expression values of 34
type I IFN response genes (Table 2) (described previously
[13]), which were averaged. Subsequently, baseline values
were compared with post-treatment levels (Additional
file 2). At the patient group level, there was no significant
change in type I IFN response gene activity (Figure 1a).
van Baarsen et al. Arthritis Research & Therapy 2010, 12:R11
/>Page 4 of 10
Table 2: Interferon response gene/transcript sets used in this study
IFN set
(34 genes)
Validation
(15 genes)
Symbol NCBI mRNA accession
number
Name
X AA075725 AA075725.1 None
X AA142842 AA142842.1 None
X AI347124 AI347124.1 None
X ATF3 NM_001030287 Activating transcription factor 3
X EIF2AK2 NM_001135651 Eukaryotic translation initiation factor 2-alpha kinase 2
X X EPSTI1 NM_001002264 Epithelial stromal interaction 1 (breast)
X Hs.128576 NM_001135993 CDNA FLJ90394 fis, clone NT2RP2005632
X Hs.97872 AI821640 Transcribed locus
X IFI16 NM_005531 Interferon, gamma-inducible protein 16
X X IFI35 NM_005533 Interferon-induced protein 35
X X IFI44L NM_006820 Interferon-induced protein 44-like
X X IFI6 NM_002038 Interferon, alpha-inducible protein 6
X X IFIT1 NM_001548 Interferon-induced protein with tetratricopeptide
repeats 1
X IFIT2 NM_001547 Interferon-induced protein with tetratricopeptide
repeats 2
X X IFITM1 NM_003641 Interferon-induced transmembrane protein 1 (9-27)
X IL1RN NM_000577 Interleukin 1 receptor antagonist
X X IRF2 NM_002199 Interferon regulatory factor 2
X IRF7 NM_001572 Interferon regulatory factor 7
X X ISG15 NM_005101 ISG15 ubiquitin-like modifier
X X LGALS3BP NM_005567 Lectin, galactoside-binding, soluble, 3 binding protein
X MX1 NM_001144925 Myxovirus (influenza virus) resistance 1
X X MX2 NM_002463 Myxovirus (influenza virus) resistance 2 (mouse)
X X OAS1 NM_001032409 2',5' -oligoadenylate synthetase 1, 40/46 kDa
X X OAS2 NM_001032731 2' -5' -oligoadenylate synthetase 2, 69/71 kDa
X PARP14 NM_017554 Poly (ADP-ribose) polymerase family, member 14
X PLSCR1 NM_021105 Phospholipid scramblase 1
X RNF213 NM_020914 Ring finger protein 213
X X RSAD2 NM_080657 Radical S-adenosyl methionine domain containing 2
(alias cig5)
X RTP4 NM_022147 Receptor (chemosensory) transporter protein 4
X X SAMD9L NM_152703 Sterile alpha motif domain containing 9-like
X X SERPING1 NM_000062 Serpin peptidase inhibitor, clade G (C1 inhibitor),
member 1
X TAP1 NM_000593 Transporter 1, ATP-binding cassette, sub-family B (MDR/
TAP)
X TNFAIP6 NM_007115 Tumor necrosis factor, alpha-induced protein 6
X UBE2L6 NM_004223 Ubiquitin-conjugating enzyme E2L 6
IFN, interferon; NCBI, National Center for Biotechnology Information.
van Baarsen et al. Arthritis Research & Therapy 2010, 12:R11
/>Page 5 of 10
However, the regulation of IFN response genes upon
TNF blockade was highly variable between patients. The
variation was not related to gender or MTX dose or pred-
nisone or nonsteroidal anti-inflammatory drug (NSAID)
use.
To confirm these results in an independent cohort of 18
RA patients, three genes (RSAD2, IFI44L, and OAS1) that
showed the best correlation (R > 0.9) with the mean
expression value of the set of 34 type I IFN response
genes were selected. The mean expression of the three
genes was measured by real-time qPCR before and 1
month after infliximab therapy. Ten patients showed an
increased expression of these three IFN response genes
after TNF blockade, whereas in eight patients similar or
decreased levels were observed (Figure 1b). The IFN reg-
ulation was independent of gender or MTX dose or pred-
nisolone or NSAID use. Collectively, these results
confirm findings from the microarray study and evidently
demonstrate that the regulation of IFN response gene
activity upon TNF blockade in RA is not as consistent as
previously described for SoJIA [9] and SS [11].
Change in type I interferon response gene activity is
unrelated to baseline levels
Since the type I IFN response gene expression levels are
already highly heterogeneous in biological-naive RA
patients, we investigated whether the observed changes
were related to the magnitude of IFN response gene
expression prior to treatment. Therefore, the relationship
between the extent of the baseline IFN response gene
expression levels and its change after TNF blockade was
tested. In the 15 patients, the baseline mean expression of
the type I IFN gene set did not correlate with their corre-
sponding change after treatment (Pearson R = -0.42, P =
0.12). This was confirmed in the validation group of 18
patients by using the mean expression levels of the three
IFN response genes (RSAD2, IFI44L, and OAS1) mea-
sured by qPCR, although a trend toward significance was
observed (Spearman R = -0.44, P = 0.064). These findings
reveal that the type I IFN response gene expression pro-
file prior to treatment is not associated with the direction
of its change upon TNF blockade.
Anti-tumor necrosis factor induced-interferon regulation
and clinical response to treatment
Finally, we investigated whether the treatment-induced
changes in type I IFN response gene expression levels
were associated with clinical response to treatment.
Therefore, the patients (n = 15) were divided into two
groups on the basis of their change in mean expression
level for the 34 IFN response genes (ratio > 1 and ratio <
1) as demonstrated in Figure 1a. Next, clinical parameters
were compared between these two groups. Clinical
response to treatment was determined after 16 weeks of
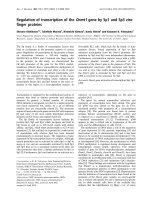
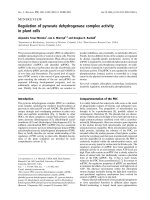
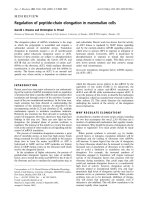
Differential regulation of interferon (IFN) response genes upon tumor necrosis factor (TNF) blockade
Figure 1 Differential regulation of interferon (IFN) response genes upon tumor necrosis factor (TNF) blockade. The expression levels of 34
type I IFN response genes were determined by cDNA microarray analysis in peripheral blood cells of 15 patients before (T0) and 1 month after (T1)
anti-TNF treatment. (a) Subsequently, for each patient, the expression levels were averaged (note: data are in log2 space) and baseline levels were
compared with post-treatment levels. The patients whose IFN response gene levels are induced after TNF blockade are indicated by red lines, and
patients with a downregulation are indicated by green lines. Subsequently, the expression levels of three IFN response genes (RSAD2, IFI44L, and OAS1)
were measured by quantitative real-time polymerase chain reaction (PCR) in an independent group of 18 patients. (b) The expression levels of the
three genes were averaged, and baseline levels were compared with post-treatment levels. ns, not significant using a paired t test analysis.
mean 34 IFN genes
T0 T1
-1.0
-0.5
0.0
0.5
1.0
1.5
Mean expression
ns
A.
(array based)
B.
mean 3 IFN genes
(RSAD2, IFI44L, OAS1)
T0 T1
0.1
1
10
100
Mean expression
(PCR based)
ns
van Baarsen et al. Arthritis Research & Therapy 2010, 12:R11
/>Page 6 of 10
treatment. Interestingly, the patients who showed an
increase in type I IFN response gene expression levels
after 1 month of treatment had a poor clinical response to
treatment. This was reflected by less improvement in dis-
ease activity scores (P = 0.013) and higher tender joint
counts (P = 0.015) and higher Health Assessment Ques-
tionnaire-Disability Index scores (P = 0.008) after treat-
ment (Figure 2). Accordingly, all patients without an anti-
TNF-induced increase in type I IFN gene activity had a
good or moderate response to treatment as assessed by
the EULAR response criteria (P = 0.018) (Figure 2). From
a total of 29 patients, both the EULAR and the qPCR
expression data were available for the three IFN response
genes RSAD2, IFI44L, and OAS1. Analysis of the pre- ver-
sus post-treatment ration of OAS1 revealed that the
change in gene expression of OAS1 is significantly associ-
ated with clinical response to treatment (P < 0.013).
To determine whether the IFN response to TNF block-
ade was sustained over time, five EULAR good and five
EULAR poor responders were selected and the expres-
sion levels of 15 IFN response genes (selected from the
set of 34 genes used above, Table 2) were measured at
baseline and 1, 2, 3, and 4 months after treatment by
qPCR (Additional file 3). The expression levels were aver-
aged for the individual patients, and the treatment-
induced changes (ratio post- versus pre-treatment) in
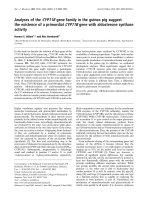
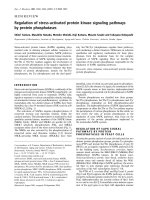
Differential regulation of interferon (IFN) response genes upon tumor necrosis factor (TNF) blockade and clinical response to
treatment
Figure 2 Differential regulation of interferon (IFN) response genes upon tumor necrosis factor (TNF) blockade and clinical response to
treatment. Patients were divided into two groups (ratio < 1 and ratio > 1) on the basis of their IFN response upon TNF blockade and compared with
each other with respect to clinical response to treatment. The ratio is determined by the T = 1/T = 0 expression levels of the IFN response genes as
demonstrated in Figure 1a. Data are shown as box plots; each box represents the 25th to 75th percentiles. The lines inside represent the median, and
the ends of the whiskers represent the smallest and largest observations. Patients with an upregulation in IFN response genes displayed a significantly
(unpaired t test, * P < 0.05; **P < 0.01) worse clinical response to treatment as assessed by change in disease activity score (DAS) (DAS before treatment
minus DAS 16 weeks after treatment) (a), European League Against Rheumatism (EULAR) response (b), tender joint count (TJC) (c), and Health Assess-
ment Questionnaire-Disability Index (HAQ) (d) after treatment.
87N =
Ratio>1Ratio<1
Change in DAS
5
4
3
2
1
0
-1
87N =
EULAR response
2.5
2.0
1.5
1.0
.5
0.0
5
87N =
TJC after treatment
30
20
10
0
-10
87N =
HAQ after treatment
2.5
2.0
1.5
1.0
.5
0.0
5
145.00
A. B.
C. D.
Ratio<1 Ratio>1
Ratio>1Ratio<1 Ratio>1Ratio<1
*
*
*
**
van Baarsen et al. Arthritis Research & Therapy 2010, 12:R11
/>Page 7 of 10
IFN response gene expression levels over time were com-
pared between the two clinical response groups using
two-way ANOVA. Overall, the IFN response genes
showed an upregulation in the poor responder group,
which was most prominent at 2 months after the start of
therapy (data not shown). At the single-gene level, the
increased expression in poor versus good responders
reached significance for the OAS1 and LGALS3BP genes
(Figure 3a, b). For three other IFN response genes (Mx2,
OAS2, and SERPING1), a trend (P = approximately 0.06,
data not shown) was observed toward increased expres-
sion in the poor responder patients. Combining these five
genes (OAS1, LGALS3BP, Mx2, OAS2, and SERPING1)
into one IFN response gene set improved the significance
(Figure 3c). These data demonstrate that poor response
to infliximab treatment is associated with treatment-
induced increase in type I IFN response gene activity.
Discussion
In this study, we demonstrated that blockade of the
inflammatory cytokine TNF in RA patients modulates
the expression of IFN response gene activity in a hetero-
geneous manner. The data revealed that some RA
patients display a treatment-induced increased expres-
sion of type I IFN response genes whereas others display
no effect or a small decrease. We provided evidence that
the treatment-induced change in expression levels of IFN
response genes is associated with the EULAR response
rate at 16 weeks after the start of infliximab treatment.
RA patients who revealed an increased IFN response
gene expression profile after 1 to 2 months of anti-TNF
treatment exhibited a poor clinical response. No associa-
tion between clinical response to infliximab treatment
and baseline IFN response gene activity was found.
IFNs are known for their immune regulatory proper-
ties. Previously, we provided evidence for an increased
expression of type I IFN response genes in a subset of
patients with RA [13]. Upregulation of type I IFN
response genes has been reported in peripheral blood
cells of (a subset of) patients with other autoimmune dis-
eases, like SLE [1,24-26], dermatomyositis [27], and mul-
tiple sclerosis [22]. Type I IFNs (IFNαβ) exert broad dual
effects on the immune system, reflecting both immune-
stimulatory and immune-suppressive activities. Immune-
stimulatory activities relate to the activation of myeloid
dendritic cells, chemokines, chemokine receptors,
costimulatory molecules (CD40, CD80, and CD86), and
humoral responses. Immune-suppressive effects are
reflected by Th2 cell skewing and anti-proliferative and
pro-apoptotic effects. According to their dual effect on
immunity, their role in disease may range from detrimen-
tal to beneficial. Although the anti-TNF-induced increase
in IFN response activity might be an epiphenomenon
related to the effect of TNF blockade, it is tempting to
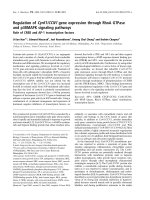
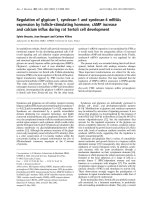
Poor response to tumor necrosis factor blockade is accompanied by upregulation of interferon (IFN) response genes
Figure 3 Poor response to tumor necrosis factor blockade is accompanied by upregulation of interferon (IFN) response genes. For five Eu-
ropean League Against Rheumatism (EULAR) (0) poor responder (red) and five EULAR (2) good responder (green) patients, the expression levels of 15
IFN response genes were measured by quantitative real-time polymerase chain reaction (PCR) (BioMark™) at baseline and 1, 2, 3, and 4 months after
treatment. From two poor and one good responder patients, the 3-month time points are missing. The IFN response gene expression levels during
treatment were compared between the two clinical response groups by means of two-way analysis of variance test. Treatment-induced changes in
the expression levels of two genes, LGALS3BP (a) and OAS1 (b), were significantly different between the two response groups. (c) The mean expression
level of five IFN response genes (LGALS3BP, OAS1, Mx2, SERPING1, and OAS2) showed the best significant difference between the two clinical response
groups. Graphs show the mean and standard error of the mean expression levels for each clinical response group. RQ, relative quantity.
EULAR 0
EULAR 2
p=0.033 p=0.041 p=0.022
A. B. C.
LGALS3BP
-1
0 1 2 3 4
0.0
0.5
1.0
1.5
2.0
2.5
3.0
3.5
4.0
4.5
Time
(months)
RQ
OAS1
-1
0 1 2 3 4
0.0
2.5
5.0
7.5
10.0
12.5
RQ
Mean 5 genes
-1
0 1 2 3 4
0.0
2.5
5.0
7.5
RQ
Time
(months)
Time
(months)
van Baarsen et al. Arthritis Research & Therapy 2010, 12:R11
/>Page 8 of 10
speculate on a role of increased IFN bioactivity in the
deteriorating clinical effects. The association between an
increase in type I IFN response gene activity and poor
response to anti-TNF treatment may suggest a harmful
role for type I IFN bioactivity in RA or, alternatively, a
failed attempt to counter-regulate inflammation.
Clinical experience revealed that a fraction of patients
treated with TNF antagonists developed (increased) anti-
dsDNA antibodies, in some cases with a concomitant
lupus-like syndrome [28,29]. From a total of 18 of the 33
patients we studied, levels of anti-citrullinated protein
antibody, rheumatoid factor, and double-stranded DNA
autoantibody, determined before and 24 weeks after TNF
blockade, were available. The expression level of IFN
response genes was not related to antibody levels at base-
line nor was the activation of the IFN response genes
related to the drug-induced formation of antibodies (data
not shown [30]).
The differences between the effects of TNF blockade
on IFN response activity between the studies in SS [11]
and SoJIA [9], on the one hand, and our studies in RA and
spondyloarthritis (SpA) [31], on the other, could have
their origin in differences in design between the studies,
such as the use of infliximab in RA versus etanercept in
SS, and the different readout systems used. For example,
the SS study was based on an indirect reporter cell assay
to measure type I IFN activity in plasma, whereas in the
SoJIA and RA studies, measurement of IFN response
gene activity in the peripheral blood cells was measured.
Using the reporter assay, we previously demonstrated
that the serum type I IFN bioactivity was increased in
SpA patients treated with etanercept whereas it was tran-
siently declined by infliximab [31]. This is suggestive for
differential effects of etanercept and infliximab on IFN
response activity, although the direct consequence for the
IFN response signature in the peripheral blood cells has
not been tested. In an attempt to find an explanation for
the apparent discrepancies in IFN response gene activity
related to clinical response to infliximab, we learned that
in both RA and SS [11,12] an increased IFN response
activity is associated with a poor clinical response.
The inter-individual differences in anti-TNF-induced
IFN response may be the result of differential regulatory
processes. Evidence that TNF blockade may exert both
inhibitory and activating effects on IFN response activity
is available. In vitro experiments suggested that endoge-
nous secretion of TNF by pDCs represents a negative
feedback on IFN production [9]. Whereas this finding
suggested that TNF displays counteracting effects on IFN
response activity, others have reported that TNF initiates
an IRF1-dependent autocrine loop leading to sustained
expression of STAT1-dependent type I IFN response
genes [32]. Hence, the divergent outcome of the IFN
response activity might be a consequence of differences
in the relative contribution of each of these processes in
the regulation of IFN response activity. Alternatively,
genetic variation in the type I IFN biology could underlie
the variation in response activity. Single-nucleotide poly-
morphisms in several transcription factors involved the
type I IFN pathway (for example, IRF5, Tyk2, and STAT4)
have recently been associated with a number of autoim-
mune diseases, including SLE [33,34] and RA [35-37].
Future studies are needed to unravel the mechanism
behind the divergent alterations in IFN response gene
activity upon TNF blockade. Since the current informa-
tion on the differential IFN response gene activity does
not have predictive value to identify responders before
the start of therapy, detailed insight in the regulatory pro-
cesses that underlie this effect might be helpful to identify
such biomarkers. Therefore, in vitro studies with blood
cells that are treated with a TNF blocker might be useful.
Conclusions
In summary, this study shows that there is a large varia-
tion between RA patients in the change of IFN response
gene expression levels during TNF blockade. The change
in IFN response genes is unrelated to baseline expression
levels. Interestingly, treatment-induced increase of IFN
response gene activity is associated with poor clinical
response to infliximab treatment. Additional studies in
larger patient cohorts should reproduce and confirm
these findings.
Additional material
Abbreviations
AMC: Academic Medical Center; ANOVA: analysis of variance; DAS28: disease
activity score using 28 joint counts; EULAR: European League Against Rheuma-
tism; IFN: interferon; MTX: methotrexate; NSAID: nonsteroidal anti-inflamma-
tory drug; PCR: polymerase chain reaction; pDC: plasmacytoid dendritic cell;
qPCR: quantitative polymerase chain reaction; RA: rheumatoid arthritis; SLE:
systemic lupus erythematosus; SoJIA: systemic-onset juvenile idiopathic arthri-
tis; SpA: spondyloarthritis; SS: Sjögren syndrome; TNF: tumor necrosis factor.
Additional file 1
Information on real-time PCR assays. Primer sequences for quantitative
real-time PCR and Pre-designed Taqman Gene Expression Assays used for
Fluidigm's BioMark™ Real-Time PCR System.
Additional file 2
Microarray data values of the individual 34 IFN response genes.
Microarray data values (in log2) of the 34 IFN response genes measured in
15 RA patients before and one month after infliximab treatment including
EULAR response.
Additional file 3
qPCR values of the individual 15 IFN response genes. Gene expres-
sion values of 15 IFN response genes measured by Fluidigm's BioMark™
Real-Time PCR System. Expression values were measured before start of
treatment, one, two, three and four months after start of therapy in 5
EULAR good responder patients and 5 EULAR poor responder patients.
van Baarsen et al. Arthritis Research & Therapy 2010, 12:R11
/>Page 9 of 10
Competing interests
PT has served as a consultant for Abbott (Abbott Park, IL, USA), Amgen (Thou-
sand Oaks, CA, USA), Centocor (Horsham, PA, USA), Schering-Plough Corpora-
tion (Kenilworth, NJ, USA), UCB (Brussels, Belgium), and Wyeth (Madison, NJ,
USA). The VU University Medical Center has filed a patent application (patent
file number P086657EP00, 'Predicting clinical response to treatment with a sol-
uble TNF-antagonist or TNF, or a TNF receptor agonist'). The other authors
declare that they have no competing interests.
Authors' contributions
LvB helped to conceive, design, and perform the experiments, participated in
analysis and interpretation of data, and helped to write the paper. CW helped
to conceive, design, and perform the experiments, participated in patient
inclusion and disease activity measure, and helped to write the paper. PT
helped to conceive and design the experiments and participated in patient
inclusion and disease activity measure. CV helped to conceive and design the
experiments, participated in analysis and interpretation of data, and helped to
write the paper. TvdPK participated in analysis and interpretation of data and
analysis tools. TC, DB, and BD participated in patient inclusion, disease activity
measurements and clinical laboratory analyses. FR helped to perform the
experiments. All authors read and approved the final manuscript.
Acknowledgements
This study was supported by grants from The Netherlands Organization for
Health Research and Development (ZonMw) of The Netherlands Organization
for Scientific Research (NWO) (grant number 945-02-029), the European Com-
munity's FP6 funding (AUTOCURE), the Innovation Oriented research Program
(IOP) on Genomics, and the Centre for Medical Systems Biology (Netherlands
Genomics Initiative). This publication reflects the views of the authors only. The
European Community is not liable for any use that may be made of the infor-
mation herein. We thank ServiceXS for performing the real-time PCR experi-
ments using Dynamic Array on the BioMark™ instrument (Fluidigm
Corporation). This was made possible, in part, via the ServiceXS-Fluidigm Appli-
cation Challenge prize awarded to LvB.
Author Details
1
Department of Pathology, VU University Medical Center, De Boelelaan 1118,
1081 HZ, Amsterdam, The Netherlands,
2
Current address: Department of Clinical Immunology & Rheumatology,
Academic Medical Center, University of Amsterdam, Meibergdreef 9, 1105 AZ,
Amsterdam, The Netherlands,
3
Department of Clinical Immunology & Rheumatology, Academic Medical
Center, University of Amsterdam, Meibergdreef 9, 1105 AZ, Amsterdam, The
Netherlands,
4
Department of Molecular Cell Biology & Immunology, VU University Medical
Center, Van der Boechorststraat 7, 1081 BT, Amsterdam, The Netherlands and
5
Department of Rheumatology, VU University Medical Center, De Boelelaan
1117, 1081 HV, Amsterdam, The Netherlands
References
1. Baechler EC, Batliwalla FM, Karypis G, Gaffney PM, Ortmann WA, Espe KJ,
Shark KB, Grande WJ, Hughes KM, Kapur V, Gregersen PK, Behrens TW:
Interferon-inducible gene expression signature in peripheral blood
cells of patients with severe lupus. Proc Natl Acad Sci USA 2003,
100:2610-2615.
2. Baechler EC, Gregersen PK, Behrens TW: The emerging role of interferon
in human systemic lupus erythematosus. Curr Opin Immunol 2004,
16:801-807.
3. Ronnblom LE, Alm GV, Oberg KE: Autoimmunity after alpha-interferon
therapy for malignant carcinoid tumors. Ann Intern Med 1991,
115:178-183.
4. Feldmann M, Maini RN: Anti-TNF alpha therapy of rheumatoid arthritis:
what have we learned? Annu Rev Immunol 2001, 19:163-196.
5. Elliott MJ, Maini RN, Feldmann M, Kalden JR, Antoni C, Smolen JS, Leeb B,
Breedveld FC, Macfarlane JD, Bijl H: Randomised double-blind
comparison of chimeric monoclonal antibody to tumour necrosis
factor alpha (cA2) versus placebo in rheumatoid arthritis. Lancet 1994,
344:1105-1110.
6. Targan SR, Hanauer SB, van Deventer SJ, Mayer L, Present DH, Braakman T,
DeWoody KL, Schaible TF, Rutgeerts PJ: A short-term study of chimeric
monoclonal antibody cA2 to tumor necrosis factor alpha for Crohn's
disease. Crohn's Disease cA2 Study Group. N Engl J Med 1997,
337:1029-1035.
7. Tracey D, Klareskog L, Sasso EH, Salfeld JG, Tak PP: Tumor necrosis factor
antagonist mechanisms of action: a comprehensive review. Pharmacol
Ther 2008, 117:244-279.
8. Banchereau J, Pascual V, Palucka AK: Autoimmunity through cytokine-
induced dendritic cell activation. Immunity 2004, 20:539-550.
9. Palucka AK, Blanck JP, Bennett L, Pascual V, Banchereau J: Cross-
regulation of TNF and IFN-alpha in autoimmune diseases. Proc Natl
Acad Sci USA 2005, 102:3372-3377.
10. Kimura Y, Pinho P, Walco G, Higgins G, Hummell D, Szer I, Henrickson M,
Watcher S, Reiff A: Etanercept treatment in patients with refractory
systemic onset juvenile rheumatoid arthritis. J Rheumatol 2005,
32:935-942.
11. Mavragani CP, Niewold TB, Moutsopoulos NM, Pillemer SR, Wahl SM, Crow
MK: Augmented interferon-alpha pathway activation in patients with
Sjogren's syndrome treated with etanercept. Arthritis Rheum 2007,
56:3995-4004.
12. Mariette X, Ravaud P, Steinfeld S, Baron G, Goetz J, Hachulla E, Combe B,
Puechal X, Pennec Y, Sauvezie B, Perdriger A, Hayem G, Janin A, Sibilia J:
Inefficacy of infliximab in primary Sjogren's syndrome: results of the
randomized, controlled Trial of Remicade in Primary Sjogren's
Syndrome (TRIPSS). Arthritis Rheum 2004, 50:1270-1276.
13. Pouw Kraan TC van der, Wijbrandts CA, van Baarsen LG, Voskuyl AE,
Rustenburg F, Baggen JM, Ibrahim SM, Fero M, Dijkmans BA, Tak PP,
Verweij CL: Rheumatoid arthritis subtypes identified by genomic
profiling of peripheral blood cells: assignment of a type I interferon
signature in a subpopulation of patients. Ann Rheum Dis 2007,
66:1008-1014.
14. Bokarewa M, Tarkowski A, Lind M, Dahlberg L, Magnusson M:
Arthritogenic dsRNA is present in synovial fluid from rheumatoid
arthritis patients with an erosive disease course. Eur J Immunol 2008,
38:3237-3244.
15. van Gestel AM, Prevoo ML, van 't Hof MA, van Rijswijk MH, Putte LB van de,
van Riel PL: Development and validation of the European League
Against Rheumatism response criteria for rheumatoid arthritis.
Comparison with the preliminary American College of Rheumatology
and the World Health Organization/International League Against
Rheumatism Criteria. Arthritis Rheum 1996, 39:34-40.
16. Fransen J, van Riel PL: The Disease Activity Score and the EULAR
response criteria. Clin Exp Rheumatol 2005, 23:S93-S99.
17. van Gestel AM, Haagsma CJ, van Riel PL: Validation of rheumatoid
arthritis improvement criteria that include simplified joint counts.
Arthritis Rheum 1998, 41:1845-1850.
18. Stanford: functional genomics facility [ />19. Pouw Kraan TC van der, van Baarsen LG, Rustenburg F, Baltus B, Fero M,
Verweij CL: Gene expression profiling in rheumatology. Methods Mol
Med 2007, 136:305-327.
20. Demeter J, Beauheim C, Gollub J, Hernandez-Boussard T, Jin H, Maier D,
Matese JC, Nitzberg M, Wymore F, Zachariah ZK, Brown PO, Sherlock G,
Ball CA: The Stanford Microarray Database: implementation of new
analysis tools and open source release of software. Nucleic Acids Res
2007, 35:D766-D770.
21. Stanford Microarray Database [ />22. van Baarsen LG, Pouw Kraan TC van der, Kragt JJ, Baggen JM, Rustenburg
F, Hooper T, Meilof JF, Fero MJ, Dijkstra CD, Polman CH, Verweij CL: A
subtype of multiple sclerosis defined by an activated immune defense
program. Genes Immun 2006, 7:522-531.
23. Gene Expression Omnibus [ />24. Bennett L, Palucka AK, Arce E, Cantrell V, Borvak J, Banchereau J, Pascual V:
Interferon and granulopoiesis signatures in systemic lupus
erythematosus blood. J Exp Med 2003, 197:711-723.
25. Han GM, Chen SL, Shen N, Ye S, Bao CD, Gu YY: Analysis of gene
expression profiles in human systemic lupus erythematosus using
oligonucleotide microarray. Genes Immun 2003, 4:177-186.
26. Kirou KA, Lee C, George S, Louca K, Peterson MG, Crow MK: Activation of
the interferon-alpha pathway identifies a subgroup of systemic lupus
Received: 11 June 2009 Revisions Requested: 27 July 2009
Revised: 10 December 2009 Accepted: 22 January 2010 Published: 22
January 2010
This article is available from: 2010 van Baarsen et al.; licensee BioMed Central Ltd. This is an open access article distribute d under the terms of the Creative Co mmons Attribution License ( which permits unrestricted use, distribution, and reproduction in any medium, provided the original work isproperly cited.Arthritis Research & Therapy 2010, 12:R11
van Baarsen et al. Arthritis Research & Therapy 2010, 12:R11
/>Page 10 of 10
erythematosus patients with distinct serologic features and active
disease. Arthritis Rheum 2005, 52:1491-1503.
27. Baechler EC, Bauer JW, Slattery CA, Ortmann WA, Espe KJ, Novitzke J,
Ytterberg SR, Gregersen PK, Behrens TW, Reed AM: An interferon
signature in the peripheral blood of dermatomyositis patients is
associated with disease activity. Mol Med 2007, 13:59-68.
28. Charles PJ, Smeenk RJ, De Jong J, Feldmann M, Maini RN: Assessment of
antibodies to double-stranded DNA induced in rheumatoid arthritis
patients following treatment with infliximab, a monoclonal antibody
to tumor necrosis factor alpha: findings in open-label and randomized
placebo-controlled trials. Arthritis Rheum 2000, 43:2383-2390.
29. Maini RN, Elliott MJ, Charles PJ, Feldmann M: Immunological
intervention reveals reciprocal roles for tumor necrosis factor-alpha
and interleukin-10 in rheumatoid arthritis and systemic lupus
erythematosus. Springer Semin Immunopathol 1994, 16:327-336.
30. Cantaert T, van Baarsen EGM, Wijbrandts CA, Thurlings RM, Sande MG van
de, Bos C, Pouw Kraan TCTM van der, Verweij CL, Tak PP, Baeten D: Type I
interferons have no major influence on humoral autoimmunity in
rheumatoid arthritis. Rheumatology 2009 in press.
31. Cantaert T, De Rycke L, Mavragani CP, Wijbrandts CA, Niewold TB, Niers T,
Vandooren B, Veys EM, Richel D, Tak PP, Crow MK, Baeten D: Exposure to
nuclear antigens contributes to the induction of humoral
autoimmunity during TNF alpha blockade. Ann Rheum Dis 2008,
68:1022-1029.
32. Yarilina A, Park-Min KH, Antoniv T, Hu X, Ivashkiv LB: TNF activates an
IRF1-dependent autocrine loop leading to sustained expression of
chemokines and STAT1-dependent type I interferon-response genes.
Nat Immunol 2008, 9:378-387.
33. Sigurdsson S, Nordmark G, Goring HH, Lindroos K, Wiman AC, Sturfelt G,
Jonsen A, Rantapaa-Dahlqvist S, Moller B, Kere J, Koskenmies S, Widen E,
Eloranta ML, Julkunen H, Kristjansdottir H, Steinsson K, Alm G, Ronnblom
L, Syvanen AC: Polymorphisms in the tyrosine kinase 2 and interferon
regulatory factor 5 genes are associated with systemic lupus
erythematosus. Am J Hum Genet 2005, 76:528-537.
34. Sigurdsson S, Nordmark G, Garnier S, Grundberg E, Kwan T, Nilsson O,
Eloranta ML, Gunnarsson I, Svenungsson E, Sturfelt G, Bengtsson AA,
Jonsen A, Truedsson L, Rantapaa-Dahlqvist S, Eriksson C, Alm G, Goring
HH, Pastinen T, Syvanen AC, Ronnblom L: A risk haplotype of STAT4 for
systemic lupus erythematosus is over-expressed, correlates with anti-
dsDNA and shows additive effects with two risk alleles of IRF5. Hum
Mol Genet 2008, 17:2868-2876.
35. Remmers EF, Plenge RM, Lee AT, Graham RR, Hom G, Behrens TW, de
Bakker PI, Le JM, Lee HS, Batliwalla F, Li W, Masters SL, Booty MG, Carulli JP,
Padyukov L, Alfredsson L, Klareskog L, Chen WV, Amos CI, Criswell LA,
Seldin MF, Kastner DL, Gregersen PK: STAT4 and the risk of rheumatoid
arthritis and systemic lupus erythematosus. N Engl J Med 2007,
357:977-986.
36. Dieguez-Gonzalez R, Calaza M, Perez-Pampin E, de la Serna AR, Fernandez-
Gutierrez B, Castaneda S, Largo R, Joven B, Narvaez J, Navarro F, Marenco
JL, Vicario JL, Blanco FJ, Fernandez-Lopez JC, Caliz R, Collado-Escobar MD,
Carreno L, Lopez-Longo J, Canete JD, Gomez-Reino JJ, Gonzalez A:
Association of interferon regulatory factor 5 haplotypes, similar to that
found in systemic lupus erythematosus, in a large subgroup of patients
with rheumatoid arthritis. Arthritis Rheum 2008, 58:1264-1274.
37. Sigurdsson S, Padyukov L, Kurreeman FA, Liljedahl U, Wiman AC,
Alfredsson L, Toes R, Ronnelid J, Klareskog L, Huizinga TW, Alm G, Syvanen
AC, Ronnblom L: Association of a haplotype in the promoter region of
the interferon regulatory factor 5 gene with rheumatoid arthritis.
Arthritis Rheum 2007, 56:2202-2210.
doi: 10.1186/ar2912
Cite this article as: van Baarsen et al., Regulation of IFN response gene activ-
ity during infliximab treatment in rheumatoid arthritis is associated with clin-
ical response to treatment Arthritis Research & Therapy 2010, 12:R11