Báo cáo y học: " Lack of replication of genetic predictors for the rheumatoid arthritis response to anti-TNF treatments: a prospective case-only study" potx
Bạn đang xem bản rút gọn của tài liệu. Xem và tải ngay bản đầy đủ của tài liệu tại đây (346.16 KB, 6 trang )
RESEARC H ARTIC LE Open Access
Lack of replication of genetic predictors for the
rheumatoid arthritis response to anti-TNF
treatments: a prospective case-only study
Marian Suarez-Gestal
1†
, Eva Perez-Pampin
1†
, Manuel Calaza
1
, Juan J Gomez-Reino
1,2
, Antonio Gonzalez
1*
Abstract
Introduction: We aimed to replicate the strong associations that a recent genome wide association study (GWAS)
has found between 16 single nucleotide polymorphisms (SNPs) and response to anti-tumour necrosis factor (TNF)
treatment in 89 patients with rheumatoid arthritis (RA). This study is very important because, according to
published simulations, associations as strong as the reported ones will mean that these SNPs could be used as
predictors of response at the individual level.
Methods: Disease activity score (DAS28) was evaluated in 151 anti-TNF treated patients with RA of Spanish
ancestry at baseline and every 3 months thereafter. Genotypes of the 16 putative predictor SNPs were obtained by
single-base extension. Association between the relative change in DAS28 and SNP genotypes was tested by linear
regression. In addition, logistic regression was applied to compare genotypes in non-responders (n = 34) versus
good-responders (n = 61) following the EULAR response criteria.
Results: None of the analyses showed any significant association between the 16 SNPs and response to anti-TNF
treatments at 3 or 6 months. Results were also negative when only patients treated with infliximab (66.9% of the
total) were separately analyzed. These negative results were obtained in spite of a very good statistical power to
replicate the reported strong associations.
Conclusions: We still do not have any sound evidence of genetic variants associated with RA response to anti-TNF
treatments. In addition, the possibility we had envisaged of using the results of a recent GWAS for prediction in
individual patients should be dismissed.
Introduction
Anti-tumor necrosis factor (anti-TNF) therapies have
revolutionized the treatment of rheumatoid arthritis
(RA) [1,2]. Three drugs of this type, infliximab, etaner-
cept, and a dalimumab, have been used with success in
hundreds of thousands patients with RA around the
world. New drugs targeting TNF are in development or
have been recently approved [3]. The beneficial effects
of these drugs include a bet ter quality of life; control of
inflammation, stiffness, and pain; and slowing pr ogres-
sion to joint erosions and deformity. It seems also that
they are able to decrease cardiovascular risk and overall
mortality of patients with RA [4,5]. However, there is a
significant percentage of patients who do not obtain
these advantageous effects [1-3]. In some of these
patients, this lack of response is primary, from the start
of the treatment, whereas others develop resistance to
treatment after a period of initial response. Unfortu-
nately, there are no useful predictors to forecast what
the clinical response of a specific patient will be. This
has led to an unsatisfactory trial-and-error approach in
the selection of drugs, meaning that some patients will
miss an effective treatment at a critical window of
opportunity [6] and that health service resources will be
wasted. In response to this challenge, multiple lines of
research are looking for predictors of response to anti-
TNF therapies among patient clinical features, syn ovial
tissue biomarkers, blood proteins, or genetic variants
[7-10]. Very promising, though preliminary, findings
* Correspondence:
† Contributed equally
1
Laboratorio Investigacion 10 and Rheumatology Unit, Instituto de
Investigacion Sanitaria-Hospital Clinico Universitario de Santiago, Travesia
Choupana sn., Santiago de Compostela, 15706, Spain
Suarez-Gestal et al. Arthritis Research & Therapy 2010, 12:R72
/>© 2010 Suarez-Gestal et al.; licensee BioMe d Central Ltd. This is an open access article distributed under the terms of the Creative
Commons Attribution License ( which permits unrestricted use, distribution, and
reprodu ction in any medium, provided the original work is properly cited.
have been reported in this la st field. Sixteen single-
nucleotide polymorphisms (SNPs) with an important
association with response to t reatment were identified
in a recent genome-wide association study (GWAS) [7].
In our view, the most remarkable aspect of these find-
ings was the marked effect size of each SNP, with levels
very rarely found in genetic studies of complex traits.
All showed an odds ratio (OR) of more than 3.5 in the
comparison between patients with good response and
non-responders. Some of these SNPs showed effect sizes
of an OR of more than 10. If confirmed, these effects,
together with minor allele frequencies of more than
12%, will allow the prediction of response to anti-TNF
treatments with great accuracy at the level o f the indivi-
dual patient [ 11]. The limitation of this study was that
only 89 patients were included, and even very significant
results in a study of this size are uncertain. Our objec-
tive has been to provide the necessary replication to
these exciting finding s with the expe ctation that at least
a few of them will be confirmed. This will be a first step
before proceeding to prospective clinical studies to
assess their utility in clinical practice.
Materials and methods
Patients
A group of 151 patients with RA were followed prospec-
tively at the Rheumatology Unit of the Hospital Clinico
Universitario de Santiago to study the efficacy of anti-
TNF therapy. All of the m were of European (Sp anish)
ancestry. Only patients who were naïve with respect to
biologic treatments were included. Patients were system-
atically evaluated at the initiation of ther apy and every 3
months thereafter. Evaluations included pai nful and
swollen joint counts, visual analog scales of pain, global
health assessments by the patient and the physician, ery-
throcyte sedimentation rate (ESR), C-reactive protein
(CRP), health assessment questionnaire (HAQ), and dis-
ease activity score using 28 joint counts (DAS28). Clini-
cal characteris tics are detailed in Table 1. All
participants gave their informed consent for inclusion,
and the study and procedures were approved by the
clinical research ethics committee of Galicia.
Assessment of the efficacy of the treatment
We used the same procedures described in Liu and col-
leagues [7] to ma ke our results comparable. Response to
anti-TNF treatments was assessed with the DAS28 [12].
Theprimaryoutcomewasthequantitativevariable
relDAS28, which is the rel ative change in DAS28
between baseline and the time of evaluation. Presented
as a percentage, this variable is calculated as follows:
relDAS28 = DAS28 at baseline - DAS28 at 3 months / DAS28 at ba
()
sseline 100.
⎡
⎣
⎤
⎦
×
A secondary outcome was the European League
Against Rheumatism (EULAR) response classification in
good, moderate, or non-responders [13]. Good respon-
ders have ΔDAS28ofatleast1.2andDAS28at3
months of not more than 3.2; moderate responders have
(a) ΔDAS28 of at least 1.2 and DAS28 at 3 months of
greater than 3.2 or (b) 0.6 < ΔDAS28 ≤ 1.2 and DAS28
at 3 months of n ot more than 5.1; and non-responders
are those who do not fit into any of these categories.
Genotypes
A total of 16 SNPs from Liu and colleagues [7] were
analyzed (Table 2). Genotypes were obtained by single-
base extension with the SNaPshot Multiplex K it
(Applied Biosyst ems, Foster City, CA, USA) and specific
primers and probes (available in Additional file 1). The
genoty pe call rate was 99.79%, allele frequencies were in
Hardy-Weinberg equilibrium, and concordant results for
the 16 SNPs were obtained in the 21 samples that were
genotyped twice.
Statistical analysis
Comparisons of the clinical characteristics of the RA
patients included in the GWAS and in our study were
done with the Student t test for data a vailable as mean
and standard deviation and with the chi-square test for
contingency t ables for frequency data. Analyses of the
relationship between SNPs and treatment response were
done as in Liu and colleagues [7] to make our results
comparable in this aspect. Briefly, linear regression ana-
lysis between genotype data following a genetic additive
mod el and relDAS28 as the continuous dependent vari-
able was done. A t statistic was derived from the linear
regression and used to calculate the P value of the asso-
ciation. This statistic is robust to deviations from nor-
mality of relDAS28. We also conducted logistic
regression analysis between the groups of responders
and non-responders. ORs and their 95% confide nce
intervals (CIs) were obtained using the non-responder
group as the reference. This second analysis will be less
powerful because the phenotype is transformed to a
dichotomous variable and because the sample size is
reduced by exclusion of the moderate responders. Statis-
tical analyses were performed with a customized version
of the Statistica 7.0 program (StatSoft, Inc., Tulsa, OK,
USA). We visually explored the po ssibility that consid-
eration of all of the SNPs jointly would discriminate
between responder and non-responder patients. This
analysis was done with the Co-Plot algorithm imple-
mented in the Visual Co-Plot software [14,15]. Estima-
tion of the statistical power for the linear regression
analysis was done by transforming the reported P values
and the number of samples in the corresponding
Suarez-Gestal et al. Arthritis Research & Therapy 2010, 12:R72
/>Page 2 of 6
correlation coefficients (R
2
). The values of R
2
and the
number of samples in our study were used as input in
the module f or the F test in omnibus comparisons by
linear regression of G*Power version 3.0.10 software
[16].
Results
The aim of our study was to replicate the strong asso-
ciation of 16 SNPs with response to anti-TNF therapy
reported in a recent GWAS [7]. Therefore, we used the
same variables and type of analysis. Data from the 1 51
patients with RA are shown in Table 1. Some of the
characteristics of our study population were different
from those of the patients analyzed in the GWAS [7].
Specifically, our patients showed a lower percentage of
rheumatoid factor po sitivity, higher positivity for anti-
CCP (anti-cyclic ci trullinated peptide) antibodies, and
higher baseline HAQ and DAS28 levels. There were
70.2% of patients with high disease activity at baseline as
assessed by a DAS28 of greater than 5.1. In spite of this
high activity, there were 40.4% and 43.7% of good
responders at 3 and 6 months, respectively, and only
22.5% and 21.8% of non-responders at 3 and 6 months,
respectively. The percentages of responders and non-
responders were similar in the two studies. In contrast,
the proportion of patients treated with each of the three
anti-TNF drugs was different (Table 1). In our cohort,
most patients were treated with infliximab (66.9%), fol-
lowed by etanercept (23.2%) and adalimumab (9.9%).
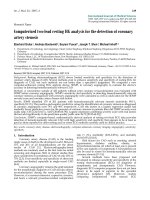
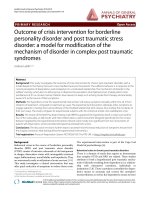
We also checked that there was a good correlation
between the variable used as primary outcome in our
analysis, r elDAS28, and the EULAR response classifica-
tion (Figure 1), allowing for consistency in the analyses.
The relationship between the SNP genotypes and
response to anti-TNF treatment at 3 months was evalu-
ated by linear regression analysis between the genotypes
and the continuous variable relDAS28. There was no
associationofanyofthe16SNPswithrelDAS28at3
months (Table 2). Secondary analyses showed very simi-
lar results. Comparison of non-responders with good
responders according to the EULAR criteria at 3 months
did not show any significant association (Table 2). The
Table 1 Clinical characteristics of the patients in this study and of those in the report by Liu and colleagues [7]
Variable This study Data from [7] P value
Age in years, mean ± SD 54.2 ± 13.1 57 ± 13.5 0.06
Age in years at diagnosis, mean ± SD 46.2 ± 13.5 47 ± 15 0.3
Women, percentage 84.8 75 0.06
Disease duration in years, mean ± SD 7.8 ± 6.6 8 ± 8 0.4
Current smokers, percentage
a
9.1 15 0.3
Ever smokers, percentage
a
25.0
Rheumatoid factor-positive, percentage 68.9 83.8 0.01
Anti-CCP-positive, percentage
a
86.3 61.9 0.0001
Shared epitope-positive, percentage
a
58.3
Antinuclear antibody-positive, percentage
a
29.8
HAQ at baseline, mean ± SD 1.4 ± 0.7 1.1 ± 0.6 0.0005
DAS28 at baseline, mean ± SD 5.6 ± 1.2 5.2 ± 0.8 0.002
DAS28 ≥ 5.1, percentage 70.2
3.2 ≤ DAS28 > 5.1, percentage 26.5
DAS28 at 12 to 16 weeks, mean ± SD 3.6 ± 1.4 3.7 ± 1.3 0.2
DAS28 at 6 months, mean ± SD 3.5 ± 1.4
Good responders at 12 to 16 weeks, percentage 40.4 34.8 0.6
Non-responders at 12 to 16 weeks, percentage 22.5 25.8 0.6
Good responders at 6 months, percentage 43.7
Non-responders at 6 months, percentage 21.8
Anti-tumor necrosis factor drug
Infliximab, number 101 32 0.01
Etanercept, number 35 39 0.02
Adalimumab, number 15 18 0.05
a
Data were available for 102 patients for anti-cyclic citrullinated peptide (CCP) antibodies, antinuclear antibody, and shared epitope and for 88 patients for
smoking habits. DAS28, disease activity score using 28 joint counts; HAQ, health assessment questionnaire; SD, standard deviation.
Suarez-Gestal et al. Arthritis Research & Therapy 2010, 12:R72
/>Page 3 of 6
most extr eme OR (1.9, 95% CI 1.0 to 3.6) corresponded
to rs437943 in the CNTDE1 locus but compared poorly
with the previously reported OR (4.6, 95% CI 1.8 to
12.3). In addition, there was no association of relDAS28
with any of the 16 SNPs at 6 months or of the classifica-
tion in responders and non-responders (Additional file
2). Finally, analysis of patients treated with infliximab,
which represented 66.9% of our study, did not show any
significant association between response and the SNPs
(Additional file 2). Because of the small number o f
patients in the etanercept or adalimumab subgroups, no
separate analyses of response to treatment wer e done.
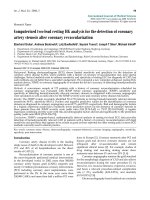
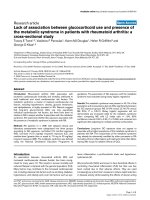
We also visually explored whether joint consideration of
the 16 SNPs was able to discriminate between the differ-
ent groups of patients according to their response to
treatment, but patients with different responses did not
show any clustering in identifiable groups in this analy-
sis (Figure 2).
To interpret the above results, it was critical to assess
whether our study had enough statistical power to
replicate the previously reported associations. Power
for the weakest association in the GWAS, which cor-
responds to rs928655 (P =3×10
-5
), was larger than
95% for a P value of 0.002. It is important to remark
that ORs from the GWAS are very likely heavily
biased upwards as a consequence of the winner’ s
curse affecting any GWAS and especially those of
small size [17,18]. Therefore, this power estimate is
valuable only in the context of the reported ORs
taken at face value.
Table 2 Relationship of relDAS28 and single-nucleotide polymorphism genotypes and comparison of allele frequencies
between responders and non-responders
Single-nucleotide
polymorphisms
P value of
relDAS28
MAF of responders,
percentage (n/N)
MAF of non-responders,
percentage (n/N)
OR
a
(95%
CI)
P value
rs983332 0.6 25.9 (30/116) 27.9 (19/68) 1.11 (0.6-2.0) 0.8
rs928655 0.1 18.9 (23/122) 28.0 (19/68) 0.60 (0.3-1.2) 0.1
rs13393173 0.8 23.8 (29/122) 20.6 (14/68) 0.83 (0.4-1.7) 0.6
rs437943 0.05 38.5 (47/122) 25.0 (17/68) 0.53 (0.3-1.0) 0.06
rs10945919 0.7 27.9 (34/122) 23.5 (16/68) 0.79 (0.4-1.7) 0.5
rs854547 0.3 39.3 (48/122) 36.8 (25/68) 1.12 (0.6-2.1) 0.7
rs854548 0.9 23.0 (28/122) 23.5 (16/68) 1.03 (0.5-2.0) 0.9
rs854555 0.6 35.2 (43/122) 38.2 (26/68) 1.14 (0.6-2.0) 0.7
rs868856 0.6 32.8 (40/122) 36.8 (25/68) 1.19 (0.6-2.0) 0.6
rs7046653 0.5 32.0 (39/122) 36.8 (25/68) 1.23 (0.7-2.5) 0.5
rs2814707 0.8 25.4 (31/122) 29.4 (20/68) 1.22 (0.6-2.5) 0.6
rs3849942 0.4 23.0 (28/122) 29.4 (20/68) 1.41 (0.7-2.5) 0.3
rs774359 0.2 26.2 (32/122) 36.8 (25/68) 1.64 (0.8-3.3) 0.1
rs6138150 0.5 14.0 (17/122) 14.7 (10/68) 0.94 (0.4-2.2) 0.9
rs6028945 0.9 12.3 (15/122) 13.2 (9/68) 1.09 (0.5-2.5) 0.9
rs6071980 0.9 18.9 (23/122) 16.2 (11/68) 0.83 (0.4-2.0) 0.6
a
Odds ratios (ORs) were calculated as in Liu and colleagues [7], taking the allele associated with the non-responders in that report as the nume rator of the odds,
and the non-responder odds as the numerator of the OR. CI, confidence interval; MAF, minor allele frequency; n, number of minor alleles; N, total numberof
alleles; relDAS28, relative change in disease activity score using 28 joint counts between baseline and time of evaluation.
Figure 1 Good correlation between outcome variables: EULAR
(European League Against Rheumatism) response classification
and relDAS28. Medians, interquartile ranges, and non-outlier ranges
are represented as dots, boxes, and whiskers, respectively. Empty
dots represent outliers. relDAS28, relative change in disease activity
score using 28 joint counts between baseline and time of
evaluation.
Suarez-Gestal et al. Arthritis Research & Therapy 2010, 12:R72
/>Page 4 of 6
Discussion
There is a great need of good predictors for RA
response to the anti-TNF treatments [1-3,9]. The devel-
opme nt and approval of new effective drugs for RA add
to this urgency [3]. The recent GWAS from Liu and
colleagues [7] was especially remarkable because it
showed such strong associations that, according to pub-
lished simulations [11], they could be used for predic-
tion in individual patients. This is a characteristic that
has not been found in any of the previous studies. How-
ever, the siz e of t he study implied that results should be
replicated before they could be taken at face v alue, as
already acknowledged by the authors. We have tried to
provide here the needed replication in the expectation
that some of them will be confirmed and that validation
in prospective studies will soon follow.
Unfortunately, in spite of the moderately larger sample
size of our study and the corresponding very good
power to detect this type of strong association, none of
the associations was replicated. These results make it
very unlikely that any of the 16 SNPs could have an
association as strong as suggested by the previous
GWAS [7]. It is possible that the differences between
the patients with RA in the two studies could have ha d
an effect on the lack of replication, but these differences
were not large eno ugh to completely explain the very
divergent results. In addition, patients in the GWAS
were predominantly of European ancestry as were all of
the patients in our study. The refore, it seems more
likely that the original strong associations were due to
random variation of allele frequencies in a study includ-
ing more than 300,000 SNPs and to the heavy bias char-
acteristic of GWASs of small sample size [17,18]. This
possibilitywasalreadyconsideredbyusbeforebegin-
ning this st udy, but w e judged that some SNPs would
be replicated given that they showed low P values, five
of them with P values of less than 10
-6
[7], and low P
values are the best indication of the reproducibility of
results [19].
Conclusions
Our negati ve results imply that we still do not have any
strong evidence supporting a significant role of genetic
variation in the response to anti-TNF treatments. In
addition , our results imply that none of the SNPs in our
study will be useful a s individual predictors of response
to anti-TNF therapy, but do not exclude a weaker
association.
Additional file 1: Primers and probes used for genotyping. List of
primers and probes used for genotyping the 16 SNPs included in the
study.
Additional file 2: Details of some comparisons of response to
treatment. A table a table with the analyses done after 6 months of
treatment and a table with the results of analyzing treatment response
of patients receiving Infliximab at 3 months.
Acknowledgements
We thank Carmen Pena-Pena for her excellent technical assistance and
Yolanda Lopez-Golan for her help in recruiting patients. MS-G is the
recipient of an FPU predoctoral bursary of the Spanish Ministry of Education.
MC is the recipient of an ‘Isabel Barreto’ bursary of the government of
Galicia. This project was supported by an unrestricted grant from Roche
Spain and by grants PI080744 and PI09/90744 from the Instituto de Salud
Carlos III (Spain) with participation of funds from FEDER (European Union).
Abbreviations
anti-TNF: anti-tumor necrosis factor; CI: confidence interval; DA S28: disease
activity score using 28 joint counts; EULAR: European League Against
Rheumatism; GWAS: genome-wide association study; HAQ: health
assessment questionnaire; OR: odds ratio; RA: rheumatoid arthritis; relDAS28:
relative change in disease activity score using 28 joint counts between
baseline and time of evaluation; SNP: single-nucleotide polymorphism; TNF:
tumor necrosis factor.
Competing interests
Roche Spain (Madrid, Spain) contributed to the funding of this project.
However, the company had no input in the design of the study, the
analysis, or the writing of the manuscript. The company did not have the
right to early access to results or the right to interfere in any other way with
the interpretation or reporting of the results. Therefore, the authors take
exclusive and complete responsibility for the study.
Authors’ contributions
MS-G participated in the design of the study, genotyped the samples, and
participated in the interpretation of the results and in writing the
manuscript. EP-P participated in the acquisition of clinical data and
collection of samples and in the analysis and interpretation of results. MC
Figure 2 Multivariate visual analysis showing that 16 singl e-
nucleotide polymorphisms were not able to separate
rheumatoid arthritis patients classified according to their
EULAR (European League Against Rheumatism) response.
Responders are represented as blue dots, moderate responders as
red dots, and non-responders as green dots. Yellow arrows
represent the genotypes of each of the 16 single-nucleotide
polymorphisms according to an additive model. This representation
was obtained with Visual Co-Plot.
Suarez-Gestal et al. Arthritis Research & Therapy 2010, 12:R72
/>Page 5 of 6
participated in the statistical analysis and in the interpretation of results. JJG-
R coordinated the acquisition of clinical data and participated in the analysis
and interpretation of results. AG participated in the design of the study and
in the coordination of acquisition of clinical data and collection of samples
and supervised genotyping, statistical analysis, interpretation of results, and
writing of the manuscript. All authors read and approved the final
manuscript.
Author details
1
Laboratorio Investigacion 10 and Rheumatology Unit, Instituto de
Investigacion Sanitaria-Hospital Clinico Universitario de Santiago, Travesia
Choupana sn., Santiago de Compostela, 15706, Spain.
2
Department of
Medicine, University of Santiago de Compostela, San Francisco sn., Santiago
de Compostela, 15782, Spain.
Received: 15 December 2009 Revised: 16 February 2010
Accepted: 27 April 2010 Published: 27 April 2010
References
1. Chen YF, Jobanputra P, Barton P, Jowett S, Bryan S, Clark W, Fry-Smith A,
Burls A: A systematic review of the effectiveness of adalimumab,
etanercept and infliximab for the treatment of rheumatoid arthritis in
adults and an economic evaluation of their cost-effectiveness. Health
Technol Assess 2006, 10:1-229.
2. Moreland LW, Emery P: TNF[alpha]-inhibition in the treatment of
rheumatoid arthritis. London: Martin Dunitz 2003.
3. Rubbert-Roth A, Finckh A: Treatment options in patients with rheumatoid
arthritis failing initial TNF inhibitor therapy: a critical review. Arthritis Res
Ther 2009, 11(Suppl 1):S1.
4. Carmona L, Descalzo MA, Perez-Pampin E, Ruiz-Montesinos D, Erra A,
Cobo T, Gomez-Reino JJ: All-cause and cause-specific mortality in
rheumatoid arthritis are not greater than expected when treated with
tumour necrosis factor antagonists. Ann Rheum Dis 2007, 66:880-885.
5. Dixon WG, Watson KD, Lunt M, Hyrich KL, Silman AJ, Symmons DP:
Reduction in the incidence of myocardial infarction in patients with
rheumatoid arthritis who respond to anti-tumor necrosis factor alpha
therapy: results from the British Society for Rheumatology Biologics
Register. Arthritis Rheum 2007, 56:2905-2912.
6. Finckh A, Liang MH, van Herckenrode CM, de Pablo P: Long-term impact
of early treatment on radiographic progression in rheumatoid arthritis: a
meta-analysis. Arthritis Rheum 2006, 55:864-872.
7. Liu C, Batliwalla F, Li W, Lee A, Roubenoff R, Beckman E, Khalili H, Damle A,
Kern M, Furie R, Dupuis J, Plenge RM, Coenen MJ, Behrens TW, Carulli JP,
Gregersen PK: Genome-wide association scan identifies candidate
polymorphisms associated with differential response to anti-TNF
treatment in rheumatoid arthritis. Mol Med 2008, 14:575-581.
8. Maxwell JR, Potter C, Hyrich KL, Barton A, Worthington J, Isaacs JD,
Morgan AW, Wilson AG: Association of the tumour necrosis factor-308
variant with differential response to anti-TNF agents in the treatment of
rheumatoid arthritis. Hum Mol Genet 2008, 17:3532-3538.
9. Skapenko A, Prots I, Schulze-Koops H: Prognostic factors in rheumatoid
arthritis in the era of biologic agents. Nat Rev Rheumatol 2009, 5:491-496.
10. Plenge RM, Criswell LA: Genetic variants that predict response to anti-
tumor necrosis factor therapy in rheumatoid arthritis: current challenges
and future directions. Curr Opin Rheumatol 2008, 20:145-152.
11. Janssens AC, Moonesinghe R, Yang Q, Steyerberg EW, van Duijn CM,
Khoury MJ: The impact of genotype frequencies on the clinical validity
of genomic profiling for predicting common chronic diseases. Genet Med
2007, 9:528-535.
12. Prevoo ML, van’t Hof MA, Kuper HH, van Leeuwen MA, Putte van de LB,
van Riel PL: Modified disease activity scores that include twenty-eight-
joint counts. Development and validation in a prospective longitudinal
study of patients with rheumatoid arthritis. Arthritis Rheum 1995, 38:44-48.
13. van Gestel AM, Prevoo ML, van’t Hof MA, van Rijswijk MH, Putte van de LB,
van Riel PL: Development and validation of the European League
Against Rheumatism response criteria for rheumatoid arthritis.
Comparison with the preliminary American College of Rheumatology
and the World Health Organization/International League Against
Rheumatism Criteria. Arthritis Rheum 1996, 39:34-40.
14. Bravata DM, Shojania KG, Olkin I, Raveh A: CoPlot: a tool for visualizing
multivariate data in medicine. Stat Med 2008, 27:2234-2247.
15. The Visual Co-Plot Homepage. [ />index.html].
16. Faul F, Erdfelder E, Lang AG, Buchner A: G*Power 3: a flexible statistical
power analysis program for the social, behavioral, and biomedical
sciences. Behav Res Methods 2007, 39:175-191.
17. Ioannidis JP: Why most discovered true associations are inflated.
Epidemiology 2008, 19:640-648.
18. Xiao R, Boehnke M: Quantifying and correcting for the winner’s curse in
genetic association studies. Genet Epidemiol 2009, 33:453-462.
19. Todd JA: Statistical false positive or true disease pathway? Nat Genet
2006, 38:731-733.
doi:10.1186/ar2990
Cite this article as: Suarez-Gestal et al.: Lack of replication of genetic
predictors for the rheumatoid arthritis response to anti-TNF treatments:
a prospective case-only study. Arthritis Research & Therapy 2010 12:R72.
Submit your next manuscript to BioMed Central
and take full advantage of:
• Convenient online submission
• Thorough peer review
• No space constraints or color figure charges
• Immediate publication on acceptance
• Inclusion in PubMed, CAS, Scopus and Google Scholar
• Research which is freely available for redistribution
Submit your manuscript at
www.biomedcentral.com/submit
Suarez-Gestal et al. Arthritis Research & Therapy 2010, 12:R72
/>Page 6 of 6