Microsoft Excel 2010 Data Analysis and Business Modeling phần 1 ppt
Bạn đang xem bản rút gọn của tài liệu. Xem và tải ngay bản đầy đủ của tài liệu tại đây (2.29 MB, 68 trang )
PUBLISHED BY
M crosoft Press
A D v s on of M crosoft Corporat on
One M crosoft Way
Redmond, Wash ngton 98052-6399
Copyr ght © 2011 by Wayne L W nston
A r ghts reserved No part of the contents of th s book may be reproduced or transm tted n any form or by any
means w thout the wr tten perm ss on of the pub sher
L brary of Congress Contro Number 2010934987
ISBN 978-0-7356-4336-9
Pr nted and bound n the Un ted States of Amer ca
M crosoft Press books are ava ab e through bookse ers and d str butors wor dw de For further nfor mat on
about nternat ona ed t ons, contact your oca M crosoft Corporat on off ce or contact M crosoft Press
Internat ona d rect y at fax (425) 936-7329 V s t our Web s te at www m crosoft com/mspress Send comments to
msp nput@m crosoft com
M crosoft and the trademarks sted at http //www m crosoft com/about/ ega /en/us/Inte ectua Property/
Trademarks/EN-US aspx are trademarks of the M crosoft group of compan es A other marks are property of
the r respect ve owners
The examp e compan es, organ zat ons, products, doma n names, e-ma addresses, ogos, peop e, p aces, and
events dep cted here n are ct t ous No assoc at on w th any rea company, organ zat on, product, doma n name,
e-ma address, ogo, person, p ace, or event s ntended or shou d be nferred
Th s book expresses the author’s v ews and op n ons The nformat on conta ned n th s book s prov ded w thout
any express, statutory, or mp ed warrant es Ne ther the authors, M crosoft Corporat on, nor ts rese ers, or
d str butors w be he d ab e for any damages caused or a eged to be caused e ther d rect y or nd rect y by
th s book
Acquisitions Editor: Rosemary Caperton
Developmental Editor: Devon Musgrave
Project Editor: Rosemary Caperton
Editorial and Production: John P erce and Waypo nt Press
Technical Reviewer: M tch Tu och; Techn ca Rev ew serv ces prov ded by Content Master,
a member of CM Group, Ltd
Cover: Tw st
Body Part No X17-37446
15 Three-Dimensional Formulas 117
16 The Auditing Tool 121
17 Sensitivity Analysis with Data Tables 127
18 The Goal Seek Command 137
19 Using the Scenario Manager for Sensitivity Analysis 143
20 The COUNTIF, COUNTIFS, COUNT, COUNTA, and
COUNTBLANK Functions 149
21 The SUMIF, AVERAGEIF, SUMIFS, and AVERAGEIFS
Functions
157
22 The OFFSET Function 163
23 The INDIRECT Function 177
24 Conditional Formatting 185
25 Sorting in Excel 209
26 Tables 217
27 Spin Buttons, Scroll Bars, Option Buttons, Check Boxes,
Combo Boxes, and Group List Boxes 229
28 An Introduction to Optimization with Excel Solver 241
29 Using Solver to Determine the Optimal Product Mix 245
30 Using Solver to Schedule Your Workforce 255
31 Using Solver to Solve Transportation or Distribution
Problems
261
32 Using Solver for Capital Budgeting 267
33 Using Solver for Financial Planning 275
34 Using Solver to Rate Sports Teams 281
Table of Contents v
35 Warehouse Location and the GRG Multistart and
Evolutionary Solver Engines
287
36 Penalties and the Evolutionary Solver 297
37 The Traveling Salesperson Problem 303
38 Importing Data from a Text File or Document 307
39 Importing Data from the Internet 313
40 Validating Data 319
41 Summarizing Data by Using Histograms 327
42 Summarizing Data by Using Descriptive Statistics 335
43 Using PivotTables and Slicers to Describe Data 349
44 Sparklines 381
45 Summarizing Data with Database Statistical Functions 387
46 Filtering Data and Removing Duplicates 395
47 Consolidating Data 411
48 Creating Subtotals 417
49 Estimating Straight Line Relationships 423
50 Modeling Exponential Growth 431
51 The Power Curve 435
52 Using Correlations to Summarize Relationships 441
53 Introduction to Multiple Regression 447
54 Incorporating Qualitative Factors into Multiple
Regression
453
55 Modeling Nonlinearities and Interactions 463
vi Table of Contents
56 Analysis of Variance: One-Way ANOVA 471
57 Randomized Blocks and Two-Way ANOVA 477
58 Using Moving Averages to Understand Time Series 487
59 Winters’s Method 491
60 Ratio-to-Moving-Average Forecast Method 497
61 Forecasting in the Presence of Special Events 501
62 An Introduction to Random Variables 509
63 The Binomial, Hypergeometric, and Negative Binomial
Random Variables 515
64 The Poisson and Exponential Random Variable 523
65 The Normal Random Variable 527
66 Weibull and Beta Distributions: Modeling Machine Life
and Duration of a Project
535
67 Making Probability Statements from Forecasts 541
68 Using the Lognormal Random Variable to Model
Stock Prices
545
69 Introduction to Monte Carlo Simulation 549
70 Calculating an Optimal Bid 559
71 Simulating Stock Prices and Asset Allocation Modeling 565
72 Fun and Games: Simulating Gambling and Sporting
Event Probabilities
575
73 Using Resampling to Analyze Data 583
74 Pricing Stock Options 587
75 Determining Customer Value 601
Introduction
Whether you work for a Fortune 500 corporation, a small company, a government agency,
or a not-for-prot organization, if you’re reading this introduction the chances are you use
Microsoft Excel in your daily work. Your job probably involves summarizing, reporting, and
analyzing data. It might also involve building analytic models to help your employer increase
prots, reduce costs, or manage operations more efciently.
Since 1999, I’ve taught thousands of analysts at organizations such as 3M, Bristol-Myers
Squibb, Cisco Systems, Drugstore.com, eBay, Eli Lilly, Ford, General Electric, General Motors,
Intel, Microsoft, NCR, Owens Corning, Pzer, Proctor & Gamble, Tellabs, the U.S. Army, the
U.S. Department of Defense, and Verizon how to use Excel more efciently and productively
in their jobs. Students have often told me that the tools and methods I teach in my classes
have saved them hours of time each week and provided them with new and improved ap-
proaches for analyzing important business problems. Most of these classes used Excel 2003
or Excel 2007. With the added power of Excel 2010, you can be more productive than you
ever dreamed! To paraphrase Alicia Silverstone in the movie Clueless, Excel 2007 is so ve
years ago.
I’ve used the techniques described in this book in my own consulting practice to solve many
business problems. For example, I use Excel to help the Dallas Mavericks NBA basketball team
evaluate referees, players, and lineups. During the last 15 years I have also taught Excel busi-
ness modeling and data analysis classes to MBA students at Indiana University’s Kelley School
of Business. (As proof of my teaching excellence, I have won MBA teaching awards for 25
consecutive years, and have won the school’s overall MBA teaching award ve times.) I would
like to also note that 95 percent of MBA students at Indiana University take my spreadsheet
modeling class even though it is an elective.
The book you have in your hands is an attempt to make these successful classes available to
everyone. Here is why I think the book will help you learn how to use Excel more effectively:
■
The materials have been tested while teaching thousands of analysts working for
Fortune 500 corporations and government agencies, including the U.S. Army.
■
I’ve written the book as though I am talking to the reader. I hope this approach
transfers the spirit of a successful classroom environment to the written page.
■
I teach by example, which makes concepts easier to master. These examples are
constructed to have a real-world feel. Many of the examples are based on questions
sent to me by employees of Fortune 500 corporations.
■
For the most part, I lead you through the approaches I take in Excel to set up and
answer a wide range of data analysis and business questions. You can follow along with
my explanations by referring to the sample worksheets that accompany each example.
x Introduction
However, I have also included template les for the book’s examples on the companion
website. If you want to, you can use these templates to work directly with Excel and
complete each example on your own.
■
For the most part, the chapters are short and organized around a single concept. You
should be able to master the content of most chapters with at most two hours of study.
By looking at the questions that begin each chapter, you’ll gain an idea about the types
of problems you’ll be able to solve after mastering a chapter’s topics.
■
In addition to learning about Excel formulas, you will learn some important math in
a fairly painless fashion. For example, you’ll learn about statistics, forecasting, opti-
mization models, Monte Carlo simulation, inventory modeling, and the mathemat-
ics of waiting in line. You will also learn about some recent developments in business
thinking, such as real options, customer value, and mathematical pricing models.
■
At the end of each chapter, I’ve provided a group of practice problems (over 600 in
total) that you can work through on your own. These problems will help you master the
information in each chapter. Answers to all problems are included in les on the book’s
companion website. Many of these problems are based on actual problems faced by
business analysts at Fortune 500 companies.
■
Most of all, learning should be fun. If you read this book, you will learn how to predict
U.S. presidential elections, how to set football point spreads, how to determine the
probability of winning at craps, and how to determine the probability of a specic team
winning an NCAA tournament. These examples are interesting and fun, and they also
teach you a lot about solving business problems with Excel.
■
To follow along with this book, you must have Excel 2010. Previous versions of this
book can be used with Excel 2003 or Excel 2007.
What You Should Know Before Reading This Book
To follow the examples in this book you do not need to be an Excel guru. Basically, the two
key actions you should know how to do are the following:
■
Enter a formula You should know that formulas must begin with an equal sign ( ).
You should also know the basic mathematical operators. For example, you should know
that an asterisk (*) is used for multiplication, a forward slash (/) is used for division, and
the caret key (^) is used to raise a quantity to a power.
■
Work with cell references You should know that when you copy a formula that
contains a cell reference such as $A$4 (an absolute cell reference, which is created
by including the dollar signs), the formula still refers to cell A4 in the cells you copy it
to. When you copy a formula that contains a cell reference such as $A4 (a mixed cell
address), the column remains xed, but the row changes. Finally, when you copy a
formula that contains a cell reference such as A4 (a relative cell reference), both the row
and the column of the cells referenced in the formula change.
Introduction xi
How to Use This Book
As you read along with the examples in this book, you can take one of two approaches:
■
You can open the template le that corresponds to the example you are studying
and complete each step of the example as you read the book. You will be surprised
how easy this process is and amazed with how much you learn and retain. This is the
approach I use in my corporate classes.
■
Instead of working in the template, you can follow my explanations as you look at the
nal version of each sample le.
Using the Companion Content
This book features a companion website that makes available to you all the sample les you
use in the book’s examples (both the nal Excel workbooks and starting templates you can
work with on your own). The workbooks and templates are organized in folders named for
each chapter. The answers to all chapter-ending problems in the book are also included with
the sample les. Each answer le is named so that you can identify it easily. For example, the
le containing the answer to Problem 2 in Chapter 10 is named s10 2.xlsx.
To work through the examples in this book, you need to copy the book’s sample les to your
computer. These practice les, and other information, can be downloaded from the book’s
detail page, located at:
207235
Display the detail page in your Web browser, and follow the instructions for downloading
the les.
How to Access Your Online Edition Hosted by Safari
The voucher bound in to the back of this book gives you access to an online edition of the
book. (You can also download the online edition of the book to your own computer; see the
next section.)
To access your online edition, do the following:
1. Locate your voucher inside the back cover, and scratch off the metallic foil to reveal
your access code.
2. Go to />xii Introduction
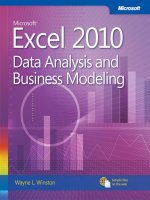
3. Enter your 24-character access code in the Coupon Code eld under Step 1:
(Please note that the access code in this image is for illustration purposes only.)
4. Click the CONFIRM COUPON button.
A message will appear to let you know that the code was entered correctly. If the code
was not entered correctly, you will be prompted to re-enter the code.
5. In the this step, you’ll be asked whether you’re a new or existing user of Safari Books
Online. Proceed either with Step 5A or Step 5B.
5A. If you already have a Safari account, click the EXISTING USER – SIGN IN button
under Step 2.
Introduction xiii
5B. If you are a new user, click the NEW USER – FREE ACOUNT button under Step 2.
❑
You’ll be taken to the “Register a New Account” page.
❑
This will require lling out a registration form and accepting an End User
Agreement.
❑
When complete, click the CONTINUE button.
6. On the Coupon Conrmation page, click the My Safari button.
7. On the My Safari page, look at the Bookshelf area and click the title of the book you
want to access.
How to Download the Online Edition to Your Computer
In addition to reading the online edition of this book, you can also download it to your
computer. First, follow the steps in the preceding section. Then do the following:
1. On the page that appears after Step 7 in the previous section, click the Extras tab.
2. Find “Download the complete PDF of this book,” and click the book title:
xiv Introduction
A new browser window or tab will open, followed by the File Download dialog box:
3. Click Save.
4. Choose Desktop and click Save.
5. Locate the .zip le on your desktop. Right-click the le, click Extract All, and then follow
the instructions.
Note If you have a prob em w th your voucher or access code, p ease contact
, or ca 800-889-8969, where you’ reach O’Re y Med a, d str butor
of M crosoft Press books
Errata and Book Support
We’ve made every effort to ensure the accuracy of this book and its companion content. If
you do nd an error, please report it on our Microsoft Press site at Oreilly.com:
1. Go to .
2. In the Search box, enter the book’s ISBN or title.
3. Select your book from the search results.
4. On your book’s catalog page, under the cover image, you’ll see a list of links.
5. Click View/Submit Errata.
You’ll nd additional information and services for your book on its catalog page. If you need
additional support, please e-mail Microsoft Press Book Support at
Please note that product support for Microsoft software is not offered through the
addresses above.
Introduction xv
We Want to Hear from You
At Microsoft Press, your satisfaction is our top priority, and your feedback our most
valuable asset. Please tell us what you think of this book at:
/>The survey is short, and we read every one of your comments and ideas. Thanks in advance
for your input!
Stay in Touch
Let’s keep the conversation going! We’re on Twitter: />Acknowledgments
I am eternally grateful to Jennifer Skoog and Norm Tonina, who had faith in me and rst
hired me to teach Excel classes for Microsoft nance. Jennifer in particular was instrumen-
tal in helping design the content and style of the classes on which the book is based. Keith
Lange of Eli Lilly, Pat Keating and Doug Hoppe of Cisco Systems, and Dennis Fuller of the U.S.
Army also helped me rene my thoughts on teaching data analysis and modeling with Excel.
I was blessed to work with John Pierce again, who edited the rst edition of the book.
Mitch Tulloch did a great job with the technical editing. Thanks also to Steve Sagman for
managing the book’s production and to proofreader Tom Speeches. Microsoft Press editors
Rosemary Caperton and Devon Musgrave helped shepherd the project to completion.
I am grateful to my many students at the organizations where I’ve taught and at the Kelley
School of Business. Many of them have taught me things I did not know about Excel.
Alex Blanton, formerly of Microsoft Press, championed this project at the start and shared my
vision of developing a user-friendly text designed for use by business analysts.
Finally, my lovely and talented wife, Vivian, and my wonderful children, Jennifer and Gregory,
put up with my long weekend hours at the keyboard.
1
Chapter 1
What’s New in Excel 2010
Microsoft Excel 2010 contains many new features that are helpful to the business analyst,
including these:
■
Customizable ribbon Now you can completely customize the appearance of the
ribbon.
■
Sparklines Cool graphs that summarize lots of data in a single cell.
■
Slicers Dashboard controls that make “slicing and dicing” PivotTable calculations
much easier.
■
PowerPivot A free add-in that enables you to quickly create PivotTables with up to
100 million rows of data based on data from many sources (databases, spreadsheets,
and websites).
■
Solver An improved Solver allows you to nd the “best” solution to many business
problems for which previous versions of the Solver returned incorrect answers.
■
File tab The new File tab on the ribbon replaces the Ofce button and allows easy
access to the File and Print menus.
■
Updated statistical functions The accuracy of Excel statistical functions has
been improved, and several new functions (including RANK.EX, AGGREGATE,
WORKDAY.INTL, and NETWORKDAYS.INTL) have been added.
■
Equations You can now edit equations in Excel by using an equation editor that is
similar to the Microsoft Word equation editor.
■
Data bars Data bars have been improved.
■
Paste Special Paste Special options now include a live preview.
Let’s now examine each of these exciting new features in more detail.
Customizable Ribbon
In Excel 2007, users were not able to customize the tabs displayed across the top of the
ribbon. In Excel 2010, it is easy to customize the appearance of the ribbon tabs. Begin by
selecting File in the upper-left portion of the ribbon. After choosing Options, you’ll see the
Customize Ribbon page shown in Figure 1-1.
2 Microsoft Excel 2010: Data Analysis and Business Modeling
FIGURE 1-1 How to custom ze the r bbon.
As an example, suppose you want to show the Developer tab. Simply select Developer in
the list at the right, and click OK. You can change the order in which the tabs appear by
selecting a tab, and then using the Move Up and Move Down arrows on the right. If you
click the drop-down arrow by Main Tabs, you can display Tool tabs. Then you can customize
the tabs that appear when a given object is selected. For example, if you clear Design under
Chart Tools, when you select a Chart object, the Design tab does not appear. Clicking the
New Tab button allows you to create a new tab, and the New Group button lets you create
a group within a tab. Of course, you can use the Rename button to change the name of a
group or tab.
Don’t Forget About the Quick Access Toolbar
The Quick Access Toolbar is an old friend from Excel 2007 that can still be very useful.
You probably use some Excel commands much more often than others. Having to switch
between tabs to nd the command you need might slow you down. The Quick Access
Toolbar (see Figure 1-2) allows you to collect your favorite commands in one place. The
default location of the Quick Access Toolbar is above the ribbon in the upper-left portion of
the Excel window.
FIGURE 1-2 Qu ck Access Too bar.
Chapter 1 What’s New in Excel 2010 3
You can add a command to the Quick Access Toolbar simply by right-clicking the command
and choosing Add To Quick Access Toolbar. You can also add commands by clicking File in
the upper-left portion of the ribbon. Next click Options, and then display the Customize
the Quick Access Toolbar page (shown in Figure 1-3). After choosing a command you want
to add, select Add, and click OK. Of course, the Move Up and Move Down arrows let you
customize the order in which icons appear. You can remove any command from the Quick
Access Toolbar by right-clicking the command, and then clicking Remove From Quick Access
Toolbar. You can move the Quick Access Toolbar below the ribbon by right-clicking the
toolbar, and selecting Show Below The Ribbon.
FIGURE 1-3 You can add, remove, and arrange commands on the Qu ck Access Too bar.
People sometimes have trouble nding commands that appeared in earlier versions of Excel
but seem to have disappeared from Excel 2010. For example, you might be a fan of the old
method used to create PivotTables: the layout method. If you still want to use the layout
method, you can nd it by clicking the drop-down arrow to the right of Popular Commands
and choosing Commands Not In The Ribbon. After scrolling down (pressing the P key several
times is probably quicker!), you will nd the PivotTable And PivotChart Wizard command,
which you can then add to your Quick Access Toolbar.
4 Microsoft Excel 2010: Data Analysis and Business Modeling
Sparklines
Sparklines are small charts or graphs that t in a single cell. Sparklines let you place a
graphical summary of data next to the data. Figure 1-4 shows how sparklines can summarize
daily customer counts at bank branches.
FIGURE 1-4 Examp e of spark nes.
The sparklines make it clear that each branch is busiest on Monday and Friday. Sparklines are
discussed in Chapter 44, “Sparklines.”
Slicers
PivotTables are probably the single most used tool for summarizing data. PivotTables let you
“slice and dice your data” and are discussed in Chapter 43, “Using PivotTables and Slicers to
Summarize Data.” Excel 2010 allows you to use slicers to control the way you summarize your
data. The Name and Product slicers in Figure 1-5 ensure that total sales for each month are
computed for only the rows of data in which Eric and Rachel sold checking accounts or stock
investment accounts. Slicers are also discussed in Chapter 43.
FIGURE 1-5 Examp e of s cers.
Chapter 1 What’s New in Excel 2010 5
PowerPivot
Organizations often have to create reports based on data from different data sources.
For example, a bank might have customer data for each branch in a separate spreadsheet or
database. The bank might then want to create a corporate summary of total sales based on
the data from the individual branches. In the past, it has been difcult to create PivotTables
from different data sources. PowerPivot is a free add-in for Excel 2010 that allows you to
easily create PivotTables based on data from different websites, spreadsheets, or databases.
Using PowerPivot, you can quickly create PivotTables based on up to 100 million rows
of data! PowerPivot is discussed in Chapter 84.
New Excel Solver
The Excel Solver is used to nd the best way to do something. For example, what is the
cheapest way to meet customer demand by shipping products from factories to customers?
Excel 2010 contains a much improved version of the Solver that allows you to use many im-
portant functions (such as IF, MAX, MIN, and ABS functions) in Solver models. With previous
versions of Excel, use of these functions in a Solver model might cause the Solver to report
an incorrect solution. I discuss the Excel Solver in Chapters 28–37.
File Tab
Excel 2007 introduced the Ofce button. In Excel 2010, the Ofce button has been replaced
by the File tab. The File tab is located at the left end of the ribbon. After selecting File, you
are presented with the choices shown in Figure 1-6.
6 Microsoft Excel 2010: Data Analysis and Business Modeling
FIGURE 1-6 F e tab opt ons.
You can see that the File tab combines the Print and File menus from previous versions of
Excel. Also, selecting Options lets you perform a variety of tasks, such as customizing the
ribbon or the Quick Access Toolbar, or installing add-ins. In Excel 2007 these tasks (except for
customizing the ribbon) were performed after clicking the Ofce button.
New Excel Functions
Many new functions (mostly statistical functions that improve the accuracy of statistical
functions in previous versions) have been added. For example, PERCENTILE.EXC improves the
accuracy of the RANK function. Statistical functions are covered in Chapter 42, “Summarizing
Data by Using Descriptive Statistics,” and Chapters 63–68. The new AGGREGATE function
(see Chapter 12, “IF Statements”) enables calculations to be performed on cell ranges that
contain errors! The new WORKDAY.INTL and NETWORKDAYS.INTL functions
(see Chapter 7,
“Dates and Date Functions”) recognize the fact that non-U.S. workers often get days other
than Saturday and Sunday off from work. The accuracy of many nancial functions (see
Chapter 10, “More Excel Financial Functions”) has also been improved.
Chapter 1 What’s New in Excel 2010 7
New Equation Editor
Many readers of this book are probably long-time users of the Microsoft Word equation
editor. In Excel 2010 you can now create equations in Excel. If you select Insert from the
ribbon, you can then click Equation at the far right to bring up the equation templates shown
in Figure 1-7.
FIGURE 1-7 Equat on ed tor temp ates.
For example, if you want to type an equation involving a summation sign, choose one of the
Large Operator options.
Sometimes you want a well-known equation (such as the quadratic formula) to appear in
your spreadsheet. After choosing Insert, click the drop-down arrow to the right of Equation
to import an already completed equation (such as the quadratic formula). Of course, if after
choosing Insert you select Symbol, you can insert mathematical symbols (such as the Greek
letter µ) into a cell.
Improved Data Bars
Excel 2007 introduced using data bars as a method to summarize numerical data. In Excel
2010 data bars have been improved in two ways:
■
You can choose either Solid Fill or Gradient Fill for shading.
■
Data bars recognize negative numbers.
Figure 1-8 shows an example of how the new data bars appear. Rows 4-11 contain gradient
shading, and rows 12–17 contain solid shading. You’ll nd a complete discussion of data bars
in Chapter 24, “Conditional Formatting.”
8 Microsoft Excel 2010: Data Analysis and Business Modeling
FIGURE 1-8 Examp e of Exce 2010 data bars.
Paste Special Live Preview
If you right-click a range of cells and select Paste Special (see Chapter 14 for a discussion
of the Paste Special command), Excel 2010 brings up a live preview of the possible menu
choices, as shown in Figure 1-9.
FIGURE 1-9 Paste Spec a ve prev ew.
Clicking an option lets you see a preview of how your spreadsheet will appear if you choose
that option.
9
Chapter 2
Range Names
Questions answered in this chapter:
■
I want to total sales in Arizona, California, Montana, New York, and New Jersey. Can I
use a formula to compute total sales in a form such as AZ+CA+MT+NY+NJ instead of
SUM(A21:A25) and still get the right answer?
■
What does a formula like Average(A:A) do?
■
What is the difference between a name with workbook scope and one with worksheet
scope?
■
I really am getting to like range names. I have started dening range names for many
of the workbooks I have developed at the ofce. However, the range names do not
show up in my formulas. How can I make recently created range names show up in
previously created formulas?
■
How can I paste a list of all range names (and the cells they represent) into my
worksheet?
■
I am computing projected annual revenues as a multiple of last year’s revenue. Is there
a way to have the formula look like (1+growth)*last year?
■
For each day of the week we are given the hourly wage and hours worked. Can we
compute total salary for each day with the formula wages*hours?
You have probably worked with worksheets that use formulas such as SUM(A5000:A5049).
Then you have to nd out what’s contained in cells A5000:A5049. If cells A5000:A5049
contain sales in each U.S. state, wouldn’t the formula SUM(USSales) be easier to understand?
In this chapter, I’ll teach you how to name individual cells or ranges of cells. I’ll also show you
how to use range names in formulas.
How Can I Create Named Ranges?
There are three ways to create named ranges:
■
By entering a range name in the Name box.
■
By clicking Create From Selection in the Dened Names group on the Formulas tab.
■
By clicking Name Manager or Dene Name in the Dened Names group on the
Formulas tab.
10 Microsoft Excel 2010: Data Analysis and Business Modeling
Using the Name Box to Create a Range Name
The Name box (shown in Figure 2-1) is located directly above the label for column A. (To see
the Name box, you need to display the Formula bar.) To create a range name in the Name
box, simply select the cell or range of cells that you want to name, click in the Name box, and
then type the range name you want to use. Press Enter, and you’ve created the range name.
Clicking the Name arrow displays the range names dened in the current workbook. You can
display all the range names in a workbook by pressing the F3 key to open the Paste Name
dialog box. When you select a range name from the Name box, Microsoft Excel 2010 selects
the cells corresponding to that range name. This enables you to verify that you’ve chosen the
cell or range that you intended to name. Range names are not case sensitive.
FIGURE 2-1 You can create a range name by se ect ng the ce range you want to name and then typ ng the
range name n the Name box.
For example, suppose you want to name cell F3 east and cell F4 west. See Figure 2-2 and the
le Eastwest.xlsx. Simply select cell F3, type east in the Name box, and then press Enter. Then
select cell F4, type west in the Name box, and press Enter. If you now reference cell F3 in
another cell, you see east instead of F3. This means that whenever you see the reference
east in a formula, Excel will insert whatever is in cell F3.
FIGURE 2-2 Nam ng ce F3 east and ce F4 west.
Suppose you want to assign a rectangular range of cells (such as A1:B4) the name Data.
Simply select the cell range A1:B4, type Data in the Name box, and press Enter. Now a
formula such as AVERAGE(Data) would average the contents of cells A1:B4. See the le
Data.xlsx and Figure 2-3.
FIGURE 2-3 Nam ng range A1:B4 Data.