Báo cáo y học: "Airway resistance at maximum inhalation as a marker of asthma and airway hyperresponsiveness" doc
Bạn đang xem bản rút gọn của tài liệu. Xem và tải ngay bản đầy đủ của tài liệu tại đây (380.37 KB, 8 trang )
RESEARC H Open Access
Airway resistance at maximum inhalation
as a marker of asthma and airway
hyperresponsiveness
Nancy T Mendonça
1
, Jennifer Kenyon
1
, Adam S LaPrad
1
, Sohera N Syeda
2
, George T O’Connor
2
and
Kenneth R Lutchen
1*
Abstract
Background: Asthmatics exhibit reduced airway dilation at maximal inspiration, likely due to structural differences
in airway walls and/or functional diffe rences in airway smooth muscle, factors that may also increase airway
responsiveness to bronchoconstricting stimuli. The goal of this study was to test the hypothesis that the minimal
airway resistance achievable during a maximal inspiration (R
min
) is abnormally elevated in subjects with airway
hyperresponsiveness.
Methods: The R
min
was measured in 34 nonasthmatic and 35 asthmatic subjects using forced oscillations at 8 Hz. R
min
and spirometric indices were measured before and after bronchodilation (albuterol) and bronchoconstriction
(methacholine). A preliminary study of 84 healthy subjects first established height dependence of baseline R
min
values.
Results: Asthmatics had a higher baseline R
min
% predicted than nonasthmatic subjects (134 ± 33 vs. 109 ± 19 %
predicted, p = 0.0004). Sensitivity-specificity analysis using receiver operating characteristic curves indicated that
baseline R
min
was able to identify subjects with airway hyperresponsiveness (PC
20
< 16 mg/mL) better than most
spirometric indices (Area under curve = 0.85, 0.78, and 0.87 for R
min
% predicted, FEV
1
% predicted, and FEF
25-75
%
predicted, respectively). Also, 80% of the subjects with baseline R
min
< 100% predicted did not have airway
hyperresponsiveness while 100% of subjects with R
min
> 145% predicted had hyperresponsive airways, regardless
of clinical classification as asthmatic or nonasthmatic.
Conclusions: These findings suggest that baseline R
min
, a measurement that is easier to perform than spirometry,
performs as well as or better than standard spirometric indices in distinguishing subjects with airway
hyperresponsiveness from those without hyperresponsive airways. The relationship of baseline R
min
to asthma and
airway hyperresponsiveness likely reflects a causal relation between conditions that stiffen airway walls and
hyperresponsiveness. In conjunction with symptom history, R
min
could provide a clinically useful tool for assessing
asthma and monitoring response to treatment.
Background
Structural alterations in asthma include inflammation,
increased airway smooth muscle mass, and increased air-
way wall thickening [1]. These are not easily assessed in
patients, so clinicians rely on functional measurements
such as spirometry and tests of airway hyperresponsiveness
to assess the presence and control of asthma. Another
characteristic of asthma is higher airway resistance at
maximal inspiration compared to nonasthmatics. Jensen
and co-workers [2] used the minimum resistance
achieved at maximum inspiration (Rmin) as representing
the maximum airway dilation achievable (averaged over
the entire lung) by a subject. They showed that Rmin was
abnormally high (i.e., less ability to dilate the airway tree)
in asthmatic versus nonasthmatic subjects [2]. Salome
and co-workers confirmed the reduc ed ability of asth-
matics to dilate after deep inspiration and also showed
that the magnitude of dilation was negatively correlated
* Correspondence:
1
Department of Biomedical Engineering, 44 Cummington St., Boston
University, Boston, MA 02215, USA
Full list of author information is available at the end of the article
Mendonça et al. Respiratory Research 2011, 12:96
/>© 2011 Mendonça et al; licensee BioMed Central Ltd. This is an Open Acce ss article distributed under the terms of the Creative
Commons Attribution License ( which permits unr estricted use, distribution, and
reproduction in any medium, provided the original work is properly cited.
with re-narrowing in nonasthmatics [3]. Black and co-
workers [4] showed that respirat ory system resistance
(R
rs
) measured noninvasively by forced oscillation at
maximal inspiration represented the same Rmin as in the
Jensen study because the chest wall does not contribute
to R
rs
at maximum inspiration. These studies attributed
the reduced dilation seen in asthmatics at maximum
inspiration to increased stiffness of airway smooth muscle
(ASM), reflecting structural characteristics such as hyper-
trophy and a more contractile state of ASM that may be
associated with airway hyperresponsiveness, which is a
defining characteristic of asthma.
The goal of this study was to test the hypothesis that
the minimal airway resistance achievable during a maxi-
mal inspiration (R
min
) is abnormally elevated in subjects
with airway hyperresponsiveness. To test this hypothesis,
we measured R
rs
in nonasthmatic and asthmatic adults
during tidal breathing and a t maximal inspiration at
baseline, following albuterol-induced bronchodilation,
and following methacholine-induced bronchoconstric-
tion. Because airway resistance is related to height, we
examined the relationship of R
min
to height in nonasth-
matic volunteers so that R
min
couldbeanalyzedasa
percent of the predicted value. In addition, we compared
R
min
to spirometric indices in terms of their relationship
to methacholine airway responsiveness. If R
min
measured
by forced oscillation accurately reflects airway hyperre-
sponsiveness and structural abnormalities associated
with airflow limitation, it may provide a valuable clinical
test to help assess the presence and co ntrol of asthma
that is easier to perform than spirometry.
Methods
Subjects
Participants were recruited by advertisement. Asthmatic
participants (n = 35) had a clinical diagnosis of asthma
and were taking inhaled bronchodilator. Nonasthmatic
subjects (n = 34) denied any history of respiratory symp-
toms or diagnoses. Participant s in both groups were
required to have less than 10 pack-years of tobacco
smoking. In a substudy to determine the height depen-
dence of resistance measurements, we recruited 84 addi-
tional nonasthmatic participants who denied smoking,
occupational exposure to smoke or dust, respiratory
symptoms, and any respiratory disease history. All sub-
jects provided informed consent, and this research was
conducted in compliance with the Helsinki Declaration.
This study was approved by Boston University Medical
Center IRB, Protocol H-25546, and Bosto n University
Charles River Campus IRB, File 1765E.
Experimental Protocol
Asthmatic subjects withheld short- and long-acting
bronchodilators 6 and 24 hours, respectively, prior to
study visits. All subjects attended two test days at least
24 hours apart. On day 1, the forced oscillation system
described below was used to measure end-inspiratory
R
rs
during tidal breathing and R
min
at maximum inspira-
tion. Subjects took six tidal breaths followed by a slow
maximum inspiration followed by a passive exhalation
and six more tidal breaths. The procedure was repeated.
Subjects then perfo rmed spirometry. After baseline stu-
dies, subjects inhaled two inhalations of albuterol
metered-dose inhaler 90 μg/inhalation via spacer. Forced
oscillation and spirometry measurements were repeated
after 10 minutes.
Onday2,baselinemeasurementsofR
min
and spiro-
metry were obtained, followed by methacholine chal-
lenge. Methacholine (Provocholine
®
,Methapharm,
Canada) was administered in the following concentra-
tions: 0.098, 0.195, 0.391, 0.781, 1.563, 3.215, 6.25, 12.5,
and 25 mg/ml. Other than this concentration schedule,
testing was performed in accordance with current ATS
recommend ations using the 5-breath dosimeter protocol
[5] using equipment described below. At the conclusion
ofthechallenge(i.e.whena20%declineinFEV1
occurred or after the final dose of 25 mg/ml, whichev er
came first), R
min
was measured again, and then 2 inhala-
tions of albuterol were administered. Spirometry and
R
min
measurements were r epeate d 10 minutes after
albuterol administration.
In the samp le of nonast hmatics studied to establish
the relationship of R
min
to heigh t, only R
min
and height
were measured.
Measurement of R
rs
We measured R
rs
as previously described [4]. Briefly, a
12-in diameter subwoofer delivers an 8 H z oscillation,
with amplitude of ± 1 cmH
2
0, superimposed on spont a-
neous breathing. Jensen and co-workers [2] showed that
because soft-tissue is viscoelastic, it has a tissue resis-
tance that decreases hyperbolically w ith frequency and
that by 8 Hz the lung tissue resistance is negligible and
the chest-wall tissue resistance is at its minimum. A
three-way valve allows the subject to breathe fresh air
through a high-inertance tube. Flow at the airway open-
ing is measured by a pneumotachograph (4700 Series,
Hans Rudo lph, Kansas City, MO) connected to a differ-
ential pressure transdu cer (ATD02AS, SCIREQ, Mon-
treal, QC). Pressure at the airway opening is recorded
with a differential pressure transducer (ATD5050,
SCIREQ).Thesepressureandflowsignalsaretrans-
mitted through demodulator circuits and then to a 10
Hz low-pass filter (S/N 980987, SCIREQ). The filtered
signals are sampled at 40 Hz and stored digitally by Lab-
View (National Instruments, Austin, TX). Pressure and
flow data were separately low- and high-passed filtered
using Matlab software (Natick, MA) at a c ut-off
Mendonça et al. Respiratory Research 2011, 12:96
/>Page 2 of 8
frequency of 4 Hz. The signals w ere processed using a
recursive least squares algorithm, described previously
[2], to estimate R
rs
eight times per second. Minimum
airway resistance, R
min
,wasderivedasR
rs
at max imum
inspiration.
The system used in the substudy of nonasthmatic sub-
jects (n = 84) conducted to determine n ormative pre-
dicted values for R
min
differed only in its differential
pressure transducers (Model LCRV, CELESCO, Chats-
worth, CA) and had a 1% error from the system used in
the main study.
Spirometry and methacholine challenge methods
Spirometry measurements were made with an integrated
spirometer-dosimeter sy stem (KoKoDigidoser
®
spirom-
eter, Ferraris Respiratory, Louisville, CO) using the DeV-
ilbiss 646 nebulizer. Our measured nebulizer output was
8.7 ± 0.8 uL/breath (mean ± SE), very close to that
reported in the literature for this equipment[6]. Pre-
dicted values for spirometric indices were based on pub-
lished regression equations [7]. Spirometry was
performed in accordance with published standards [8].
For methacholine challenges, interpolation was used to
calculate the provocative concentration causing a 20%
drop in FEV
1
(PC
20
). We also calculated the methacho-
line dose-response slope [9] as a two-point slope of a
line connecting the first and last point of the dose-
response curve, measured in units of % decline from
baseline FEV
1
per mg/mL of methacholine, an approach
that permits analysis of methacholine responsiveness as
a conti nuous measure even in subjects not experiencing
a 2 0% decline in FEV
1
. For logarith mic transformation
of dose-response slope prior to g raphic display and cor-
relation analysis, the constant 0.1 was first added to deal
with zero or slightly negative values.
Data Analysis
Among subjects that denied asthma, those with a PC
20
greater than 25 mg/mL were defined as “nonasthmatic
methacholine nonresponders.” Among subjects that
reported asthma, t hose with a PC
20
≤25 mg/mL were
defined as “asthmatic methacholine responders.”
A second-order linear regression analysis, using the
bisquare method[10] to account for undue influence of
outliers, was performed to derive a prediction equation
for R
min
basedonheight,usingdatafrom84nonasth-
matic substudy participants and 26 of the 34 nonasth-
matic participants in the full study who had a PC
20
≥25
mg/ml. Predicted values calculated with this equation
were used to derive R
min
% predicted = (measured R
min
/predicted R
min
) * 100.
Statistical comparisons were made using paired or
unpaired t-tests, or a Mann-Whitney Rank Sum test if a
test of normality or equal variance failed , w ith a
significance level of 0.05. Correlations were examined
using the Pearson correlation coefficient. For subjects
that did not experience a 20% or grea ter decline in
FEV1 by the h ighest concentration of 25 mg/mL, we
assigned a PC
20
value of 25 mg/mL so that we could
calculate a geometric mean for Table 1 (Subject
characteristics).
Receiver operator characteristic (ROC) curves to
examine the ability of Rmin % predicted and othe r para-
meters to predict airway hyperresponsiveness (defined as
aPC
20
< 16 mg/mL) were created by plotting s ensitivity
(true positive rate) versus 1-specificity (true negative
rate), for each value of the test. The best threshold for
any test is that which maximizes sensitivity while mini-
mizing the false positive rate, represented by the left
upper most value on th e curve. The area under th e
curve (AUC) represents a measure of test accuracy
(AUC of 1.0 indicates perfect prediction; AUC of 0.50
indicat es prediction no better th an chance) and was cal-
culated via numerical integration.
Results
Subject Characteristics
We studied 34 n onasthmatic and 35 asthmatic partici-
pants with similar demographic and anthropomorphic
characteristics (Table 1). Only two of these subjects
(both nonasthmatics) were current tobacco smokers.
Asthmatics had lower spirometric indices and greater
methacholine responsiveness than nonasthmatics.
Among the 34 nonasthmatic subjects, 26 were classified
as “ nonasthmatic methacholine nonresponders” as
defined above. Among the 35 subjects that reported
asthma, 31 subjects were classified as “asthmatic metha-
chol ine responders” as define d above. The 84 additional
Table 1 Characteristics* of 34 nonasthmatic and 35
asthmatic participants
Nonasthmatic
(n = 34)
Asthmatic
(n = 35)
Sex 22 F/12 M 22 F/13 M
Age (yr) 21 ± 2 21 ± 3
Height (cm) 170 ± 10 168 ± 10
Weight (kg) 65 ± 13 66 ± 12
FEV1 (% predicted) 95 ± 10
†
88 ± 11
FEV1/FVC (% predicted) 100 ± 7
†
90 ± 9
PC20 (mg/ml) 19 ± 2
†
median: 25
1.8 ± 5.2
median: 1.3
≥ 25 26 4
16 - 24.9 1 0
8 - 15.9 4 5
<8 3 26
* Mean ± standard deviation is shown for continuous variables, except for
PC20, which is geometric mean ± standard deviation.
†
p < 0.05.
Mendonça et al. Respiratory Research 2011, 12:96
/>Page 3 of 8
nonasthmatic subjects, who underwent only forced
oscillation and anthropomorphic measurements, had a
mean age of 21 and were 55% males.
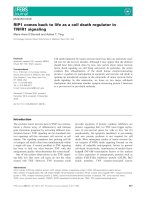
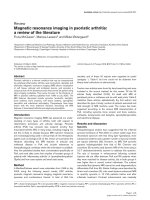
Dynamic Rrs tracings and determination of R
min
in
representative subjects
Typical tracings of R
rs
andrelativevolumeforanon-
asthmatic and an asthmatic subject are shown in Fig-
ure 1. For the asthmatic participant shown, the mean
end-inspiratory pre-deep inspiration R
rs
was 2.36
cmH
2
0/L/s, and R
min
was 1.46 cmH
2
0/L/s, values
approximately 50% higher than those of the nonasth-
matic subject shown (1.45 and 0.99 cmH
2
0/L/s for R
rs
and R
min
, respectively).
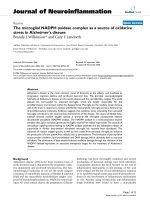
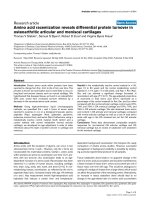
Relationship Between R
min
and Height
We examined the relationship between R
min
and height
among the 84 subjects that underwent limited testing
plus the 26 nonast hmatic methacholine nonresponders
in the full study. These two groups displayed a similar
relationship between R
min
and height (Figure 2) and
were therefore analyzed together. Regression analysis of
these 100 subjects revealed the following relationship:
R
min
=7.20− 5.46 ∗ Height + 1.07 ∗ Height
2
.
The R
2
for this model (regression line superimposed
on Figure 2) was 0.60, indicating a relationship between
R
min
and height of similar strength to that between
spirometric measurements and height [7]. R
min
was not
significantly related to sex or body-mass index after
accounting for height.
R
min
% predicted as an indicator of asthma and airway
hyperresponsiveness
The baseline R
rs
(end-inspiration values averaged over 6
pre-deep inspiration tidal breaths), R
min
,andR
min
%
predicted differed significantly between asthmatics and
nonasthmatics, as did spirometric indices (Table 2).
These differences were even more pronounced when
comparing nonasthmatic methacholine nonresponders
and asthmatic methacholine responders (Table 2). The
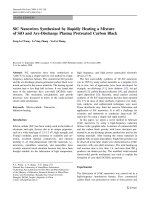
R
min
% predicted was significantly greater among asth-
matics than nonasthmatics in all conditions (baseline,
post-albuterol, post-methacholine), differences that were
even more pronounced when comparing asthmatics to
nonasthmatic methacholine nonresponders (Figure 3).
Among subjects without asthma, the R
min
was greater
among those with a PC
20
≤25 mg/mL than among those
with a PC
20
> 25 mg/mL (R
min
% predicted 131.7 +/-
5.3 SE vs. 102.1 +/- 2.9 SE, P < 0.0001).
Figure 1 Typical respiratory system resistance tracings for a nonasthmatic and an asthmatic subject. Typical trace of respiratory system
resistance (R
rs
) at 8 Hz and relative inhaled volume (above functional residual volume) for a nonasthmatic (H09) and asthmatic (A04) subject at
baseline. Both participants are female and of similar age, height, and weight. End-inspiration R
rs
values are used in analysis (open circles). The
minimum resistance achieved at maximum inspiration is termed R
min
. The R
rs
is plotted as a solid line, and the inhaled volume is plotted as a
dotted line.
Mendonça et al. Respiratory Research 2011, 12:96
/>Page 4 of 8
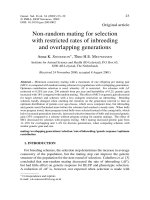
In Figures 4, 5, 6, the methacholine dose-response
slope i s plotted versus R
min
% predicted (Fig ure 4), FEV
1
% predicted (Figure 5), and FEF
25-75
% predicted (Figure
6) for nonasthmatic (closed circles) and asthmatic (open
triangle) participants. These plots reveal that the log
10
dose-response slope was significantly correlated with
Rmin % predicted (r = 0.50, p < 0.0001), FEV
1
%pre-
dicted (r = -0.40, p < 0.001), and FEF
25-75
% predicted
(r = -0.63, p < 0.00001). Defining airway hyperresponsive-
ness as a methcholine PC
20
< 16 mg/mL (cor respond ing
to a dose-response slope > 1.2), 80% of the subjects with
baseline R
min
< 100% predicted did not have airway
hyperresponsiveness, while 100% of subjects with R
min
>
145% predicted had hyperresponsiveness, regardless of
clinical classification as asthmatic or nonasthmatic.
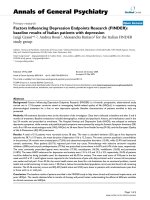
ROC curves were used to formally compare the ability
of these measurements to distinguish hyperresponsive
subjects (defined as PC
20
less than 16 mg/ml) from sub-
jects without hyppresponsive ness and to identify the
optimal threshold levels for distinguishing these groups
(Figure 7). The thresholds yielding the highest combined
Table 2 Baseline physiologic measurements* in asthmatic and control subjects and in subgroups of these subjects
All
subjects
Subgroups
Physiologic
measurement
Nonasthmatic
(n = 34)
Asthmatic
(n = 35)
P value Nonasthmatic methacholine
nonresponders
(n = 26)
Asthmatic methacholine
responders
(n = 31)
P value
FEV1
% predicted
95 ± 10 88 ± 11 0.009 97 ± 8 88 ± 11 0.002
FEV1/FVC
% predicted
100 ± 7 90 ± 9 <
0.0001
102 ± 6 90 ± 9 <
0.0001
FEF25-75
% predicted
93 ± 20 69 ± 20 <
0.0001
99 ±18 68 ±18 <
0.0001
R
rs
,
cmH20/L/s
2.21 ± 0.48 2.91 ± 0.99 0.0006 2.10 ±0.24 2.95 ±1.04 0.0005
R
min
,
cmH20/L/s
1.12 ± 0.31 1.39 ± 0.41 0.004 1.02 ± 0.24 1.41 ± 0.42 0.0001
R
min
,
% predicted
109 ± 19 134 ± 33 0.0004 102 ± 14 137 ± 33 <
0.0001
* Mean ± standard deviation.
Base Post-alb Base Post-mch Post-alb
Da
y
1 Da
y
2
Rmin
%
pred
0
50
100
150
200
250
300
Nonasthmatic
Nonasthmatic nonreactive
Asthmatic
*
*
*
**
*
*
*
*
*
Figure 3 Plot of R
min
% predicted for asthmatic and
nonasthmatic subjects.R
min
%predicted for all 34 nonasthmatic
(black) and 35 asthmatic (hatched) participants as well as the
subgroup of 26 nonasthmatic methacholine nonresponders (gray).
*indicates significant difference from asthmatic group in each
condition (p < 0.05)
Hei
g
ht
(
m
)
1.5 1.6 1.7 1.8 1.9
Rmin (cmH
2
O/L/s)
0.5
1.0
1.5
2.0
2.5
Nonasthmatic nonreactive
Nonasthmatic, limited testing
Nonasthmatic, methacholine nonresponder
Figure 2 Plot of R
min
versus height for nonas thmatic subjects.
R
min
(cmH
2
O/L/s) is plotted by height (m) for 100 nonasthmatic
subjects, including 84 subjects recruited for limited testing (+) and
26 nonasthmatic methacholine nonresponders (0), as described in
the text. The superimposed regression line is derived from a second
order linear regression (r
2
= 0.60).
Mendonça et al. Respiratory Research 2011, 12:96
/>Page 5 of 8
sensitivity and specificity were 115 for R
min
% predicted,
91 for FEV
1
% predicted, and 82 for FEF
25-75
%pre-
dicted. The AUC for R
min
,FEV
1
,andFEF
25-75
,were
0.85, 0.78, and 0.87, respectively. The AUC for both the
FEV
1
/FVC ratio and FEF
25-75
/FVC ratio (not shown in
figure) was 0.81. The percent increase in FEV
1
following
albuterol administration on the first day of the protocol
was also analyzed and was comparable to R
min
%pre-
dicted (AUC = 0.85 with a threshold of 3.7% FEV
1
increase). ROC cu rves were also calculated f or hyperre-
sponsiveness defined as a PC
20
<25mg/ml,andinthis
case the R
min
% predicted had the highest AUC at 0.87.
Discussion
Our goal was to test the hypothesis that the minimal air-
wayresistanceachievableduring a maximal i nspiration
(R
min
) is abnormally elevated in subjec ts with airway
hyperresponsiveness. The breathing maneuver required
to measure R
min
by the forced oscillation method is less
burdensome and less subject to performance-related
errors than is spirometry. We observed that the baseline
R
min
, as a percent predicted value based on height, identi-
fies people with airway hyperresponsiveness approxi-
mately as well as FEF
25-75
and slightly better than FEV
1
.
Previous report s suggested a decreased ability of ast h-
matic airways to dilate in response to a deep inspiration,
a deficiency that was accentuated after bronchial chal-
lenge [2,11] Our measurements in a larger sample of
0.1
1
10
100
1000
50 100 150 200 250
R min % predicted
Dose-response slope
r = 0.50 (p < 0.0001)
Figure 4 Plot of methacholine dose-response slope versus R
min
percent predicted. Scatter plot of dose-response slope versus
baseline R
min
% predicted for nonasthmatic (closed circles) and
asthmatic (open triangle) participants.
0.1
1
10
100
1000
50 70 90 110 130
FEV1 % predicted
Dose-response slope
r = -0.40 (p < 0.001)
Figure 5 Plot of methacholine dose-response slope versus FEV
1
percent predicted. Scatter plot of dose-response slope versus FEV
1
% predicted for nonasthmatic (closed circles) and asthmatic (open
triangle) participants.
0.1
1
10
100
1000
0 50 100 150
FEF
25-75
% predicted
Dose-response slope
r = -0.63 (p < 0.00001)
Figure 6 Plot of methacholine dose-response slope versus
FEF
25-75
percent predicted. Scatter plot of dose-response slope
versus FEF
25-75
% predicted for nonasthmatic (closed circles) and
asthmatic (open triangle) participants.
0.7891FEV
1
0.85115Rmin % pred
0.8782FEF
25-75
AUCThreshold Test
0.7891FEV
1
0.85115Rmin % pred
0.8782FEF
25-75
AUCThreshold Test
1-Specificit
y
0.0 0.2 0.4 0.6 0.8 1.0
Sensitivity
0.0
0.2
0.4
0.6
0.8
1.0
Rmin % predicted
FEV
1
% predicted
FEF
25-75
% predicte
d
Figure 7 Receiver operator characteristic curves for R
min
, FEV
1
,
and FEF
25-75
as predictors of airway hyperreactvitiy. Receiver
operator characteristic (ROC) curves for R
min
, FEV
1
, and FEF
25-75
as
predictors of airway hyperresponsiveness (PC
20
< 16 mg/ml). The
thresholds yielding the highest combined sensitivity and specificity
were 115, 91, and 82 for R
min
% predicted, FEV
1
% predicted, and
FEF
25-75
% predicted, respectively. The area under the curve (AUC)
was 0.85, 0.78, and 0.87 for R
min
% predicted, FEV
1
% predicted, and
FEF
25-75
% predicted, respectively.
Mendonça et al. Respiratory Research 2011, 12:96
/>Page 6 of 8
subjects agree with these previous observations. At base-
line, R
min
, an inverse measure of airway caliber, was si g-
nificantly higher in asthmatics compared to
nonasthmatics. Following inhalation of albuterol, sub-
jects with a sthma still had higher R
min
than nonasth-
matics (Figure 3). In fact, asthmatic subjects had a
hig her mean R
min
after albuterol than the nonasthmatic
methach oline nonresponder group before albuterol (not
shown), indicating that in subjects with asthma, albu-
terol cannot always dilate airways to levels achievable in
nonasthmatic airways. This suggests that either albuterol
does not relax the airway smooth muscle of a sthmatics
to the same extent as nonasthmatics or that the airway
walls have become stiff or narrowed by other mechan-
isms. In that our data on response to albuterol suggest
that asthmatics have an approximately similar decline in
R
min
in response albuterol as nonasthmatics (reduction
in R
min
% predicted 17 ± 6.3 SE vs. 11 ± 2.2 SE for asth-
matics and nonasthmatics, respectively; p = 0.38), this
may favor the explanation of residual differences in the
airway wall independent of ASM tone. It mus t be noted
that the dose of albuterol ad ministered in our protocol,
i.e. 180 ug (two inhalations), is not a maximally bronch-
odilating dose. When the stiffer asthmatic airway is con-
stricted by methacholine, the inability to dilate with a
deep inspiration is exaggerated compared to nonasth-
matic participants, the R
min
% predicted increasing in
response to methacholine by 85 ± 12 SE vs. 38 ± 5.6 SE
(p < 0.001) in asthmatics and nonasthmatics, respec-
tively (Figure 3).
There are several factors that influence airway caliber,
including airway smooth muscle tone and stiffness, the
passive properties of the airway wall (e.g. airway w all
thickening), parenchymal tethering and transmural pres-
sure acting to distend the airway. Several of these can
be influenced by airway wall remodeling. Direct mea-
surement of airway distensibility in the intact lung (i.e.
the relationship between airway caliber and airway dis-
tending pressure) is difficult . Recent work by Brown et
al. confirms the ability to indirectly assess airway disten-
sibility n on-invasively using forced oscillations [12,13].
Specifically, distensibility was quantified as the linear
slope of respiratory system conductance (1/R
rs
)and
volume between 7 5% and 1 00% of total lung capacity.
This slope was decreased in asthmatics and unaffected
by reduction of broncho motor tone with albuterol.
Brown et al. concluded that reduced airway distensibility
in asthmatics is consistent with structural changes asso-
ciated with airway wall remodeling and is not reflective
of increased airway smooth muscle tone. This is consis-
tent with the data of our study. Another key determi-
nant of the ability to dilate could be lung elastic recoil
pressure; past studies have reported a significant loss of
recoil in moderate-to-severe though perhaps not mild
asthma[14-16]. We did not measure elastic recoil in our
study and can only speculate on its role.
Several limitations of our study must be recognized.
The sample size was relatively small (n = 69 for the full
protocol and n = 84 for the limited testing to establish
predicted values for Rmin), the ag e range was limited to
to 18-29 years, and most subjects were Caucasian race.
A larger and more diverse sample would permit better
evaluation of the potential relationship of R
min
to age
and race, as well as subgroup analyses. In addition, the
asthmatic subjects had mild to moderate disease, so the
full spectrum of asthma was not reflected in our sample,
and we were not able to assess the correlation of R
min
with clinical status. It is possible that t here could b e
important differences in the physiology of mi lder versus
more severe asthma. Finally, the deep inhalations per-
formed during the dosimeter protocol for methacholine
challenge have been reported t o result in bronchopro-
tection and falsely negative challenge results among
mild asthmatics, compared to the tidal breathing proto-
col[17,18]. It would be of interest to h ave data on the
relationship of R
min
to airway responsiveness assessed by
both protocols.
Conclusions
Our study reveal s that after adjusting for height, R
min
differs between asthmatics and nonasthmatics, predicts
methacholi ne responsiven ess, increases with administra-
tion of methacholine, and decreases with albuterol.
Compared to spirometry, this test requires less patient
effort and is easier for a technician or clinic staff mem-
ber to administer with technically acceptable results. In
conjunction with symptom history, R
min
could provide a
clinically useful tool for assessing asthma control and
monitoring the response to treatment. Longitudinal stu-
dies are needed to assess the utility of R
min
as an indica-
tor of asthma control and response to asthma therapy.
List of abbreviations
AUC: area under the curve; PC
20
:provocative concentration causing a 20%
drop in FEV
1;
ROC: receiver operator characteristic; R
min
: minimal airway
resistance achievable during a deep inspiration; R
rs
: respiratory system
resistance
Acknowledgements
This work was supported by the National Institutes of Health [GRANT RO1
HL076778].
Author details
1
Department of Biomedical Engineering, 44 Cummington St., Boston
University, Boston, MA 02215, USA.
2
Pulmonary Center, Boston University
School of Medicine, 72 E. Concord St., Boston, MA 02118, USA.
Authors’ contributions
NTM contributed to study design, acquisition of data, analysis and
interpretation of data, and drafting and revising the manuscript. JK
contributed to study design, acquisition of data, analysis and interpretation
of data, and drafting and revising the manuscript. ASL contributed to
Mendonça et al. Respiratory Research 2011, 12:96
/>Page 7 of 8
acquisition of data, analysis and interpretation of data, and drafting and
revising the manuscript. SNS contributed to study design, acquisition of
data, analysis and interpretation of data, and drafting and revising the
manuscript. GTO contributed to study design, acquisition of data, analysis
and interpretation of data, and drafting and revising the manuscript. KRL
contributed to study design, acquisition of data, analysis and interpretation
of data, and drafting and revising the manuscript. All authors read and
approved the final manuscript.
Competing interests
The authors declare that they have no competing interests.
Received: 7 September 2010 Accepted: 15 July 2011
Published: 15 July 2011
References
1. Mazzarella G, Stendardi L, Grazzini M, Scano G: Mechanisms involved in
airway obstruction: the role of smooth muscle. Allergy 2000, 55(Suppl
61):46-48.
2. Jensen A, Atileh H, Suki B, Ingenito EP, Lutchen KR: Selected contribution:
airway caliber in healthy and asthmatic subjects: effects of bronchial
challenge and deep inspirations. J Appl Physiol 2001, 91(1):506-515,
discussion 504-505.
3. Salome CM, Thorpe CW, Diba C, Brown NJ, Berend N, King GG: Airway re-
narrowing following deep inspiration in asthmatic and nonasthmatic
subjects. Eur Respir J 2003, 22(1):62-68.
4. Black LD, Dellaca R, Jung K, Atileh H, Israel E, Ingenito EP, Lutchen KR:
Tracking variations in airway caliber by using total respiratory vs. airway
resistance in healthy and asthmatic subjects. J Appl Physiol 2003,
95(2):511-518.
5. Crapo RO, Casaburi R, Coates AL, Enright PL, Hankinson JL, Irvin CG,
MacIntyre NR, McKay RT, Wanger JS, Anderson SD, et al: Guidelines for
methacholine and exercise challenge testing-1999. This official
statement of the American Thoracic Society was adopted by the ATS
Board of Directors, July 1999. Am J Respir Crit Care Med 2000,
161(1):309-329.
6. Todd DC, Davis BE, Smycniuk AJ, Cockcroft DW: Importance of dosimeter
calibration method on nebulizer output. Ann Allergy Asthma Immunol
2005, 94(1):45-47.
7. Crapo RO, Morris AH, Gardner RM: Reference spirometric values using
techniques and equipment that meet ATS recommendations. Am Rev
Respir Dis 1981, 123(6):659-664.
8. Miller MR, Hankinson J, Brusasco V, Burgos F, Casaburi R, Coates A, Crapo R,
Enright P, van der Grinten CP, Gustafsson P, et al: Standardisation of
spirometry. Eur Respir J 2005, 26(2):319-338.
9. O’Connor G, Sparrow D, Taylor D, Segal M, Weiss S: Analysis of dose-
response curves to methacholine. An approach suitable for population
studies. The American review of respiratory disease 1987, 136(6):1412-1417.
10. Hoaglin DC, Mosteller F, Tukey JW: Understanding robust and exploratory
data analysis.Edited by: David C Hoaglin, Frederick Mosteller, John W
Tukey. New York Wiley; 1983:.
11. Black LD, Henderson AC, Atileh H, Israel E, Ingenito EP, Lutchen KR: Relating
maximum airway dilation and subsequent reconstriction to reactivity in
human lungs. J Appl Physiol 2004, 96(5):1808-1814.
12. Brown NJ, Salome CM, Berend N, Thorpe CW, King GG: Airway
distensibility in adults with asthma and healthy adults, measured by
forced oscillation technique. Am J Respir Crit Care Med 2007,
176(2):129-137.
13. Brown NJ, Thorpe CW, Thompson B, Berend N, Downie S, Verbanck S,
Salome CM, King GG: A comparison of two methods for measuring
airway distensibility: nitrogen washout and the forced oscillation
technique.
Physiol Meas 2004, 25(4):1067-1075.
14. Gelb AF, Zamel N: Unsuspected pseudophysiologic emphysema in
chronic persistent asthma. American journal of respiratory and critical care
medicine 2000, 162(5):1778-1782.
15. Gelb AF, Licuanan J, Shinar CM, Zamel N: Unsuspected loss of lung elastic
recoil in chronic persistent asthma. Chest 2002, 121(3):715-721.
16. Sciurba FC: Physiologic similarities and differences between COPD and
asthma. Chest 2004, 126(2 Suppl):117S-124S, discussion 159S-161S.
17. Allen ND, Davis BE, Hurst TS, Cockcroft DW: Difference between dosimeter
and tidal breathing methacholine challenge: contributions of dose and
deep inspiration bronchoprotection. Chest 2005, 128(6):4018-4023.
18. Cockcroft DW, Davis BE: The bronchoprotective effect of inhaling
methacholine by using total lung capacity inspirations has a marked
influence on the interpretation of the test result. The Journal of allergy
and clinical immunology 2006, 117(6):1244-1248.
doi:10.1186/1465-9921-12-96
Cite this article as: Mendonça et al.: Airway resistance at maximum
inhalation a s a marker of asthma and airway hyperrespon sivenes s.
Respiratory Research 2011 12:96.
Submit your next manuscript to BioMed Central
and take full advantage of:
• Convenient online submission
• Thorough peer review
• No space constraints or color figure charges
• Immediate publication on acceptance
• Inclusion in PubMed, CAS, Scopus and Google Scholar
• Research which is freely available for redistribution
Submit your manuscript at
www.biomedcentral.com/submit
Mendonça et al. Respiratory Research 2011, 12:96
/>Page 8 of 8