Báo cáo y học: " Exploring the optimum approach to the use of CT densitometry in a randomised placebo-controlled study of augmentation therapy in alpha 1-antitrypsin deficiency" pptx
Bạn đang xem bản rút gọn của tài liệu. Xem và tải ngay bản đầy đủ của tài liệu tại đây (577.33 KB, 10 trang )
BioMed Central
Open Access
Page 1 of 10
(page number not for citation purposes)
Respiratory Research
Research
Exploring the optimum approach to the use of CT
densitometry in a randomised placebo-controlled study of
augmentation therapy in alpha 1-antitrypsin deficiency
David G Parr*
1
, Asger Dirksen
2
, Eeva Piitulainen
3
, Chunqin Deng
4
,
Marion Wencker
5
and Robert A Stockley
6
Address:
1
Department of Respiratory Medicine, University Hospitals of Coventry and Warwickshire, Clifford Bridge Road, Coventry CV2 2DX, UK,
2
Gentofte Hospital, Copenhagen University, DK-2900 Hellerup, Denmark,
3
Department of Respiratory Medicine, University Hospital, Malmö,
Sweden,
4
Talecris Biotherapeutics Inc., Research Triangle Park, NC 27709, USA,
5
Talecris Biotherapeutics GmbH, Lyoner Strasse 15, D-60528
Frankfurt am Main, Germany and
6
Lung Investigation Unit, University Hospitals of Birmingham, Edgbaston, Birmingham B15 2TH, UK
Email: David G Parr* - ; Asger Dirksen - ; Eeva Piitulainen - ;
Chunqin Deng - ; Marion Wencker - ; Robert A Stockley -
* Corresponding author
Abstract
Background: Computed tomography (CT) lung densitometry has been demonstrated to be the most sensitive and
specific outcome measure for the assessment of emphysema-modifying therapy, but the optimum densitometric index
has yet to be determined and targeted sampling may be more sensitive than whole lung assessment. The EXAcerbations
and CT scan as Lung Endpoints (EXACTLE) trial aimed to clarify the optimum approach to the use of CT densitometry
data for the assessment of alpha 1-antitrypsin (AAT) augmentation therapy on the progression of emphysema in AAT
deficiency (AATD).
Methods: Patients with AATD (n = 77) were randomised to weekly infusions of 60 mg/kg human AAT (Prolastin
®
) or
placebo over 2 to 2.5 years. Lung volume was included as a covariate in an endpoint analysis and a comparison was made
of different CT densitometric indices (15th percentile lung density [PD15], mean lung density [MLD] and voxel index at
a threshold of -910 [VI-910] and -950 [VI-950] Hounsfield Units) obtained from whole lung scans at baseline and at 24
to 30 months. Targeted regional sampling was compared with whole lung assessment.
Results: Whole lung analysis of the total change (baseline to last CT scan) compared with placebo indicated a
concordant trend that was suggestive of a treatment effect for all densitometric indices (MLD [1.402 g/L, p = 0.204]; VI-
910 [-0.611, p = 0.389]; VI-950 [-0.432, p = 0.452]) and that was significant using PD15 (1.472 g/L, p = 0.049). Assessment
of the progression of emphysema in the apical, middle and basal regions of the lung by measurement with PD15 showed
that this treatment effect was more evident when the basal third was sampled (1.722 g/L, p = 0.040). A comparison
between different densitometric indices indicated that the influence of inspiratory variability between scans was greatest
for PD15, but when adjustment for lung volume was made this index was the most sensitive measure of emphysema
progression.
Conclusion: PD15 is the most sensitive index of emphysema progression and of treatment modification. Targeted
sampling may be more sensitive than whole lung analysis.
Trial registration: Registered in ClinicalTrials.gov as 'Antitrypsin (AAT) to Treat Emphysema in AAT-Deficient
Patients'; ClinicalTrials.gov Identifier: NCT00263887.
Published: 13 August 2009
Respiratory Research 2009, 10:75 doi:10.1186/1465-9921-10-75
Received: 9 June 2009
Accepted: 13 August 2009
This article is available from: />© 2009 Parr et al; licensee BioMed Central Ltd.
This is an Open Access article distributed under the terms of the Creative Commons Attribution License ( />),
which permits unrestricted use, distribution, and reproduction in any medium, provided the original work is properly cited.
Respiratory Research 2009, 10:75 />Page 2 of 10
(page number not for citation purposes)
Background
Computed tomographic (CT) imaging is the most sensi-
tive and specific method for diagnosis of emphysema in
vivo [1,2]. In addition, it provides quantitative data that
correlate with pathological morphometry [3-6] and has
been shown to be a valid tool for monitoring emphysema
in clinical studies of alpha 1-antitrypsin deficiency
(AATD) [7,8]. In recent years, there has been greater
understanding and acceptance of this relatively novel
technique, but there is limited published evidence to sup-
port the contention that one methodological approach to
CT densitometry is superior to another. In particular, the
majority of data have been obtained from observational
cohorts [7-12], and it cannot be assumed that the conclu-
sions of these studies may be extrapolated to interven-
tional trials.
The EXACTLE (EXAcerbations and CT scan as Lung End-
points) trial [13] was undertaken to explore the role of CT
densitometry as a potential primary outcome measure in
the setting of a double-blind, placebo-controlled study of
the effect of alpha 1-antitrypsin (AAT) augmentation ther-
apy on the progression of emphysema in individuals with
AATD (PiZ) over 24 to 30 months. The study concluded
that CT densitometry was a more sensitive and robust out-
come measure than physiology, health status and exacer-
bation frequency, and demonstrated that the method for
controlling the variability arising from differences in
inspiratory level was of importance in demonstrating a
treatment effect [10,13].
Additional CT methodological issues were explored in the
EXACTLE study and the findings are reported here. These
included the identification of the most discriminating
densitometric index for use as an outcome measure. Fur-
thermore, the role of regional densitometry was compared
with whole lung densitometric assessment in order to
determine whether targeted sampling was more appropri-
ate for a pathological process that may be localised, and
whether there could be regional differences in treatment
effect.
Methods
Subjects
Patients with pulmonary emphysema due to severe con-
genital AATD of phenotype PiZ were recruited from AAT
registries in Denmark, the UK and Sweden. Eligible
patients were at least 18 years of age, had a history of at
least 1 exacerbation in the past 2 years, had a post-bron-
chodilator forced expiratory volume in 1 second (FEV
1
) ≥
25% and ≤ 80% predicted and a ratio of post-bronchodi-
lator FEV
1
to slow vital capacity (VC) ≤ 0.70, or a carbon
monoxide transfer coefficient (DL
CO
/V
A
) of ≤ 80% of the
predicted value, as previously reported [13]. All patients
gave written informed consent. The study was approved
by relevant local ethics review committees and was con-
ducted in accordance with the Declaration of Helsinki and
Good Clinical Practice guidelines.
Study design
This multicentre, randomised, placebo-controlled, dou-
ble-blind, parallel-group study was conducted at 3 centres
in Copenhagen (Denmark), Birmingham (UK) and
Malmö (Sweden). Eligible patients were randomly
assigned, in permuted blocks with stratification according
to country, to weekly infusions of either AAT (Prolastin
®
60
mg/kg body weight) or placebo (2% concentration of
albumin) for 24 months, as previously described [13]. CT
scans were performed at baseline and at 12 and 24
months, with an option for continuation and an addi-
tional scan at 30 months.
CT densitometry
The primary efficacy endpoint was progression of emphy-
sema determined by change in lung density measured by
CT scan of the whole lung as previously reported [13].
Based on earlier studies [7,10,11,14] and recommenda-
tions of an expert review [15], the 15th percentile point
was chosen as the parameter for the primary endpoint and
expressed as the 15th percentile lung density (PD15). The
15th percentile point is defined as the value (Hounsfield
Units) below which the 15% of voxels with the lowest
density are distributed (Figure 1), and it may be expressed
as PD15 (g/L) by the simple addition of 1000 to the
Hounsfield value of the 15th percentile point. Other effi-
cacy endpoints included the following additional densit-
ometric indices extracted from the frequency distribution
histogram of lung voxels: mean lung density (MLD), voxel
index at a threshold of -910 Hounsfield Units (VI-910),
and voxel index at a threshold of -950 Hounsfield Units
(VI-950; Figure 1).
CT image acquisition
Multidetector CT scans of the chest were performed fol-
lowing inhaled bronchodilator therapy in the supine
position during a breath-hold manoeuvre as close as pos-
sible to total lung capacity. All scanning was performed
without intra-venous contrast in a caudo-cranial direction
and with the arms held above the head in order to reduce
artifacts. Scan acquisition parameters were standardized
using the preferred scanning parameters 140 kVp, 40 mA,
and pitch 1.5, with reconstructed slice thickness of 5 mm
and with an increment of 2.5 mm but taking account of
the scanner differences that existed between the 3 centres
[13 and associated supplementary information]. Radia-
tion per CT scan was low at around 1 mSv.
Mandatory scanner air calibration was performed accord-
ing to the scanner manufacturers' instructions within 3
hours of the first patient scan, and every 3 hours during
Respiratory Research 2009, 10:75 />Page 3 of 10
(page number not for citation purposes)
scanning lists. Mandatory water calibration was per-
formed by the manufacturers (using the manufacturers'
water phantom) at least every 3 months using the clinical
scan protocol. Additional quality assurance was achieved
using a dedicated Perspex and foam phantom that was
scanned prior to site initiation, the first patient scan at
each site, and every 6 months throughout the study.
Raw data were reconstructed using an edge-smoothing
image reconstruction algorithm and were saved in
DICOM format on CD for shipment to a central facility
(Heart Core Global Medical Imaging) for densitometric
analysis using dedicated software (Pulmo-CMS) as previ-
ously described [13 and associated supplementary infor-
mation].
CT endpoints
Prior to un-blinding, a review panel assessed CT scan data
to identify invalid scans due to technical issues [13 and
associated supplementary information]. The progression
of densitometric indices was estimated using an endpoint
analysis using the first and last CT scans and incorporating
adjustment for lung volume, as described below (see Sta-
tistical Analysis).
Progression was assessed for whole lung and for the api-
cal, middle and basal regions. Subdivision of a whole lung
series into apical, middle and basal thirds of approximate
equal volume was achieved by dividing the whole lung
into 12 segments of equal volume. The most apical and
basal segments were excluded from further analysis
because image artifact is recognised to be greatest in these
anatomical locations [16]. The remaining 10 segments
were divided into the 'basal region' (the 4 most caudal
segments), the 'apical region' (the 3 most cranial seg-
ments) and the 'middle region' (the intervening 3 seg-
ments).
Statistical analysis
All CT scan analyses were based on the modified intent-
to-treat (mITT) population, defined as all randomised
subjects who received the study therapy and had at least 1
valid CT scan measurement at baseline and 1 valid CT
scan assessment at Month 12 or thereafter [13].
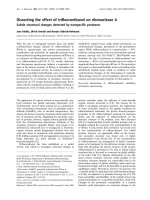
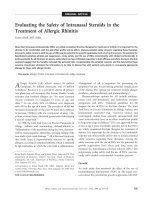
Voxel frequency distribution histogram indicating the appearance in normal lung and in emphysema, and the derivation of the densitometric indices that were used in the current studyFigure 1
Voxel frequency distribution histogram indicating the appearance in normal lung and in emphysema, and the
derivation of the densitometric indices that were used in the current study. 15th percentile point is defined as the
cut-off value, in Hounsfield Units (HU), below which are distributed the 15% of voxels with the lowest density. (This index may
be converted to the 15th percentile lung density (PD15) in g/L by the addition of 1000.) The voxel index at a threshold of -
950HU (VI-950) is shown and is defined as the percentage of voxels with a value less than -950HU. The mean lung density is
defined as the mean value (in g/L) of all voxels distributed within the lung histogram.
20
Normal
Relative
frequency (%)
Change in
voxel index
(-950HU)
between normal
(––) and
emphysematous
(- - -) lung
Change in 15th
percentile point
between normal (––)
and emphysematous
(- - -) lung
Emphysema
15
10
5
0
-1000
-950
-800
Hounsfield Units (HU)
-600 -500-700
Respiratory Research 2009, 10:75 />Page 4 of 10
(page number not for citation purposes)
Treatment differences (Prolastin versus placebo) were
tested using an analysis of covariance approach, with the
change from baseline to the last CT scan measurement in
lung density as the dependent variable, treatment and
centre as fixed factors, and change in logarithm of CT-
measured TLV and baseline measurement as covariates, as
previously described [10,13]. This statistical model, in
which lung volume attained during scan acquisition was
log-transformed before it was used as a covariate, was
applied to the analyses for all of the different densitomet-
ric indices. In contrast to the case when PD15 is used as
the densitometric index, where log-transformed TLV is
routinely used as a covariate in the statistical model, the
optimum lung volume adjustment method for the voxel
index parameters has not been established. Consequently,
in the absence of any alternative, the same volume adjust-
ment method was used for the voxel index as for PD15 in
this study.
Sensitivity ratios were determined for each of the densito-
metric indices by dividing the value for the mean change
from baseline in lung density by the standard error to
obtain a sensitivity index. Sensitivity ratios measured by
PD15 were also determined for the 3 lung regions. These
data were obtained from analysis of the placebo group
only. In order to establish the influence of inspiratory
level on the different densitometric indices, additional
sensitivity measurements were carried out in a post-hoc
analysis without the lung volume adjustment.
Results
Patient characteristics at baseline
In total, of the 82 patients enrolled into the study from the
3 centres, 77 patients were randomised to Prolastin (n =
38) or placebo (n = 39), and 71 patients (n = 36, Prolastin;
n = 35, placebo) were included in the mITT population.
The number of patients in the ITT population who com-
pleted the study was 67, and 10 patients (3 in the Prolas-
tin group and 7 in the placebo group) discontinued
prematurely, resulting in a median of 127 weeks of expo-
sure to Prolastin and 108 weeks to placebo. The study was
completed by 92% of patients in the Prolastin group and
82% of patients in the placebo group (ITT population), as
described previously [13].
Demographics and disease severity at baseline for all ran-
domised patients are summarised in Table 1. Complete
descriptive details have been previously reported [13]. CT
data indicate that the majority of patients had predomi-
nantly basal emphysema and that there were no signifi-
cant differences in lung density between the Prolastin and
placebo groups at baseline (Table 1).
CT densitometric progression
All CT scan data were reviewed prior to study analysis in a
blinded fashion to identify densitometric values that
might be invalid because of technical issues, as previously
described [13]. A total of 15 scans were invalid, which
resulted in 6 patients having only 1 CT scan; these patients
were therefore excluded from the mITT population.
Comparison of densitometric indices
The mean decline in lung density was determined and
adjusted for lung volume, as described above (see Meth-
ods). All CT densitometric indices demonstrated a signifi-
cant decline in both the Prolastin and placebo groups over
the course of the study, consistent with emphysema pro-
gression (Table 2). The changes in PD15 from baseline to
last CT scan were -2.645 g/L (Prolastin group) and -4.117
g/L (placebo group), indicating a significant treatment
effect (p = 0.049) (Table 2). A trend towards a slower rate
of decline in the Prolastin group was indicated when pro-
Table 1: Patient characteristics at baseline (ITT population)
Prolastin
(n = 38)
Placebo
(n = 39)
p value
Age (years, mean ± SD) 54.7 ± 8.4 55.3 ± 9.8 0.749
Gender (n, male/female) 25/13 16/23 0.021
FEV
1
% predicted (mean ± SD) 46.3 ± 19.6 46.6 ± 21.0 0.873
PD15 (g/L, mean ± SD)
a
Whole lung 47.98 ± 19.07 45.48 ± 16.95 0.288
Apical region 63.36 ± 24.96 62.96 ± 19.77 0.625
Middle region 51.48 ± 18.35 48.35 ± 18.40 0.232
Basal region 38.61 ± 18.90 34.94 ± 15.44 0.182
MLD (g/L, mean ± SD)
a
131.57 ± 21.99 131.68 ± 18.89 0.719
VI-910 (%, mean ± SD)
a
44.43 ± 13.66 45.11 ± 12.02 0.509
VI-950 (%, mean ± SD)
a
18.66 ± 10.97 19.77 ± 9.81 0.435
Lung weight (g, mean ± SD)
a
956.40 ± 140.64 946.09 ± 224.12 0.750
Lung volume (L, mean ± SD)
a
7.46 ± 1.60 7.27 ± 1.78 0.557
SD, standard deviation; FEV
1
, forced expiratory volume in 1 second; PD15, 15th percentile lung density; MLD, mean lung density; VI-910, voxel
index at a threshold of -910 (measured in %); VI-950, voxel index at a threshold of -950 (measured in %).
a
For the CT densitometric analyses, the
mITT population was used (n = 36, Prolastin; n = 35, placebo).
Respiratory Research 2009, 10:75 />Page 5 of 10
(page number not for citation purposes)
gression was assessed using MLD, VI-910 and VI-950,
although the difference between the 2 treatment groups
did not achieve statistical significance (p = 0.204, p =
0.389 and p = 0.452, respectively; Table 2).
The sensitivity ratios (whole lung assessment) measured
for each of the densitometric parameters are shown in
Table 3. PD15 was observed to be the most sensitive meas-
ure of emphysema progression.
Regional densitometry
A significant decline in values for PD15 was observed in
all 3 lung regions in both treatment groups during the
study (Table 4). In the placebo arm, the rate of emphy-
sema progression was comparable between the apical,
middle and basal regions, whereas in the active treatment
arm, the rate of emphysema progression in the basal
region was lower than that of either the apical or middle
regions. A significant treatment effect was demonstrated
in the basal region (p = 0.040) and concordant trends
were observed in the middle and apical regions, although
these failed to achieve statistical significance (p = 0.155
and p = 0.673, respectively) (Table 4 and Figure 2). The
sensitivity ratios showed that analysis by PD15 of the
basal region was a significantly more sensitive measure
than analysis of the apical region (Table 5).
Effect of inspiratory level
A predefined correction for differences in inspiratory level
between scans was applied as described in the Methods
Table 2: Comparison between different densitometric parameters (whole lung CT scans) to assess progression of emphysema in
patients treated with Prolastin versus placebo (mITT population)
PD15 (g/L) Prolastin
(n = 36)
Placebo
(n = 35)
Change from baseline to last CT scan (mean ± SD) -2.895 ± 4.739 -4.124 ± 4.147
Change from baseline to last CT scan (LS mean [SE]) -2.645 (0.526)
< 0.0001
a
-4.117 (0.539)
< 0.0001
a
Estimated treatment difference between LS mean changes from baseline (95% CI) 1.472
(0.009, 2.935)
p value for treatment difference
b
0.049
MLD (g/L) Prolastin
(n = 36)
Placebo
(n = 35)
Change from baseline to last CT scan (mean ± SD) -2.115 ± 7.937 -3.289 ± 5.949
Change from baseline to last CT scan (LS mean [SE]) -1.911 (0.788)
0.0181
a
-3.313 (0.801)
0.0001
a
Estimated treatment difference between LS mean changes from baseline (95% CI) 1.402
(-0.782, 3.586)
p value for treatment difference
b
0.204
VI-910 (%) Prolastin
(n = 36)
Placebo
(n = 35)
Change from baseline to last CT scan (mean ± SD) 1.761 ± 4.511 2.209 ± 3.378
Change from baseline to last CT scan (LS mean [SE]) 1.643 (0.508)
0.0019
a
2.254 (0.517)
< 0.0001
a
Estimated treatment difference between LS mean changes from baseline (95% CI) -0.611
(-2.019, 0.797)
p value for treatment difference
b
0.389
VI-950 (%) Prolastin
(n = 36)
Placebo
(n = 35)
Change from baseline to last CT scan (mean ± SD) 1.994 ± 3.307 2.315 ± 2.578
Change from baseline to last CT scan (LS mean [SE]) 1.924 (0.411)
< 0.0001
a
2.356 (0.420)
< 0.0001
a
Estimated treatment difference between LS mean changes from baseline (95% CI) -0.432
(-1.573, 0.709)
p value for treatment difference
b
0.452
PD15, 15th percentile lung density; CT, computed tomography; SD, standard deviation; LS mean, least squares mean; SE, standard error; 95% CI,
95% confidence interval; MLD, mean lung density; VI-910, voxel index at a threshold of -910 (measured in %); VI-950, voxel index at a threshold of
-950 (measured in %).
a
p values are for the comparison of change from baseline to last CT scan versus no change from baseline within the individual
treatment groups.
b
Prolastin treatment minus placebo (LS mean change).
Respiratory Research 2009, 10:75 />Page 6 of 10
(page number not for citation purposes)
section, and a post-hoc investigation indicated a differen-
tial effect of this adjustment between the densitometric
indices that was greatest for PD15 (Table 3).
Discussion
The EXACTLE trial was designed to explore the use of CT
densitometry as an outcome measure for the assessment
of plasma AAT augmentation therapy in individuals with
AATD. The analytical approach, and the principal techni-
cal issues that were addressed, were a logical sequence to
previous studies within this field [7-12,14,17-21] and
were integral to the design and statistical analysis plan of
the EXACTLE trial [13]. The primary endpoint was the dif-
ference in lung density decline as a result of treatment,
assessed from whole lung CT imaging and expressed as
PD15, as reported previously [13].
Densitometric indices
The current study included a comparison of the more
commonly used densitometric indices to identify whether
the advantages of the 15th percentile method, which have
been demonstrated in observational studies, would also
Table 3: Sensitivity ratios for the different CT densitometric parameters (whole lung; analysis of covariance model)
a
Model with lung volume adjustment
Outcome measure LS mean change from baseline Standard error Sensitivity index
b
F-test
c
PD15 (g/L) -4.12 0.539 7.64 -
MLD (g/L) -3.31 0.801 4.14 < 0.05
VI-910 (%) 2.25 0.517 4.36 < 0.05
VI-950 (%) 2.36 0.420 5.61 NS
Model without lung volume adjustment
Outcome measure LS mean change from baseline Standard error Sensitivity index
b
Reduction in sensitivity index
d
PD15 (g/L) -4.24 0.771 5.50 2.14
MLD (g/L) -3.49 1.221 2.86 1.28
VI-910 (%) 2.34 0.687 3.41 0.95
VI-950 (%) 2.41 0.514 4.69 0.92
LS mean, least squares mean; PD15, 15th percentile lung density; MLD, mean lung density;
VI-910, voxel index at a threshold of -910 (measured in %); VI-950, voxel index at a threshold of -950 (measured in %); NS, not significant.
a
Results
based on estimates from endpoint analysis for placebo group only.
b
Ratio of absolute value of mean change divided by standard error.
c
Ratio of
outcome measure as compared to PD15.
d
Sensitivity index from model with lung volume adjustment minus sensitivity index from model without
lung volume adjustment.
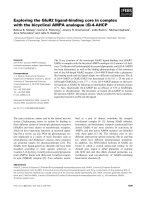
Changes in PD15 (g/L) in whole lung and in basal, middle and apical regions in patients treated with Prolastin versus placebo (mITT population)Figure 2
Changes in PD15 (g/L) in whole lung and in basal, middle and apical regions in patients treated with Prolastin
versus placebo (mITT population).
0
LS mean change
in PD15 (g/L)
Whole lung
Basal region
Middle region
Apical region
-0.5
-1
-1.5
-2
-2.5
-3
-3.5
-4
-4.5
1.472
95% CI: 0.009, 2.935
p = 0.049
Prolastin
®
Placebo
Amount of
emphysema
progression
1.722
95% CI: 0.082, 3.362
p = 0.040
1.312
95% CI: -0.511, 3.135
p = 0.155
0.581
95% CI: -2.159, 3.322
p = 0.673
Respiratory Research 2009, 10:75 />Page 7 of 10
(page number not for citation purposes)
be evident in an interventional study. Previous studies
have validated the use of several densitometric indices for
the measurement of emphysema [4-6,22] and, although
the 15th percentile method has not been compared
directly with a pathological standard, clinical studies
[7,10,14] support the theoretical advantages of this
method [23] over the use of other indices. The sensitivity
of the voxel index method has been shown in longitudi-
nal studies to be influenced by the voxel index threshold
[12,14] and by the severity of emphysema [7]. In contrast,
the sensitivity of the percentile method is relatively inde-
pendent of the chosen centile [14] and is a more consist-
ent measure of emphysema progression across a wide
spectrum of disease severity [7]. Furthermore, the correla-
tion between the rate of reduction in lung density and the
decline in FEV
1
has been shown to be greater when the
15th percentile method is used [7]. This may reflect the
better sensitivity of this measure of emphysema progres-
sion than the voxel index at a threshold of -950 and -
910HU [10]. In the current study, a determination of the
sensitivity ratios for the different densitometric indices
confirms that the 15th percentile method is a more sensi-
Table 4: Changes in PD15 (g/L) in basal, middle and apical regions of the lung in patients treated with Prolastin versus placebo (mITT
population)
Basal region Prolastin
(n = 36)
Placebo
(n = 35)
Change from baseline to last CT scan (mean ± SD) -2.336 ± 4.362 -3.760 ± 4.284
Change from baseline to last CT scan (LS mean [SE]) -2.118 (0.587)
0.0006
a
-3.840 (0.604)
< 0.0001
a
Estimated treatment difference between LS mean changes from baseline (95% CI) 1.722
(0.082, 3.362)
p value for treatment difference
b
0.040
Middle region Prolastin
(n = 36)
Placebo
(n = 35)
Change from baseline to last CT scan (mean ± SD) -2.845 ± 5.796 -3.838 ± 4.696
Change from baseline to last CT scan (LS mean [SE]) -2.504 (0.655)
0.0003
a
-3.816 (0.673)
< 0.0001
a
Estimated treatment difference between LS mean changes from baseline (95% CI) 1.312
(-0.511, 3.135)
p value for treatment difference
b
0.155
Apical region Prolastin
(n = 36)
Placebo
(n = 35)
Change from baseline to last CT scan (mean ± SD) -3.503 ± 7.433 -3.911 ± 5.939
Change from baseline to last CT scan (LS mean [SE]) -3.217 (0.990)
0.0018
a
-3.799 (1.001)
0.0004
a
Estimated treatment difference between LS mean changes from baseline (95% CI) 0.581
(-2.159, 3.322)
p value for treatment difference
b
0.673
PD15, 15th percentile lung density; CT, computed tomography; SD, standard deviation; LS mean, least squares mean; SE, standard error; 95% CI,
95% confidence interval.
a
p values are for the comparison of change from baseline to last CT scan versus no change from baseline within the
individual treatment groups.
b
Prolastin treatment minus placebo (LS mean change).
Table 5: Sensitivity ratios for the different lung regions (analysis of covariance model)
a
PD15 (g/L)
Outcome measure LS mean change from baseline Standard error Sensitivity index
b
F-test
c
F-test
d
Whole lung -4.12 0.539 7.64 - -
Basal region -3.84 0.604 6.36 NS -
Middle region -3.82 0.673 5.68 NS 0.642
Apical region -3.80 1.001 3.80 < 0.05 < 0.05
PD15, 15th percentile lung density; LS mean, least squares mean; NS, not significant.
a
Results based on estimates for placebo group only.
b
Ratio of
absolute value of mean change divided by standard error.
c
Ratio of outcome measure as compared to PD15 (whole lung).
d
Ratio of outcome
measure as compared to PD15 (basal region).
Respiratory Research 2009, 10:75 />Page 8 of 10
(page number not for citation purposes)
tive measure of emphysema progression than the voxel
index method.
The results of the present study indicate that, following
the adjustment of density values to correct for differences
in inspiratory level [10,13], a significant decline in lung
density is evident using all of the indices included, con-
sistent with emphysema progression. A trend suggestive of
a treatment effect was demonstrated for all indices and
was statistically significant when lung density was
assessed using PD15, as previously reported [13]. These
findings confirm the results of previous studies [7,10,14]
and provide yet further data that endorse the principle for
using the percentile density method rather than the voxel
index for monitoring studies [23], supporting the views of
an expert panel [15].
However, notwithstanding this finding, the data indicate
that differences in inspiratory level have a greater influ-
ence on PD15 than on the other indices included in the
current study. Consequently, the incorporation of a
method for correcting differences in lung volume between
scans is more critical when PD15 is used.
Regional densitometry
The rate of emphysema progression and treatment effect
in different regions of the lung were also assessed by the
15th percentile method in the current study. It is of inter-
est that, although the majority of subjects were shown to
have predominantly basal emphysema at baseline, statis-
tically significant decline in lung density was demon-
strated in all 3 lung regions consistent with the
progression of emphysema throughout the lung, as previ-
ously shown in an observational study [10]. The progres-
sion of emphysema identified in the placebo arm was
similar in all lung regions and consistently greater than
that seen in the treatment arm. However, this difference
was only statistically significant in the basal region (p =
0.040), and targeted densitometric sampling of the basal
region was shown to be more discriminative of a treat-
ment effect than whole lung assessment. In addition, a
significantly lower sensitivity index was obtained for
PD15 assessment of the apical region compared with the
basal region.
These data are of critical importance; not only do they
provide information on the natural history of emphysema
progression, but they may also influence the design and
interpretation of future studies. Emphysema is under-
stood to be a slowly progressive condition characterised
by the development of specific patterns of disease distri-
bution. These distribution patterns are viewed as pathog-
nomonic of pathological sub-type and, as more recently
implicated, of predisposing genotype [24,25]. Centrilobu-
lar emphysema is the most frequent pathological type that
occurs in subjects with usual chronic obstructive pulmo-
nary disease and is typically located towards the apical
region [26,27], whereas the most common pathological
type in subjects with AATD is panlobular emphysema,
which is typically distributed in the basal region
[16,27,28]. Although this is likely an oversimplification,
and the 2 principal pathological types may co-exist
[29,30], the pattern of emphysema distribution in the
early stages of disease conforms to this description in the
majority of individuals. As the disease progresses, it is
likely that the extension of emphysema from these initial
sites into unaffected areas will occur in a predictable
sequence until, in severe disease, it becomes increasingly
difficult to identify the initial pattern of distribution and
the pathological sub-type [16].
There is no evidence to date that indicates a spatial differ-
ential susceptibility to the development and progression
of emphysema within an individual lung, but no explana-
tion has been offered to account for the localised develop-
ment of emphysema that leads to the patterns of disease
distribution described above. However, it is logical that
the sites of initial disease must represent areas of the lung
with increased potential susceptibility to emphysematous
damage, since these areas are seemingly affected many
years in advance of the remaining lung, and this pattern
appears consistent across different patient populations.
The current study supports the contention that there may
be subtle differences in the pathogenesis of emphysema
according to regional location within the lung, since the
data clearly indicate a graded response to therapeutic aug-
mentation of AAT. The graded therapeutic effect that was
most evident in the basal region may indicate that the pro-
gression of panlobular emphysema might be retarded to a
greater extent than the progression of centrilobular
emphysema, since these 2 pathological sub-types are typ-
ically polarised towards the basal and apical regions,
respectively. Unfortunately, it was not possible to perform
a visual classification of emphysema sub-type in our
cohort because the CT protocol that was used for the cur-
rent study was intended for densitometric fidelity rather
than optimum spatial resolution. However, previous
descriptive studies have shown that apical centrilobular
emphysema is evident in approximately half of subjects
with PiZ AATD [30]. Whilst the above explanation for the
data seems most plausible, alternative explanations may
be proposed. For example, the tissue concentration of AAT
may be greater in the basal region, since improved drug
delivery would be anticipated by the greater pulmonary
blood flow that is understood to exist in this region. Nev-
ertheless, future studies will be required to address these
issues.
Conclusion
We have confirmed that PD15 is the most discriminative
densitometric index for use in studies of emphysema-
modifying therapy. Emphysematous destruction of the
Respiratory Research 2009, 10:75 />Page 9 of 10
(page number not for citation purposes)
lung is understood to be heterogeneous, and pathogno-
monic patterns of emphysema distribution have been
described. However, the current study shows that emphy-
sema progression, as assessed by densitometry, occurs
consistently throughout the whole lung. Importantly, the
rate of lung density decline was reduced by the intrave-
nous augmentation of plasma with AAT when assessed
using PD15, the most sensitive parameter. Furthermore,
the greatest effect was evident in the classically involved
basal region of the lung, and targeted sampling may there-
fore be more sensitive in detecting a benefit of treatment
on emphysema progression than whole lung assessment.
Competing interests
DP has been in receipt of non-commercial funding from
Talecris, lecture fees from Talecris and has sat on advisory
boards to Talecris. AD has in the past years received reim-
bursements, fees and funding from Bayer and Talecris
who financed the randomised clinical trial of which the
current study is a spin-off. EP has received a fee for partic-
ipation in an advisory board from Talecris who financed
the randomised clinical trial of which the current study is
a spin-off. MW and CD are employees of Talecris. RS has
been in receipt of non-commercial funding from Talecris
and lecture fees from Talecris; advisory board input to
Talecris, Baxter and Kamada.
Authors' contributions
DP contributed to the design of the study, in the analysis
and interpretation of data, and drafting of the manuscript.
AD was responsible for the Danish arm of EXACTLE and
reviewing/contributing to writing the manuscript. EP was
responsible for the Swedish arm of EXACTLE and review-
ing the manuscript. MW and CD participated in the
design of the study, in the collection, analysis and inter-
pretation of data (CD was the statistician for the study), in
the writing of the manuscript, in the decision to submit
the manuscript for publication. RS was responsible for the
UK arm of EXACTLE and reviewing/contributing to writ-
ing the manuscript. All authors have read and approved
the final manuscript.
Acknowledgements
This study was sponsored by Talecris Biotherapeutics, Inc (Research Trian-
gle Park, NC 27709, USA) and was conducted between November 2003
and January 2007. Two of the authors of the manuscript (MW and CD) are
employees of Talecris and participated in the design of the study, in the col-
lection, analysis and interpretation of data (CD was the statistician for the
study), in the writing of the manuscript and in the decision to submit the
manuscript for publication. The article-processing charge would be spon-
sored by Talecris Biotherapeutics, Inc.
Editorial assistance was provided by M. Kenig at PAREXEL and was sup-
ported by Talecris Biotherapeutics, Inc.
References
1. Spouge D, Mayo JR, Cardoso W, Muller NL: Panacinar emphy-
sema: CT and pathologic findings. J Comput Assist Tomogr 1993,
17(5):710-713.
2. Kuwano K, Matsuba K, Ikeda T, Murakami J, Araki A, Nishitani H, Ish-
ida T, Yasumoto K, Shigematsu N: The diagnosis of mild emphy-
sema. Correlation of computed tomography and pathology
scores. Am Rev Respir Dis 1990, 141(1):169-178.
3. Gevenois PA, de Maertelaer V, De Vuyst P, Zanen J, Yernault JC:
Comparison of computed density and macroscopic mor-
phometry in pulmonary emphysema. Am J Respir Crit Care Med
1995, 152(2):653-657.
4. Gevenois PA, De Vuyst P, de Maertelaer V, Zanen J, Jacobovitz D,
Cosio MG, Yernault JC: Comparison of computed density and
microscopic morphometry in pulmonary emphysema. Am J
Respir Crit Care Med 1996, 154(1):187-192.
5. Gould GA, MacNee W, McLean A, Warren PM, Redpath A, Best JJ,
Lamb D, Flenley DC: CT measurements of lung density in life
can quantitate distal airspace enlargement an essential
defining feature of human emphysema. Am Rev Respir Dis 1988,
137(2):380-392.
6. Muller NL, Staples CA, Miller RR, Abboud RT: "Density mask". An
objective method to quantitate emphysema using computed
tomography. Chest 1988, 94(4):782-787.
7. Parr DG, Stoel BC, Stolk J, Stockley RA: Validation of computed
tomographic lung densitometry for monitoring emphysema
in alpha1-antitrypsin deficiency. Thorax 2006, 61(6):485-490.
8. Stolk J, Ng WH, Bakker ME, Reiber JH, Rabe KF, Putter H, Stoel BC:
Correlation between annual change in health status and
computer tomography derived lung density in subjects with
alpha1-antitrypsin deficiency. Thorax 2003, 58(12):1027-1030.
9. Dowson LJ, Guest PJ, Stockley RA: Longitudinal changes in phys-
iological, radiological, and health status measurements in
alpha(1)-antitrypsin deficiency and factors associated with
decline. Am J Respir Crit Care Med 2001, 164(10 Pt 1):1805-1809.
10. Parr DG, Sevenoaks M, Deng C, Stoel BC, Stockley RA: Detection
of emphysema progression in alpha1-antitrypsin deficiency
using CT densitometry; methodological advances. Respir Res
2008, 9(1):21.
11. Shaker SB, Dirksen A, Laursen LC, Skovgaard LT, Holstein-Rathlou
NH: Volume adjustment of lung density by computed tomog-
raphy scans in patients with emphysema. Acta Radiol 2004,
45(4):417-423.
12. Parr DG, Stoel BC, Stolk J, Nightingale PG, Stockley RA: Influence
of calibration on densitometric studies of emphysema pro-
gression using computed tomography. Am J Respir Crit Care Med
2004, 170(8):883-890.
13. Dirksen A, Piitulainen E, Parr DG, Deng C, Wencker M, Shaker SB,
Stockley RA: Exploring the role of CT densitometry: a ran-
domised study of augmentation therapy in alpha-1 antit-
rypsin deficiency. Eur Respir J 2009, 33(6):1345-1353.
14. Dirksen A, Friis M, Olesen KP, Skovgaard LT, Sorensen K: Progress
of emphysema in severe alpha1-antitrypsin deficiency as
assessed by annual CT. Acta Radiol 1997, 38(5):826-832.
15. Newell JD, Hogg JC, Snider GL: Report of a workshop: quantita-
tive computed tomography scanning in longitudinal studies
of emphysema. Eur Respir J 2004, 23:769-775.
16. Bakker ME, Putter H, Stolk J, Shaker SB, Piitulainen E, Russi EW, Stoel
BC: Assessment of regional progression of pulmonary
emphysema with CT densitometry. Chest 2008,
134(5):931-937.
17. Dirksen A, Dijkman JH, Madsen F, Stoel B, Hutchison DC, Ulrik CS,
Skovgaard LT, Kok-Jensen A, Rudolphus A, Seersholm N, Vrooman
HA, Reiber JH, Hansen NC, Heckscher T, Viskum K, Stolk J: A ran-
domized clinical trial of alpha1-antitrypsin augmentation
therapy. Am J Respir Crit Care Med 1999, 160(5):1468-1472.
18. Dowson LJ, Guest PJ, Hill SL, Holder RL, Stockley RA: High-resolu-
tion computed tomography scanning in alpha1-antitrypsin
deficiency: relationship to lung function and health status.
Eur Respir J 2001, 17(6):1097-1104.
19. Stoel BC, Stolk J: Optimization and standardization of lung
densitometry in the assessment of pulmonary emphysema.
Invest Radiol 2004, 39(11):681-688.
Publish with Bio Med Central and every
scientist can read your work free of charge
"BioMed Central will be the most significant development for
disseminating the results of biomedical research in our lifetime."
Sir Paul Nurse, Cancer Research UK
Your research papers will be:
available free of charge to the entire biomedical community
peer reviewed and published immediately upon acceptance
cited in PubMed and archived on PubMed Central
yours — you keep the copyright
Submit your manuscript here:
/>BioMedcentral
Respiratory Research 2009, 10:75 />Page 10 of 10
(page number not for citation purposes)
20. Stolk J, Dirksen A, Lugt AA van der, Hutsebaut J, Mathieu J, de Ree J,
Reiber JH, Stoel BC: Repeatability of lung density measure-
ments with low-dose computed tomography in subjects with
alpha-1-antitrypsin deficiency-associated emphysema. Invest
Radiol 2001, 36(11):648-651.
21. Stoel BC, Vrooman HA, Stolk J, Reiber JH: Sources of error in lung
densitometry with CT. Invest Radiol 1999, 34(4):303-309.
22. Coxson HO: Computed tomography and monitoring of
emphysema. Eur Respir J 2007, 29(6):1075-1077.
23. Stoel BC, Parr DG, Bakker EM, Putter H, Stolk J, Gietema HA, Schil-
ham AM, van Ginneken B, van Klaveren RJ, Lammers JW, Prokop M:
Can the extent of low-attenuation areas on CT scans really
demonstrate changes in the severity of emphysema? Radiol-
ogy 2008, 247(1):293-294.
24. Ito I, Nagai S, Handa T, Muro S, Hirai T, Tsukino M, Mishima M:
Matrix metalloproteinase-9 promoter polymorphism associ-
ated with upper lung dominant emphysema. Am J Respir Crit
Care Med 2005, 172(11):1378-1382.
25. DeMeo DL, Hersh CP, Hoffman EA, Litonjua AA, Lazarus R, Sparrow
D, Benditt JO, Criner G, Make B, Martinez FJ, Scanlon PD, Sciurba FC,
Utz JP, Reilly JJ, Silverman EK: Genetic determinants of emphy-
sema distribution in the national emphysema treatment
trial. Am J Respir Crit Care Med 2007, 176(1):42-48.
26. Wyatt JP, Fischer VW, Sweet H: Centrilobular emphysema. Lab
Invest 1961, 10:159-177.
27. Thurlbeck WM: The incidence of pulmonary emphysema, with
observations on the relative incidence and spatial distribu-
tion of various types of emphysema. Am Rev Respir Dis 1963,
87:206-215.
28. Orell SR, Mazodier P: Pathological findings in alpha-1 antit-
rypsin deficiency. In Pulmonary Emphysema and Proteolysis Edited by:
Mittman C. New York: Academic Press; 1972:69-89.
29. Thurlbeck WM, Angus G: The relationship between emphy-
sema and chronic bronchitis as assessed morphologically.
Am Rev Respir Dis 1963, 87:815-819.
30. Parr DG, Guest PG, Reynolds JH, Dowson LJ, Stockley RA: Preva-
lence and impact of bronchiectasis in alpha1-antitrypsin defi-
ciency.
Am J Respir Crit Care Med 2007, 176(12):1215-1221.