Báo cáo y học: "Diet-induced obesity differentially regulates behavioral, biomechanical, and molecular risk factors for osteoarthritis in mice" docx
Bạn đang xem bản rút gọn của tài liệu. Xem và tải ngay bản đầy đủ của tài liệu tại đây (1.25 MB, 18 trang )
Griffin et al. Arthritis Research & Therapy 2010, 12:R130
/>Open Access
RESEARCH ARTICLE
© 2010 Griffin et al.; licensee BioMed Central Ltd. This is an open access article distributed under the terms of the Creative Commons
Attribution License ( which permits unrestricted use, distribution, and reproduction in
any medium, provided the original work is properly cited.
Research article
Diet-induced obesity differentially regulates
behavioral, biomechanical, and molecular risk
factors for osteoarthritis in mice
Timothy M Griffin
1,6
, Beverley Fermor
1
, Janet L Huebner
2
, Virginia B Kraus
2
, Ramona M Rodriguiz
3
, William C Wetsel
3,4
,
Li Cao
5
, Lori A Setton
5,1
and Farshid Guilak*
1,5
Abstract
Introduction: Obesity is a major risk factor for the development of osteoarthritis in both weight-bearing and
nonweight-bearing joints. The mechanisms by which obesity influences the structural or symptomatic features of
osteoarthritis are not well understood, but may include systemic inflammation associated with increased adiposity. In
this study, we examined biomechanical, neurobehavioral, inflammatory, and osteoarthritic changes in C57BL/6J mice
fed a high-fat diet.
Methods: Female C57BL/6J mice were fed either a 10% kcal fat or a 45% kcal fat diet from 9 to 54 weeks of age.
Longitudinal changes in musculoskeletal function and inflammation were compared with endpoint neurobehavioral
and osteoarthritic disease states. Bivariate and multivariate analyses were conducted to determine independent
associations with diet, percentage body fat, and knee osteoarthritis severity. We also examined healthy porcine
cartilage explants treated with physiologic doses of leptin, alone or in combination with IL-1α and palmitic and oleic
fatty acids, to determine the effects of leptin on cartilage extracellular matrix homeostasis.
Results: High susceptibility to dietary obesity was associated with increased osteoarthritic changes in the knee and
impaired musculoskeletal force generation and motor function compared with controls. A high-fat diet also induced
symptomatic characteristics of osteoarthritis, including hyperalgesia and anxiety-like behaviors. Controlling for the
effects of diet and percentage body fat with a multivariate model revealed a significant association between knee
osteoarthritis severity and serum levels of leptin, adiponectin, and IL-1α. Physiologic doses of leptin, in the presence or
absence of IL-1α and fatty acids, did not substantially alter extracellular matrix homeostasis in healthy cartilage
explants.
Conclusions: These results indicate that diet-induced obesity increases the risk of symptomatic features of
osteoarthritis through changes in musculoskeletal function and pain-related behaviors. Furthermore, the independent
association of systemic adipokine levels with knee osteoarthritis severity supports a role for adipose-associated
inflammation in the molecular pathogenesis of obesity-induced osteoarthritis. Physiologic levels of leptin do not alter
extracellular matrix homeostasis in healthy cartilage, suggesting that leptin may be a secondary mediator of
osteoarthritis pathogenesis.
Introduction
Osteoarthritis is a progressive, age-related disease char-
acterized by cartilage destruction and abnormal bone
remodeling, resulting in joint pain and severe disability.
The etiology of this disease is complex and multifaceted,
and numerous genetic and environment risk factors have
been identified that modify disease incidence and sever-
ity. One of the most significant risk factors is obesity. The
association between obesity and osteoarthritis has been
extensively studied; however, there is currently no com-
prehensive explanation for why obesity increases the risk
of osteoarthritis at different sites throughout the body. At
* Correspondence:
1
Department of Surgery, Duke University Medical Center, 375 Medical
Sciences Research Building, Durham, NC 27710, USA
Full list of author information is available at the end of the article
Griffin et al. Arthritis Research & Therapy 2010, 12:R130
/>Page 2 of 18
the knee joint, where obesity increases the risk of devel-
oping osteoarthritis by twofold to 10-fold [1,2], local bio-
mechanical factors associated with body mass index, limb
alignment, and quadriceps muscle strength can all influ-
ence both the onset and progression of knee osteoarthri-
tis [3-5]. Nevertheless, these factors do not explain the
association between obesity and osteoarthritis at non-
load-bearing joints [2,6,7], and suggest that, in certain
cases, systemic factors may be involved in the onset or
progression of the disease.
Attempts to identify systemic versus local factors link-
ing obesity and osteoarthritis, independent of weight-
bearing biomechanical factors associated with body mass
index, have generally been unsuccessful (for example,
serum cholesterol, glucose, lipids, uric acid, blood pres-
sure, or body fat distribution) [8-13]. Hart and colleagues
were, however, able to show that hypertension, hypercho-
lesterolemia, and increased blood glucose were associ-
ated with unilateral and bilateral knee osteoarthritis
independent of obesity [14]. Obesity is associated with
mild, chronic inflammation [15], suggesting that inflam-
matory molecules secreted from adipose tissue may pro-
vide a critical, nonbiomechanical link between obesity
and osteoarthritis. Numerous proinflammatory cytokines
that are secreted from hypertrophic abdominal adipose
tissue (that is, adipokines or cytokines such as leptin,
TNFα, IL-1, and IL-6) are elevated in osteoarthritic joints
and can induce catabolic processes in chondrocytes in
vitro, leading to extracellular matrix degradation. In par-
ticular, leptin has engendered intense interest because it
upregulates both catabolic and anabolic activities of
chondrocytes [16-18], consistent with cellular changes
associated with osteoarthritis. In addition to effects of
adipokines on chondrocyte matrix metabolism, adipok-
ines and associated metabolic abnormalities may contribute
to joint degeneration through impaired neuromuscular
function that alters the mechanical environment of the
joint. An integrative approach that encompasses changes
in biomechanical and inflammatory factors associated
with obesity thus represents a critical step in identifying the
etiopathology of obesity-associated joint degeneration.
A primary clinical outcome of osteoarthritis is func-
tional disability caused by chronic joint pain. There has
been limited success, however, in predicting joint pain
from pathological joint changes [19,20]. This limitation
may be attributed to pain perception itself since it
involves nociceptive factors that mediate the intensity of
the afferent signal and cognitive factors that excite or
suppress this nociceptive response [21,22]. Obesity in
older adults is associated with increased prevalence and
incidence of pain [23]; and in these patients with knee
osteoarthritis, cognitive factors reduce the self-efficacy in
pain management [24]. The relationship between
reduced self-efficacy, which may occur with disorders of
anxiety or depression, and psychological aspects of noci-
ception associated with obesity is poorly understood and
represents an opportunity to investigate behavioral and
molecular risk factors relating joint structural changes to
pain.
In the present study, we used a dietary model of obesity
to address the integrated role of biomechanical and
inflammatory factors in the pathogenesis of osteoarthri-
tis, and we investigated the effect of dietary obesity on
factors affecting pain-related behaviors in mice. When
fed a high-fat diet, C57BL/6J mice develop changes asso-
ciated with metabolic syndrome in humans including
hyperglycemia, hyperinsulinemia, hypertension, and cen-
tral adiposity [25]. It has been reported previously that
C57BL mice develop early-onset osteoarthritis when fed
a high-fat diet [26]. Little is known, however, about the
mechanism by which dietary fat induces osteoarthritis or
whether this strain of mice accurately models the patho-
genesis of the human disease [27]. C57BL/6 mice vary in
their susceptibility to diet-induced obesity [28]. We
therefore exploited this variable dietary response to
investigate the effect of a high-fat diet, with or without
high adiposity, on characteristics of osteoarthritis. Based
upon these findings, we examined independent and syn-
ergistic effects of adipokines and fatty acids on cartilage
matrix homeostasis in a porcine cartilage explant model.
We show that diet-induced obesity mediates the develop-
ment of osteoarthritis in proportion to increases in adi-
posity and serum leptin concentration. We also
demonstrate that a high-fat diet decreases motor perfor-
mance and strength, causes thermal hyperalgesia, and
alters coping-related behaviors in mice, indicating impor-
tant dietary effects on motor function and pain
responses. These findings are consistent with clinical
studies of osteoarthritis and support the use of diet-
induced obese mouse models to study behavioral and
structural changes associated with osteoarthritis.
Materials and methods
Animals
All animal care and experimental procedures were con-
ducted under an approved protocol from the Duke Uni-
versity Institutional Animal Care and Use Committee.
Female C57BL/6J mice were purchased from The Jackson
Laboratory (Bar Harbor, ME, USA). Mice were group-
housed in filter-top cages with ad libitum access to water
and chow. Mice were placed on either a high-fat diet
(D12451, 45% kcal fat; Research Diets, New Brunswick,
NJ, USA) or a control diet (D12450B, 10% kcal fat;
Research Diets), beginning at 9 weeks of age. Animal
weights were recorded weekly, and mice remained on
their respective diets until the completion of the study at
54 weeks of age.
Griffin et al. Arthritis Research & Therapy 2010, 12:R130
/>Page 3 of 18
Evaluation of osteoarthritis
Degenerative joint changes were evaluated by histological
analysis and biomechanical measurements of cartilage
compressive material properties. For histological analysis,
intact knee joints were decalcified, dehydrated, and
embedded in paraffin. Serial sagittal 6 μm sections were
collected throughout the medial and lateral condyles.
Sections were stained with hematoxylin, fast green, and
safranin-O, and sections in the tibiofemoral cartilage-car-
tilage contact region from the medial and lateral condyles
were scored for degenerative changes using a modified
Mankin scoring system [29]. Briefly, this scoring system
included changes in articular cartilage structure (0 to 11),
safranin-O staining (0 to 8), tidemark duplication (0 to 3),
fibrocartilage (0 to 2), chondrocyte clones in uncalcified
cartilage (0 to 2), hypertrophic chondrocytes (0 to 2), and
relative subchondral bone thickness (0 to 2) for a maxi-
mum score of 30 per location. Scores were determined by
averaging values from three experienced, blinded graders
for the summation of four locations in the joint: lateral
femur, lateral tibia, medial femur, and medial tibia.
Degenerative changes in the mandibular condyle of the
temporomandibular joint were evaluated following this
scoring and grading system, except that grading was
restricted to changes in cartilage structure and safranin-
O staining intensity.
Compressive cartilage material properties were deter-
mined by conducting a micro-indentation test of the
medial tibial plateau using an electromechanical test sys-
tem (ELF 3200; EnduraTEC, Minnetonka, MN, USA)
instrumented with a low-capacity load cell (250 g; Senso-
tec, Columbus, OH, USA) and an extensometer (1 mm;
Epsilon, Jackson, WY, USA) as described previously [30].
After applying a tare load of 0.15 g force and allowing it to
equilibrate, a 0.2 g step load (ramping speed of 500 g/sec-
ond) was applied to the cartilage surface and allowed to
equilibrate for 200 seconds. Time, reaction force, and dis-
placement data were collected at 1 Hz throughout the
test. After mechanical testing, cartilage thickness was
measured from the tissue surface to the calcified cartilage
at a site adjacent to the test site, using previously
described histological procedures. Indentation test
results, together with a nonlinear optimization program
employing a genetic algorithm for parameter estimation,
were input into a biphasic finite element model of the
micro-indentation test, which was used to obtain the
biphasic, compressive material properties of tibial articu-
lar cartilage [30].
To quantify the effects of a high-fat diet on knee joint
skeletal morphology, formalin-fixed joints were scanned
using a microCT system (microCT 40; Scanco Medical
AG, Basserdorf, Switzerland). A global thresholding pro-
cedure was used to segment calcified tissue from soft tis-
sue. Linear attenuation values for the calcified tissue were
scaled to bone density values (mg hydroxyapatite/cm
3
)
using a hydroxyapatite calibration phantom. A direct
three-dimensional approach in the epiphyseal region dis-
tal to the subchondral bone and proximal to the growth
plate was applied to evaluate changes in the relative tra-
becular bone volume.
Musculoskeletal function, gait, and spontaneous activity
testing
Fore limb and hind limb grip strength were measured
with a mouse grip strength meter (Ugo Basile, Varese,
Italy) [31]. Grip strengths were measured after 13, 17, and
35 weeks of high-fat feeding. Motor learning, coordina-
tion, and endurance were assessed using a rotarod (Med-
Associates, St Albans, VT, USA) with accelerating speed
(4 to 40 rpm over 5 minutes) and constant speed (24 rpm)
protocols [31]. Rotarod tests were conducted after 21 and
34 weeks of high-fat feeding.
Gait analysis was conducted during steady-speed spon-
taneous locomotion in a custom-built arena (25 cm × 75
cm) that contained a plexiglass bottom and a mirror posi-
tioned at 45° to allow simultaneous sagittal and ventral
plane views. Spontaneous animal locomotion was
recorded in the arena using a Motion Scope high-speed
video camera (200 Hz; Red Lake Imaging Co., Tallahas-
see, FL, USA), and freely chosen speeds and stride fre-
quencies were determined for each animal from three
steady-speed locomotor bouts through the central 10 cm
segment of the area. Gait tests were conducted after 10,
15, 21, 28, and 35 weeks of high-fat feeding. Gait kinetics
were recorded in a custom arena fitted with a small force
platform (AMTI, Watertown, MA, USA) that is capable
of measuring the peak vertical ground reaction force in
mice [32]. Hind limb vertical ground reaction forces and
sagittal-plane high-speed video were recorded during
spontaneous steady-speed locomotor bouts through the
central 10 cm segment of the arena. Force-platform data
were recorded after 41 weeks of high-fat feeding. Sponta-
neous locomotor activities in the open field (21 cm × 21
cm × 30 cm) were monitored by photobeams for 72 hours
in an automated Omnitech Digiscan apparatus (AccuS-
can Instruments, Columbus, OH, USA) [31]. Light-phase
and dark-phase locomotor activity (horizontal distance)
was analyzed with the VersaMax program (AccuScan
Instruments). Spontaneous locomotor activity was mea-
sured after 5, 11, 18, and 30 weeks of high-fat feeding.
Cytokine and adipokine measurements
Blood was collected in anesthetized mice and dispensed
into BD Vacutainer SST serum tubes (VWR, West Ches-
ter, PA, USA). After 30 minutes, tubes were centrifuged
for 15 minutes at 3,500 rpm, and the serum was aliquoted
for immediate storage at -80°C until analysis.
Griffin et al. Arthritis Research & Therapy 2010, 12:R130
/>Page 4 of 18
Levels of serum leptin were quantified by a sandwich
ELISA specific for the mouse (Linco #EZML-82K; Biller-
ica, MA, USA). Intra-assay and inter-assay coefficients of
variation were 3% and 2.7%, respectively. Serum adi-
ponectin concentrations were quantified by a sandwich
ELISA specific for the mouse (Linco #EZMADP-60K; Bil-
lerica, MA, USA). Intra-assay and inter-assay coefficients
of variation were 5.7% and 5.6%, respectively. IL-1α and
IL-1-receptor antagonist serum levels were quantified by
a quantitative sandwich ELISA developed specifically for
the mouse (Quantikine #MLA00 and MRA00; R&D Sys-
tems, Minneapolis, MN, USA). Intra-assay and inter-
assay coefficients of variation for IL-1α were 4.2% and
4.5%, respectively, and for IL-1-receptor antagonist were
2.4% and 5.7%, respectively.
The following cytokines and chemokines were mea-
sured in the serum using a 20-plex multiplex bead immu-
noassay (#LMC0006; Biosource, Carlsbad, CA, USA),
specific to the mouse, with the Luminex 100 instrument:
IL-1α, IL-1β, IL-2, IL-4, IL-6, IL-10, IL-12, IL-17, kerati-
nocyte-derived cytokine (mouse analog of IL-8), IFNγ-
induced protein, macrophage inflammatory protein-1α,
and TNFα. All samples were analyzed as recommended
by the manufacturer.
Tissue culture experiments
Full-thickness articular cartilage explants were harvested
from the femoral condyles of skeletally mature female
pigs and were allowed to stabilize in culture for 72 hours
at 37°C under 5% CO
2
as previously described [33].
Explants were cultured in a 48-well plate containing 1 ml/
well culture medium consisting of Dulbecco's low glucose
modified Eagle medium (#11885-084; Invitrogen, Carls-
bad, CA, USA) with 10% heat-inactivated FBS (Invitro-
gen), 0.1 mM nonessential amino acids (Invitrogen), 10
mM HEPES (Invitrogen), and 37.5 μg/ml ascorbate-2-
phosphate (Sigma, St Louis, MO, USA). Explants were
treated independently or in combination with recombi-
nant human leptin (1, 10, and 100 ng/ml; Bachem, Tor-
rance, CA, USA), porcine IL-1α (0.1 ng/ml; R&D
Systems), or 1:1 palmitic:oleic fatty acids and
L-carnitine
(0.5 mM and 1 mM, respectively; Sigma-Aldrich, St.
Louis, MO, USA) for 48 hours. Fatty acids were solu-
blized in 1% BSA (fraction V; Sigma-Aldrich) and Dul-
becco's low glucose modified Eagle medium. Then 1%
BSA and 1 mM
L-carnitine were added to control culture
medium for fatty acid treatment experiments. Proteogly-
can and protein synthesis rates were quantified simulta-
neously with leptin treatments by measuring the
incorporation rates of [
35
S]sulfate (5 μCi/ml) and
[
3
H]proline (20 μCi/ml), respectively. Explants were
washed to remove unincorporated label and fully
digested as previously described [33] prior to measuring
disintegration rates. Total sulfated glycosaminoglycan (S-
GAG) release into the media was measured with the 1,9-
dimethylmethylene blue optical absorbance assay [33].
Nitric oxide production was quantified by measuring the
amount of nitrite and nitrate (NO
x
) in the media using
previously described methods and reagents [34].
Affective behavioral trait measurements
Anxiety-like and depressive-like behaviors were evalu-
ated in the animals following 40 weeks of high-fat feed-
ing. The elevated zero maze was used to assess anxiety-
like behaviors [31]. The maze consisted of a 5.5 cm wide
circular (34 cm in diameter) black platform elevated 43
cm from the floor and was illuminated at ~60 lux. The
maze comprised two open quadrants and two closed
quadrants, all equal in size. The two closed quadrants
were opposite each other and were enclosed by black
walls 11 cm high. Mice were placed into a closed area and
behaviors were videotaped for 5 minutes from a camera
suspended 200 cm over the center of the maze.
Behavior was scored subsequently by trained observers,
blind to the group assignment, using standard software
(version 5.0; Noldus Information Technology, Leesburg,
VA, USA). The behaviors included percentage time spent
in the open areas, total numbers of transitions between
the two open areas, stretch-attend postures, head-dip-
ping behavior, and percentage time spent in freezing
behavior. Depressive-like behaviors were examined by tail
suspension [31]. Testing was conducted in a Med-Associ-
ates mouse tail suspension apparatus and analyzed using
Threshold software. The day before testing, mice were
tail marked and body weights were entered into the soft-
ware program. For testing, mice were suspended by their
tails for 6 minutes and time spent immobile was
recorded.
Thermal hyperalgesia experiments
Thermal sensitivity was evaluated using a sequential hot-
plate and tail flick test. For the hotplate test, an animal
was placed on a hotplate (52 ± 1°C; Columbus Instru-
ments, Columbus, OH, USA) and latency to the first paw
flick (left/right, fore/hind) was recorded in seconds. For
the tail-flick test, animals were gently restrained in a
towel, and the mid-portion of its tail was placed beneath
a radiant light source (Columbus Instruments). Heat was
applied via focused light, and tail withdrawal latency was
recorded. This sequence - hotplate followed by tail flick -
was repeated at 0, 15, 30, 60, 90, 120, and 240 minutes.
Statistical analysis
We statistically analyzed differences due to diet and vari-
ation in dietary obesity (that is, low gainer (LG) vs. high
gainer (HG)) using a hierarchical analysis of variance.
The first level compared control and high-fat diet groups.
The second level compared how variation in dietary obe-
Griffin et al. Arthritis Research & Therapy 2010, 12:R130
/>Page 5 of 18
sity (that is, LG vs. HG) affected osteoarthritis outcome
measurements. In addition, we evaluated how the varia-
tion in dietary obesity affected osteoarthritis outcomes by
conducting an analysis of covariance, using percentage
body fat as the covariate. To assess the relative effect of
diet, percentage body fat, and knee osteoarthritis on bio-
mechanical, neurobehavioral, and inflammatory out-
comes, we constructed bivariate and multivariate
generalized linear models to identify which variables
(that is, diet, percentage body fat, or knee osteoarthritis)
remained independently associated with the outcome
measures in the multivariate model. Statistical signifi-
cance was reported at the 95% confidence level (P < 0.05),
and the multivariate analyses repeated-testing error was
controlled for using a 5% false discovery rate correction
[35]. Statistical analyses were conducted using JMP 8.0
(SAS Institute, Cary, NC, USA).
Results
Variation in susceptibility to diet-induced obesity
determines progression of osteoarthritis
C57BL/6 mice are prone to dietary obesity and the meta-
bolic disorders associated with obesity; however, recent
studies have documented a significant amount of pheno-
typic variation in the response of C57BL/6 to high-fat
feeding [28,36]. To characterize susceptibility to diet-
induced obesity, we examined the body mass, body mass
gain, body fat, and visceral fat following 45 weeks of feed-
ing mice either a control chow or a high-fat chow diet
(Figure 1a). All high-fat-fed mice had greater body mass,
body mass gain, body fat, and visceral fat than the con-
trol-chow-fed mice, indicating that all mice fed the high-
fat diet were susceptible to diet-induced changes in adi-
posity. The coefficient of variation for each of these four
indices, however, was approximately double for the high-
fat-fed mice compared with that for the control-fat-fed
mice. High-fat feeding thus amplified the normal varia-
tion in body mass and fat.
Within the high-fat-fed mice, specific individual mice
fell in the top half of the distribution for body mass, body
mass gain, body fat mass, and visceral fat mass (Figure
1a); these mice were thus labeled HG mice. Mice that fell
in the bottom half of the distribution were labeled LG
mice. When body mass was compared between the HG
mice and LG mice over time, the HG mice had signifi-
cantly greater body mass than controls after about 4
weeks of high-fat feeding, whereas the LG mice did not
develop significantly greater body masses than controls
until after about 38 weeks of high-fat feeding (Figure 1b).
Body mass was thus elevated relative to controls for 41
weeks in HG mice and for 7 weeks in LG mice - a nearly
sixfold greater cumulative time course of elevated body
mass in HG mice versus LG mice.
We focused on the incidence of knee osteoarthritis with
dietary obesity since the knee joint is the primary joint
affected by obesity in humans and significant spontane-
ous osteoarthritis of the knee occurs in mice. HG mice
showed a significant increase in the incidence of knee
osteoarthritis due to a loss of cartilage matrix proteogly-
cans as indicated by a loss of safranin-O staining (Figure
2a and Table 1). Susceptibility to diet-induced obesity
directly affected safranin-O staining intensity, with LG
mice being protected from loss and HG mice having
accelerated loss compared with controls (Table 1). In fact,
among mice fed a high-fat diet, 90% of the variation in
loss of cartilage proteoglycan staining intensity was
explained by variation in body fat (r
2
= 0.90, P < 0.01).
The onset of osteoarthritis, due in part to the loss of
proteoglycan content in cartilage, is characterized by
changes in the material properties of the articular carti-
lage. These changes typically include a decrease in the tis-
sue aggregate modulus and an increase in fluid
permeability [37], which we measured on the medial tib-
ial plateau using a micro-indentation test [30]. The aggre-
gate modulus was significantly increased in mice fed a
high-fat diet (Table 1), due in large part to the elevated
modulus and proteoglycan content of the medial tibial
cartilage matrix of the LG mice compared with controls.
Moreover, consistent with the decreased proteoglycan
content in the knee cartilage in HG mice versus LG mice,
aggregate modulus decreased with increasing body fat in
high-fat fed mice (r
2
= 0.64, P < 0.05). Neither diet nor
susceptibility to dietary obesity significantly altered fluid
permeability (Table 1). These observations indicate that a
high-fat diet alters the material properties of articular
cartilage by increasing the aggregate modulus in a mech-
anism closely tied to proteoglycan density. Furthermore,
the onset of degenerative changes in HG mice, most nota-
bly proteoglycan loss, appears to at least partly revert the
aggregate modulus to control levels.
We also examined the temporomandibular joint to
determine whether a systemic factor, such as adipose-
associated inflammation, contributes to the increased
incidence of osteoarthritis at nonweight-bearing sites.
There were no significant differences in cartilage struc-
ture with diet or between HG mice and LG mice (Figure
2b and Table 2). Although high-fat feeding did not signif-
icantly increase the loss of safranin-O staining intensity, a
trend for this effect was observed (Table 2).
Diet and adiposity alter functional biomechanical
parameters independent of osteoarthritis severity
Osteoarthritis is associated with muscle weakness,
impaired motor performance, and altered joint loading in
human subjects. To assess how these factors are affected
by a high-fat diet and correspond to osteoarthritis sever-
ity, we examined longitudinal changes in grip strength,
Griffin et al. Arthritis Research & Therapy 2010, 12:R130
/>Page 6 of 18
locomotor coordination, gait, and spontaneous locomo-
tor activity. Forelimb grip strength was significantly
reduced in HG mice by approximately 25% compared
with control mice after 13 weeks of high-fat feeding with
no further changes occurring beyond this timepoint (Fig-
ure 3a). Forelimb grip strength also decreased after 13 to
17 weeks of high-fat feeding in LG mice and remained
significantly lower throughout 35 weeks of feeding. After
17 weeks of high-fat feeding, hind limb grip strength sig-
nificantly decreased in HG mice but not in LG mice rela-
tive to controls and remained weakened after 35 weeks of
high-fat feeding (Figure 3b). Surprisingly, the strong neg-
ative association between grip strength and a high-fat
diet (or percentage body fat) did not correspond to a neg-
ative association between grip strength and knee osteoar-
thritis (Table 3). A multivariate model indicates diet
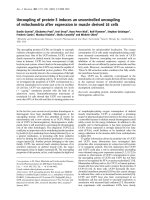
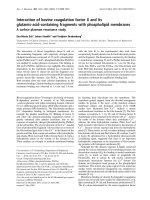
Figure 1 Diet-induced changes in body mass and fat levels in control and high-fat fed mice. (a) High-fat (HF)-fed mice showed much greater
levels of variation in body mass, body fat, and visceral fat compared with control mice. The same individual HF mice (denoted numerically) fell in either
the upper half or lower half of the bar plot distributions for these variables. Those mice in the upper half of the distribution were classified as high
gainers (HG), and those in the lower half were classified as low gainers (LG). (b) Body mass in HG mice was greater than controls after 4 weeks of HF
feeding compared with 37 weeks of HF feeding in LG mice (P < 0.05). Bar indicates duration of HF feeding. Data shown as mean ± standard error of
the mean.
(a)
Body fat
3
7
6
4
1
8
10
9
5
25
20
15
10
5
Control HF
Visceral fat
3
7
6
4
1
8
10
9
5
6
5
4
3
2
1
0
Control HF
g
Body mass
3
7
6
4
1
8
10
9
5
55
50
45
40
35
30
25
20
Control HF
HG
LG
C
ontrol H
F
0
C
ontrol H
F
C
ontrol H
F
HF - High Gainer
HF - Low Gainer
Control
HG
LG
Control
Age (wks)
Body mass (g)
0
(b)
Griffin et al. Arthritis Research & Therapy 2010, 12:R130
/>Page 7 of 18
remained a significant covariate with grip strength when
also accounting for percentage body fat and knee osteoar-
thritis score (Table 3).
To further test the relationship between musculoskele-
tal force output and knee osteoarthritis, we conducted a
kinetic gait analysis using a force plate to measure foot-
ground reaction forces. The peak vertical force applied to
the ground at mid-stance during trotting gaits approxi-
mates the maximal voluntary limb force during gait [38].
We found that the peak vertical force applied to the
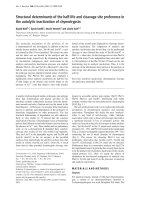
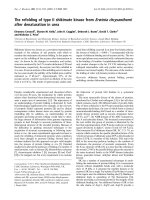
Figure 2 Increased osteoarthritic changes in high-fat-fed high gainer mice. (a) Representative histological images of knee joints showing in-
creased proteoglycan depletion in high gainer (HG) mice as indicated by a loss of the red safranin-O staining. Scale bar = 100 μm. (b) Representative
histological images of temporomandibular joints in control, low gainer (LG) and HG mice. There is a nonsignificant trend (P = 0.10) for increased loss
of safranin-O staining in LG mice and HG mice. Scale bar = 100 μm.
Control LG HG
(a)
(b)
Control LG HG
Table 1: Knee joint histology, tibial cartilage material property, and trabecular bone osteoarthritis outcomes
Parameter Control LG HG Diet (P value) Diet × percentage body fat (P value)
Knee modified Mankin score 18.2 ± 1.5 15.8 ± 2.5 25.1 ± 1.5* 0.17 0.003
Cartilage degeneration 4.4 ± 0.7 5.1 ± 0.9 6.7 ± 0.9 0.11 0.47
Safranin-O loss 7.7 ± 1.0 3.8 ± 0.3*
11.7 ± 0.8*
#
0.66 <0.001
Tidemark duplication 0.22 ± 0.11 0.16 ± 0.10 0.13 ± 0.13 0.60 0.29
Chondrocyte cloning 0.67 ± 0.22 0.42 ± 0.16 1.1 ± 0.3 0.70 0.14
Hypertrophic chondrocytes 1.8 ± 0.3 1.3 ± 0.7 2.1 ± 0.4 0.88 0.18
Fibrocartilage 0.04 ± 0.04 0.33 ± 0.33 0 ± 0 0.48 0.34
Relative subchondral bone thickness 3.4 ± 0.3 4.7 ± 0.5 3.5 ± 0.7 0.26 0.31
Aggregate modulus (H
A
) 1.49 ± 0.18 2.18 ± 0.03 1.74 ± 0.20 0.003 0.10
Permeability (× 10
-16
, m
4
/N-s)
2.38 ± 0.67 1.90 ± 0.32 1.80 ± 0.60 0.48 0.77
Relative tibial epiphysis trabecular
bone volume
0.43 ± 0.02 0.51 ± 0.07 0.40 ± 0.03 0.56 0.72
Statistical differences among control, low gainer (LG), and high gainer (HG) values were determined with a hierarchical analysis of variance.
Overall diet and diet × percentage body fat effects were analyzed by analysis of covariance. *P < 0.05 compared with control values. #P < 0.05 for
HG versus LG values. P values less than 0.05 shown in bold.
Griffin et al. Arthritis Research & Therapy 2010, 12:R130
/>Page 8 of 18
ground, normalized to body mass, was negatively related
to the severity of osteoarthritic changes in the knee (Fig-
ure 3c). This finding suggests that modulating limb force
is functionally related to the severity of knee osteoarthri-
tis. One behavioral change that mice may use to reduce
ground reaction forces is decreasing gait velocity. In fact,
self-selected gait velocity was slower in 35-week-old mice
fed a high-fat diet (Table 3). This reduction was not cor-
related with percentage body fat or knee osteoarthritis
(Table 3), and it did not occur in conjunction with other
gait changes, such as stride frequency or prompted gait
conditions.
A potential confounding factor in examining the rela-
tionship between obesity and osteoarthritis is the effect
of either obesity or osteoarthritis on spontaneous activity
levels. Joint unloading lowers cartilage proteoglycan con-
tent and structure, whereas remobilization of joints and
exercise-stimulated joint loading increases cartilage
thickness and proteoglycan content [39-41]. Spontaneous
locomotion, indicated here as horizontal distance trav-
eled, was not significantly different among the control
mice, LG mice, or HG mice over a 72-hour period at four
different time points of high-fat feeding (Figure 3d,e).
Susceptibility to diet-induced obesity does not therefore
Table 2: Temporomandibular joint osteoarthritis scoring
Parameter Control LG HG Diet (P value) Diet × percentage body fat (P value)
Temporomandibular Composite score 7.0 ± 0.4 8.6 ± 0.5 8.4 ± 1.7 0.16 0.77
Cartilage degeneration 2.7 ± 0.3 3.4 ± 0.3 2.9 ± 1.1 0.56 0.96
Safranin-O loss 4.2 ± 0.3 5.2 ± 0.6 5.5 ± 0.9 0.10 0.67
Comparisons with control values or between low gainer (LG) and high gainer (HG) high-fat diet-fed groups were not statistically significant
(P > 0.05).
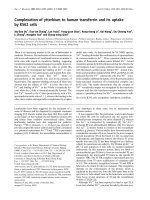
Figure 3 Musculoskeletal performance in high-fat-fed mice. (a) Fore-limb grip strength reductions in high-fat (HF)-fed mice over time (three mea-
surements/animal/timepoint). (b) Hind limb grip strength reductions in HF-fed high gainer (HG) mice over time (three measurements/animal/time-
point). (c) Knee joint osteoarthritis (OA) scores were negatively correlated with the peak vertical component of the ground reaction force (expressed
per unit body mass) from the hind limb during self-selected steady-speed locomotion. (d) Spontaneous horizontal distance traveled during a 72-hour
period in control and HF-fed mice at 39 weeks of age. (e) Average horizontal distance traveled during a 10-hour dark period by control and HF-fed
mice at different ages. (f) Comparison of knee OA score with the cumulative dark phase distance traveled (average of 15, 20, 27, and 39 weeks of age).
Data shown as mean ± standard error of the mean. *P < 0.05 versus age-matched controls.
(a) (b) (c)
*
*
*
*
*
)
R
2
= 0.67*
HG
LG
Control
HG
LG
Control
HG
LG
Control
*
*
(d) (e) (f)
)
Dark Dark Dark
HG
LG
Control
HG
LG
Control
f)
HG
LG
Control
Distance traveled (m)
Distance traveled (m)
Cumulative
Distance traveled (m)
Griffin et al. Arthritis Research & Therapy 2010, 12:R130
/>Page 9 of 18
appear to be mediated by differences in the levels of
spontaneous locomotion. When averaged across all time
points, nearly all of the mice showed the same level of
spontaneous activity despite a more than twofold varia-
tion in knee osteoarthritis severity (Figure 3h).
The observation that HG mice have reduced strength
but normal spontaneous activity levels suggests that con-
ditions which challenge the musculoskeletal system
beyond normal activities may reveal impaired motor
function. In the clinical setting, functional impairment is
also assessed with physical activity challenges, such as a
sit-to-stand test or a 6-minute walk test. For mice, we
measured the latency to fall using a rotarod test to deter-
mine whether diet-induced obesity impaired motor func-
tion. There were no significant differences in latency to
fall after 21 weeks of high-fat feeding (P = 0.79); however,
after 34 weeks of high-fat feeding, performance
decreased with a high-fat diet and in proportion to per-
centage body fat (Table 3). A multivariate analysis indi-
cates that percentage body fat remains a significant
predictor of impaired performance, when accounting for
diet and knee osteoarthritis score (Table 3). The time
Table 3: Biomechanical, neurobehavioral, and inflammatory changes with diet-induced obesity
Bivariate (r) Multivariate (β, r
2
)
Parameter Diet Percentage
body fat
Knee OA Diet (β) Percentage
body fat (β)
Knee OA (β) Whole model (r
2
)
Biomechanical
Dark phase locomotion (m) 0.25 0.26 0.14 - - - 0.05
Velocity (cm/s) -0.42* -0.40 0.01 1.02 -0.11 0.14 0.21
Prompted velocity (cm/s) -0.26 -0.19 0.09 - - - 0.09
Stride frequency (Hz) -0.34 -0.37 0.08 - - - 0.22
Prompted stride frequency (Hz) -0.31 -0.29 0.03 - - - 0.11
Rotarod latency to fall (s) -0.71*** -0.83*** -0.33 -18.7 -10.1** 0.55
0.70***
a
Forelimb grip strength (g) -0.70*** -0.54* -0.16 15.6** 0.73 -0.15
0.50**
a
Hind limb grip strength (g) -0.45* -0.46* -0.26 - - - 0.21
Neurobehavioral
Hotplate withdrawal latency (s) -0.63** -0.55** -0.31 2.24 0.076 -0.106 0.43*
Tail-flick withdrawal latency (s) -0.02 -0.01 -0.13 - - - 0.02
Time in open areas (%total)
b
-0.47* -0.46** 0.01 2.56 -0.18 0.18 0.43*
Time freezing (%total)
b
0.46* 0.32 0.33 -14.06* -1.16 0.95 0.35*
Stretch attends
b
-0.66*** -0.60** -0.20 4.85 -0.03 -0.03
0.51**
a
Open-closed transitions
b
-0.18 -0.17 0.32 - - - 0.23
Time immobile
c
(s)
-0.56** -0.44 -0.30 63.1* 4.0 -3.34 0.37
Inflammatory
IL-1α -0.08 -0.09 -0.49* 18.8 3.0 -8.2* 0.27
IL-1 receptor antagonist -0.05 -0.07 -0.18 - - - 0.03
IL-12 0.18 0.17 0.19 - - - 0.06
Keratinocyte-derived cytokine 0.17 0.17 -0.21 - - - 0.12
IFNγ-induced protein 0.10 -0.01 0.06 - - - 0.08
MIP-1α 0.24 0.39 0.17 - - - 0.22
Leptin 0.84*** 0.95*** 0.53** -1.9 2.9*** 1.1*
0.93***
a
Adiponectin -0.19 -0.02 -0.40 2694* 324* -274** 0.42*
Inflammatory concentrations were measured in serum, and time points for comparisons are described in the text. MIP-1α, macrophage
inflammatory protein-1; OA, osteoarthritis.
a
P < 0.05 controlling for 5% false discovery rate correction of multivariate whole-model analyses.
b
Zero-maze behavioral test.
c
Tail suspension test. *P < 0.05, **P < 0.01, ***P < 0.001 using bivariate and multivariate generalized linear modeling.
P values less than 0.05 shown in bold.
Griffin et al. Arthritis Research & Therapy 2010, 12:R130
/>Page 10 of 18
course of this decrease in motor performance indicates
that decreased motor performance occurs subsequent to
the decrease in grip strength, suggesting that muscle
weakness precedes impaired musculoskeletal function
associated with diet-induced obesity in mice.
Pain-sensing and coping behavioral impairments due to
high-fat feeding
Pain perception involves an interplay among nociceptive
factors that mediate the intensity of the afferent signal
and behavioral factors that excite or suppress this nocice-
ptive response [21,22]. The effect of a high-fat diet on
nociceptive behavioral responses was assessed via two
acute thermal pain tests, the hotplate and tail-flick tests.
These tests provided insight into nociceptive mecha-
nisms generally believed to involve primarily supraspinal
and spinal pathways, respectively [42]. The withdrawal
latency for the hotplate test over the first 60 minutes of
testing was significantly faster in LG mice and HG mice,
compared with control mice (Figure 4a). With repeated
testing, the withdrawal latency for the high-fat-fed mice
became prolonged such that, by 100 minutes after the
first test, the withdrawal latencies were not different from
the controls. The bivariate associations between the ini-
tial withdrawal latency and diet or percentage body fat
disappeared in the multivariate analysis that included
diet, percentage body fat, and knee osteoarthritis score,
indicating that neither diet or percentage body fat was
independently related to the thermal hyperalgesia (Table
3). For the tail-flick test, there were no differences in
withdrawal latencies over the first 120 minutes of testing
(Figure 4b). By the 240-minute time point, however, the
withdrawal latencies of the high-fat-fed mice were signifi-
cantly faster than controls.
Affective behavioral traits, such as anxiety-like and
depressive-like behaviors, may result from chronic pain
or may contribute to an impaired ability to cope with
exposure to painful stimuli. Anxiety-like responses were
assessed in the zero maze after 41 weeks of feeding in
control mice, LG mice, and HG mice that were naïve to
the maze [31]. High-fat-fed animals spent less time in the
open areas of the maze and more time in freezing pos-
tures (Table 3). High-fat-fed animals also displayed fewer
stretch attend postures, although there was no significant
difference in open-closed area transitions (Table 3). The
bivariate associations between diet and freezing behavior
remained in the multivariate analysis, indicating that diet
was independently related to this behavior even when
controlling for percentage body fat and knee osteoarthri-
tis score (Table 3). Behaviors were also assessed with tail
suspension, where increased immobility time indicates a
reduction in antidepressive-like behavior [43]. High-fat
fed animals were significantly less immobile during the
test (Table 3). Furthermore, there was no significant asso-
ciation with percentage body fat in the bivariate and mul-
tivariate models, indicating that a high-fat diet - rather
than the degree of dietary obesity - mediates their antide-
pressive-like behaviors.
Systemic adipokines, diet-induced obesity, and
osteoarthritis
Diet-induced obesity is associated with a shift in activities
of proinflammatory and anti-inflammatory mediators
that generally favor elevated tissue and systemic proin-
flammatory immune responses. Additionally, a number
of proinflammatory cytokines have been implicated in
the pathogenesis of osteoarthritis, including IL-6, IL-17,
and TNFα. Serum levels of these cytokines were below
the lowest level of quantification for many animals in a
manner that was independent of the diet group, and thus
were not reported. Serum concentrations of other detect-
able cytokines and chemokines, such as IL-12, keratino-
cyte-derived cytokine, IFNγ-induced protein, and
macrophage inflammatory protein-1α, were not indepen-
dently associated with changes in diet, percentage body
fat, or knee osteoarthritis score (Table 3). IL-1α is a criti-
cal proinflammatory cytokine involved in cartilage catab-
olism and the pathogenesis of type 2 diabetes [44,45]. A
high-fat diet and percentage body fat were not signifi-
cantly associated with IL-1α levels (Table 3). The serum
IL-1α concentration, however, was negatively associated
with knee osteoarthritis score in both a bivariate and a
multivariate analysis (Table 3). This finding was not asso-
ciated with changes in IL-1-receptor antagonist levels,
which were not altered by diet, percentage body fat, or
knee osteoarthritis severity (Table 3).
Leptin, an adipokine with proinflammatory activity,
was increased systemically in high-fat-fed mice following
a pattern that was similar to the temporal changes in
body mass (Figure 5a). Adipose tissue is the primary
source of leptin production, and at the final time point
the serum leptin concentrations per unit fat mass were
1.75 ± 0.30 ng/ml/g, 4.18 ± 0.67 ng/ml/g, and 4.39 ± 0.44
ng/ml/g fat for control mice, LG mice, and HG mice,
respectively. The higher fat-mass-specific leptin concen-
trations in high-fat-fed mice are consistent with the
development of leptin resistance in both LG mice and HG
mice [46]. At the final time point, leptin concentrations
were independently associated with a high-fat diet, body
fat, and knee osteoarthritis levels (Table 3). After control-
ling for interactions among these variables with a multi-
variate model, leptin remained significantly associated
with percentage body fat and the knee osteoarthritis
score (Table 3).
The anti-inflammatory adipokine, adiponectin, is typi-
cally reduced with adipocyte hypertrophy and increased
adiposity. Serum adiponectin concentrations were not
different between high-fat-fed mice and control-fed mice,
Griffin et al. Arthritis Research & Therapy 2010, 12:R130
/>Page 11 of 18
although there was a trend for reduced values with high-
fat feeding (Figure 5b). Adiponectin levels peaked
between approximately 20 and 35 weeks of age, and by 54
weeks of age the levels were very similar between control
mice and high-fat-fed mice (control = 14.9 ± 1.1 μg/ml;
high fat = 14.0 ± 0.52 μg/ml). Per unit fat mass, however,
serum adiponectin concentrations at the final time point
were significantly reduced with high-fat feeding: 2.79 ±
0.20 μg/ml/g fat, 1.34 ± 0.11 μg/ml/g fat, and 0.79 ± 0.04
μg/ml/g fat in the control mice, LG mice, and HG mice,
respectively. Although adiponectin concentrations were
not independently associated with diet, percentage body
fat, or knee osteoarthritis, adiponectin was negatively
associated with knee osteoarthritis scores when control-
ling for diet and body fat (Table 3).
Effect of leptin, IL-1, and fatty acids on chondrocyte matrix
homeostasis
The significant relationship between adiposity, leptin,
and osteoarthritis in high-fat-fed mice is consistent with
previous reports of the proinflammatory actions of leptin
in cartilage [16-18,47-49]. To test the potential role of
leptin in the pathogenesis of osteoarthritis, an in vitro
study was conducted using porcine cartilage explants to
determine the effects of physiologic levels of leptin on
cartilage matrix turnover and inflammation. Leptin did
not significantly affect the incorporation of [
3
H]proline or
[
35
S]sulfate (Figure 6a), indicating that leptin did not alter
collagen or S-GAG synthesis (major components of the
extracellular matrix). Furthermore, neither S-GAG
release nor NO
x
production were altered by leptin (Figure
6,c).
Figure 4 Central thermal hyperalgesia in high-fat-fed mice at 53 weeks of age. (a) Paw-withdrawal latency durations versus time for a hotplate
test of centrally-mediated thermal hyperalgesia. High-fat (HF)-fed mice showed thermal hyperalgesia for the first 60 minutes of hotplate testing. (b)
Tail-flick latency over time for a test of peripherally-mediated thermal hyperalgesia. HF-fed mice showed thermal hyperalgesia at 240 minutes of tail-
flick testing. Data shown as mean ± standard error of the mean. *P < 0.05 for comparison with time-matched control value for either the low gainer
(LG) group or the high gainer (HG) group. #P < 0.05 for time-matched HF diet versus control comparison.
(a) (b)
#
#
#
#
*
*
#
HG
LG
Control
HG
LG
Control
Figure 5 Longitudinal serum adipokine concentrations in control and high-fat-fed mice. (a) Leptin and (b) adiponectin concentrations at 9, 22,
34, and 54 weeks of age. Data shown as mean ± standard error of the mean. *P < 0.05 versus age-matched controls. HG, high gainer; LG, low gainer.
(a)
(b)
*
*
*
*
*
b)
HG
LG
Control
HG
LG
Control
Griffin et al. Arthritis Research & Therapy 2010, 12:R130
/>Page 12 of 18
Given the lack of an independent effect of leptin on
extracellular matrix synthesis, degradation, or NO
x
pro-
duction, we examined whether leptin altered extracellular
matrix synthesis or degradation when cartilage explants
were co-stimulated with IL-1α (1 ng/ml) with or without
a high concentration of fatty acids (0.5 mM 1:1 palm-
itic:oleic fatty acids). The [
3
H]proline (Figure 6d) and
[
35
S]sulfate (Figure 6e) incorporation rates were reduced
by more than 50% by IL-1α treatment compared with
unstimulated controls. Fatty acid treatment alone did not
affect incorporation rates, and the combined IL-1α plus
fatty acid treatment had no effect on [
3
H]proline incorpo-
ration rates (Figure 6d) and a slight positive effect on
[
35
S]sulfate incorporation rates compared with IL-1α
treatment alone (Figure 6e). The addition of leptin had no
affect on [
3
H]proline incorporation rates, indicating that
leptin does not synergistically mediate IL-1α-stimulated
reductions in collagen synthesis. Leptin had no affect on
IL-1α-mediated reductions in S-GAG synthesis, as indi-
cated by the [
35
S]sulfate incorporation rates (Figure 6e).
Leptin did, however, reduce [
35
S]sulfate incorporation
rates in IL-1α and fatty acid co-stimulated explants from
approximately 50% to 30% of the control rate (P < 0.05),
negating a slight protective effect of fatty acids on IL-1α-
mediated reductions in S-GAG synthesis.
Leptin also mitigated the fatty-acid-stimulated S-GAG
release from the explants (Figure 6f). Fatty acid treatment
increased S-GAG release by about 70% relative to control,
and the two highest leptin treatments (10 and 100 ng/ml)
returned the S-GAG release to control levels (Figure 6f).
Similarly, leptin mitigated S-GAG release in IL-1α and
fatty acid co-stimulated explants, from a more than 15-
fold increase in the absence of leptin down to a 12-fold
increase with the highest leptin dose. IL-1α-mediated S-
GAG release, which was increased nearly 12-fold, was
unaffected by leptin treatment.
NO
x
production was increased approximately 80-fold
with IL-1α treatment (Figure 6g) and, unlike previous
reports showing a synergistic effect of leptin on IL-1α-
mediated NO
x
production [48], we did not observe an
effect of leptin on IL-1α-mediated NO
x
production using
a physiologic range of leptin doses. IL-1α and fatty acid
co-stimulation treatments generated NO
x
levels that were
lower than IL-1α treatment alone (Figure 5g), and fatty
acid treatment by itself had no affect on NO
x
production.
Furthermore, treatment with leptin did not alter NO
x
production in explants treated with fatty acids. Leptin
mitigation of changes in fatty acid-stimulated S-GAG
release thus does not appear to involve nitric-oxide-
dependent pathways.
Discussion
Obesity is a risk factor for osteoarthritis in joints
throughout the body, especially the knee. The relative
contribution of biomechanical, behavioral, and inflam-
matory factors to the symptomatic and structural patho-
genesis of obesity-associated osteoarthritis, however, is
not well understood [50]. In the present article, we show
that a high-fat diet induces osteoarthritic changes in the
knee joint in proportion to fat gain following 45 weeks of
high-fat feeding in female C57BL/6J mice. Fat gain, which
varied considerably in response to a high-fat diet as previ-
ously reported [28], strongly correlated with cartilage
proteoglycan loss and reduced the aggregate modulus in
high-fat-fed mice. Resistance to diet-induced obesity pro-
tected mice from the normal age-associated loss of carti-
lage proteoglycan content, whereas susceptibility to diet-
induced obesity significantly increased the loss of carti-
lage proteoglycan content. Differences in body weight
alone do not explain this observation, as LG mice
weighed more than the control-diet mice yet they had
reduced proteoglycan loss. Susceptibility to diet-induced
obesity has been attributed to epigenetic changes in adi-
pose tissue gene expression, including genes involved in
the Wnt signaling pathway [28]. Furthermore, differences
in social status (for example, dominant vs. submissive)
under chronic stress conditions may also affect weight
gain in response to high-fat feeding [51]. It is not known
whether these conditions are mechanistically related to
the observed changes in knee osteoarthritis.
The findings that the fat content of the diet mediates
the relationship between body weight, adiposity, and
knee osteoarthritis in C57BL/6J mice suggest that obe-
sity-related risk factors for osteoarthritis are sensitive to
environmental factors that regulate metabolism. While
there is some evidence supporting a direct link between
the regulation of lipid metabolism and osteoarthritis [52-
54], increased adiposity may promote the development of
osteoarthritis indirectly through changes in biomechani-
cal and/or inflammatory pathways.
In the current study, musculoskeletal strength, locomo-
tor speed, and motor coordination, but not spontaneous
locomotor activity, were significantly impaired by high-
fat feeding. These effects were shown with respect to
reduced grip strength, slower self-selected speeds, and
the significant reduction in rotarod-tested motor coordi-
nation and function. A similar relationship occurs in
humans, in which quadriceps muscle weakness is a risk
factor for incident, but not progressive, knee osteoarthri-
tis in older obese women [5,55]. Quadriceps muscle
weakness increases the risk of incident knee pain [56] and
is associated with increased pain and reduced function in
individuals with knee osteoarthritis [57]. Reduced physi-
cal function and the use of slower walking speeds in
humans with osteoarthritis are generally attributed to
reduced joint stability, altered neuromuscular function,
and increased pain [58-61]. In the current study, reduced
grip strength occurred at a much earlier time point com-
pared with changes in motor coordination and gait, sug-
Griffin et al. Arthritis Research & Therapy 2010, 12:R130
/>Page 13 of 18
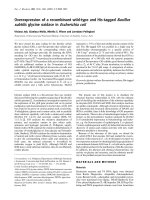
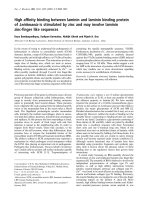
Figure 6 Effect of physiologic leptin ± IL-1α and fatty acid on healthy cartilage extracellular matrix homeostasis. Forty-eight-hour in vitro tis-
sue culture experiments were performed on macroscopically intact porcine femoral articular cartilage explants to determine the acute effect of leptin
stimulation on extracellular matrix synthesis and degradation. (a) Effect of leptin stimulation on collagen and sulfated glycosaminoglycan (S-GAG) syn-
thesis rates determined by radioisotope incorporation of [
3
H]proline and [
35
S]sulfate, respectively (N = 9 joints, n = 5 explants per joint). Data are nor-
malized to the average control value per joint. (b) S-GAG release from cartilage explants due to leptin stimulation (N = 12, n = 5). (c) Nitrite and nitrate
(NOx) production from cartilage explants due to leptin stimulation (N = 9, n = 5). Leptin-stimulated conditions were not significantly different from
control values (P > 0.05). Effect of leptin stimulation on cartilage (d) collagen synthesis, (e) S-GAG synthesis, (f) S-GAG release, and (g) NOx production
when co-treated with 0.5 mM fatty acids (FA) or 0.1 ng/ml IL-1α separately or combined (N = 3, n = 5). FA treatment was a 1:1 ratio of palmitic:oleic
acids. y axes are on a log scale. *P < 0.05 versus untreated control (dashed line). #P < 0.05 versus zero leptin condition. Data shown are mean ± standard
error of the mean.
0.2
0.3
0.4
0.5
0.6
0.7
0.8
0.9
1.0
0 1 10 100
Normalized
35
S sulfate
incorporation rate
Leptin (ng/ml)
Control
0.2
0.3
0.4
0.5
0.6
0.7
0.8
0.9
1.0
0 1 10 100
Normalized
3
H proline
incorporation rate
Leptin (ng/ml)
Control
1
10
0 1 10 100
Normalized GAG Release
Leptin (ng/ml)
Control
1
10
100
0 1 10 100
Normalized NOx Production
Leptin (ng/ml)
Control
3H
(f) (g)
(d) (e)
(a) (b) (c)
)
)
)
Leptin dose (ng/ml)
Leptin dose (ng/ml) Leptin dose (ng/ml)
*
*
*
*
*
*
*
*
*
*
*
*
*
*
*
*
*
*
*
*
*
*
*
*
#
#
*
*
*
*
*
*
*
*
Normalized
3
H proline
incorporation rate
Normalized
35
S sulfate
incorporation rate
3
H
35
S
Griffin et al. Arthritis Research & Therapy 2010, 12:R130
/>Page 14 of 18
gesting that neuromuscular deficits associated with
muscular force generation are an initiating factor in the
pathogenesis of obesity-associated osteoarthritis.
The lack of association between spontaneous locomo-
tor activity and the development of osteoarthritis in con-
trol mice, LG mice, and HG mice is notable for several
reasons. First, differences in spontaneous activity do not
correspond to differences in the degree of weight and adi-
pose tissue gain (that is, LG vs. HG). These data suggest
that differences in susceptibility to weight gain in HG
mice relative to LG mice are not explained by reduced
energy expenditure in HG mice, which is consistent with
a previous finding that differences in resting metabolic
rate are compensated by differences in food intake in
high-fat fed C57BL/6 mice [36]. Second, no association
occurred between the average horizontal distance trav-
eled and the incidence of knee osteoarthritis among con-
trol mice, LG mice, and HG mice. Similarly in humans,
the habitual recreational activity level neither increases
nor decreases the risk of developing symptomatic
osteoarthritis in normal and overweight individuals [62].
An important factor in the interpretation of the behav-
ioral results from this study is the well-recognized com-
plexity - and the lack of predictability - of the
relationships between structural changes and pain in
osteoarthritis clinically [63]. In fact, previous clinical
studies have shown that osteoarthritic disability is most
highly associated with pain, obesity, and anxiety, with lit-
tle relationship to structural changes (as measured radio-
graphically) [64]. Neurobehavioral factors associated with
osteoarthritis pain, including anxiety-like responses and
nociception, were altered with a high-fat diet and increas-
ing adiposity. In rats, acute exposure to a high-fat diet is
perceived as a stressor, comparable with significant
chronic or acute stress [65]. Stress is a common trigger
for mood disorders [66], and a recent large-scale study
has shown a clear relationship between obesity, obesity-
related co-morbidities, and the prevalence of current or
lifetime depression and anxiety, particularly in women
[67].
Although there are many unknowns about the relation-
ship between obesity and mood, such as the direction of
causality and the interaction of environmental and
genetic factors, mood disorders have a significant impact
on disease severity (for example, pain and disability) in
individuals with osteoarthritis. In women, both anxiety
and depression predict weekly changes in osteoarthritis
pain, with the effect of anxiety being twice as large as
depression [68]. In mice, we observed a similar relation-
ship between anxiety-like behavior and hyperalgesia.
Female LG and HG mice showed increased thermal sen-
sitivity for the hotplate test, but not the tail-flick test, sug-
gesting that supraspinal sites are the primary
neurological targets of modification by high-fat diets.
Indeed, two recent studies have highlighted the role of
leptin and urocortin 2 signaling in the brain as sites of
action that modulate thermal nociception [69] and anxi-
ety-like behavior [70], respectively. The current findings
indicate that a high-fat diet may be an important environ-
mental stimulus for modulating neurobehavioral factors
associated with osteoarthritis pain, such as anxiety and
hyperalgesia.
The findings of the present study also indicate that sys-
temic concentrations of various proinflammatory cytok-
ines are not significantly altered by a high-fat diet.
Indeed, leptin was the only cytokine or adipokine that
was altered by the high-fat diet. These findings are con-
sistent with previous studies of high-fat diet-induced obe-
sity in mice, which show significant inflammatory
responses within the adipose tissue but generally mild
systemic increases in serum cytokine concentrations [71].
For example, C57BL/6N mice fed a 35% fat diet for 10
weeks showed no changes in serum IL-1α, IL-1β, IL-4, IL-
10, or TNFα, but had a significant, although low (7%),
increase in IL-6 levels relative to controls [72].
Despite minimal effects of a high-fat diet on proinflam-
matory cytokine levels, statistically controlling for the
effect of diet and percentage body fat revealed that sys-
temic concentrations of leptin, adiponectin, and IL-1α are
predictive of knee osteoarthritis severity. The mecha-
nisms relating reduced IL-1α and adiponectin levels with
joint degeneration remain unclear as osteoarthritis sever-
ity and extracellular matrix degradation is associated with
increased levels of both IL-1α [73] and adiponectin [74].
For leptin, several previous studies provide support for an
indirect role of leptin in osteoarthritis pathogenesis [75].
For example, recent studies have shown that mice defi-
cient in leptin or the leptin receptor undergo extreme
weight gain but exhibit no changes in osteoarthritis [76].
Furthermore, several in vitro studies have suggested that
high levels of leptin can induce IL-1 expression or can act
synergistically with IL-1 to induce NOS2 expression
[17,48].
To directly examine whether increased levels of leptin
can induce degenerative or proinflammatory changes in
healthy cartilage, we treated cartilage explants with a
range of physiologic doses of leptin, in the presence or
absence of IL-1α and palmitic and oleic fatty acids. We
found little or no effect of leptin on matrix biosynthesis,
proteoglycan breakdown, or nitric oxide production in
vitro (Figure 6), whereas the proinflammatory effects of
leptin are apparent at superphysiologic concentrations
[48,49]. Osteoarthritis increases the expression of leptin
and leptin receptors in chondrocytes [49], suggesting that
physiologic levels of leptin may mediate the production
of inflammatory mediators in osteoarthritic but not nor-
mal tissue. There is evidence that the regulation of leptin
expression through environmental, genetic, or epigenetic
Griffin et al. Arthritis Research & Therapy 2010, 12:R130
/>Page 15 of 18
factors may be responsible for influencing the production
of proinflammatory mediators and matrix metalloprotei-
nases in cartilage [47]. Alternatively, leptin may indirectly
alter chondrocyte activity through altered bone remodel-
ing [77] or lipid metabolism [78].
The findings of the present study suggest several poten-
tial treatment targets for osteoarthritis in obese patients.
As the high-fat diet itself, independent of a gain in body
fat, was associated with several factors associated clini-
cally with osteoarthritis (that is, altered cartilage proper-
ties, grip strength, increased anxiety-like behavior, and
adiponectin level), our findings suggest that diet modifi-
cation, in and of itself, could potentially reduce some of
the known risk factors for osteoarthritis-associated dis-
ability. While there are few clinical data currently avail-
able to support this notion directly, previous studies have
shown beneficial and anti-inflammatory effects of a diet
low in arachidonic acid in patients with rheumatoid
arthritis [79,80]. Strengthening exercises for the quadri-
ceps to counter muscle weakness associated with obesity
may also have therapeutic benefits for osteoarthritis pain
[81]. In particular, recent studies have shown that knee
strengthening exercises may be particularly beneficial for
overweight and obese patients with osteoarthritis [82].
Ultimately, the greatest benefit with respect to pain and
disability for obese osteoarthritis patients may come from
a combination of knee strengthening coupled with mod-
erate exercise and weight loss [83].
The significant associations between osteoarthritis
severity and serum leptin, adiponectin, and IL-1α con-
centrations, independent of diet and adiposity, support
the role of systemic adipokines as mediators of obesity-
associated osteoarthritis. The strong association between
leptin and disease severity, coupled with the recent obser-
vation that obesity due to the impairment of leptin signal-
ing does not cause osteoarthritis in mice [76], suggests
that leptin itself may be a target for osteoarthritis in obese
patients. Given the pleiotropic effects of leptin in regulat-
ing appetite, skeletal metabolism, fertility, and many
other physiologic functions, however, targeting leptin
directly may prove overly complex as an osteoarthritis
therapy. On the other hand, increased leptin levels are
associated with increased concentrations of other proin-
flammatory cytokines such as IL-1, IL-6, IL-8, TNFα, and
prostaglandin E
2
[84], which may provide more specific
and selective approaches for pharmacologic intervention
in obesity-induced osteoarthritis.
While the use of a diet-induced obese mouse model
provides numerous advantages for studying obesity and
osteoarthritis - such as allowing for repeated testing and
controlling for environmental conditions, diet, and age -
there are limitations of its use for translational relevance.
For example, it was not possible to examine biomechani-
cal factors, such as limb alignment and net adduction
moment about the knee, or other neuromuscular mea-
surements involving proprioception and maximal knee
extensor strength tests, which are associated with knee
osteoarthritis in humans. Furthermore, the methods used
to assess hyperalgesia and pain-related behaviors are not
specific to the joints and do not include pressure-based
stimuli. In general, the use of mouse models imposes lim-
itations associated with animal size as well as challenges
for translating clinical functional and behavioral tests that
require knowledge about a particular cognitive state (for
example, motivation or emotion). Nonetheless, our find-
ings of osteoarthritis-like changes in this model provide
further support for use of the mouse to study various
molecular, biomechanical, and behavioral factors in the
pathogenesis of joint degeneration using genetically-
modified or inbred mice [85-87], diet-induced obesity
[27,88-90], or joint injury [91].
Conclusions
Our findings show that a high-fat diet induces a unique
suite of biomechanical, neurobehavioral, and inflamma-
tory changes associated with structural and symptomatic
osteoarthritis in mice. Of these changes, systemic leptin,
adiponectin, and IL-1α levels remain significantly associ-
ated with knee osteoarthritis severity when statistically
controlling for the effects of diet and adiposity. Physio-
logic levels of leptin do not alter extracellular matrix
homeostasis in healthy cartilage, suggesting that leptin
may be a secondary mediator of cartilage degeneration in
osteoarthritis. These findings provide new insights into
potential pharmacologic, psychosocial, and physical ther-
apies for the treatment or prevention of obesity-associ-
ated osteoarthritis.
Abbreviations
BSA: bovine serum albumin; FBS: fetal bovine serum; HG: high gainer; IFN: inter-
feron; IL: interleukin; LG: low gainer; NO
x
: nitrate and nitrite; S-GAG: sulfated gly-
cosaminoglycan; TNF: tumor necrosis factor.
Competing interests
The authors declare that they have no competing interests.
Authors' contributions
TMG conceived of the study, oversaw all data collection and analysis, and
drafted the manuscript. BF participated in the design, collection and analysis of
data for the tissue culture experiments. JLH participated in data collection and
analysis of cytokine and adipokine measurements. VBK contributed to the
experimental design, analysis, and interpretation of the data. RMR and WCW
contributed to the design, collection, analysis, and interpretation of the neu-
robehavioral data. LC participated in the collection and analysis of the cartilage
material property data. LAS contributed to the experimental design and analy-
sis of the cartilage material property data, and participated in the interpreta-
tion of all study results. FG contributed to the study conception, experimental
design, data analysis and interpretation, and manuscript preparation. All
authors have read and approved the final manuscript.
Acknowledgements
The present work was supported by grants from the National Institutes of
Health (AR50245, EB01630, AR48182, AR48852, AR49790, AG15768, and
Griffin et al. Arthritis Research & Therapy 2010, 12:R130
/>Page 16 of 18
AR51672) and an Arthritis Investigator Award to TMG from the Arthritis Foun-
dation. The authors thank Charlene Flahiff, Bridgette Furman, Steve Johnson,
Holly Leddy, and Andrew Schmidt for their help with data collection and analy-
sis. They also thank Daniel Schmitt, Frank Keefe, and William Kraus for many
insightful discussions.
Author Details
1
Department of Surgery, Duke University Medical Center, 375 Medical Sciences
Research Building, Durham, NC 27710, USA,
2
Department of Medicine, Duke
University Medical Center, 2100 Erwin Road, Durham, NC 27710, USA,
3
Department of Psychiatry and Behavioral Sciences, Mouse Behavioral and
Neuroendocrine Analysis Core Facility, Duke University Medical Center, 2100
Erwin Road, Durham, NC 27710, USA,
4
Departments of Neurobiology and Cell
Biology, Duke University Medical Center, 2100 Erwin Road, Durham, NC 27710,
USA,
5
Department of Biomedical Engineering, Duke University, 136 Hudson
Hall, Durham, NC 27708, USA and
6
Current address: Program in Free Radical
Biology and Aging, Oklahoma Medical Research Foundation, Biochemistry and
Molecular Biology, University of Oklahoma Health Science Center, 825 NE 13th
St, Oklahoma City, OK 73104 USA
References
1. Felson DT, Anderson JJ, Naimark A, Walker AM, Meenan RF: Obesity and
knee osteoarthritis. The Framingham Study. Ann Intern Med 1988,
109:18-24.
2. Oliveria SA, Felson DT, Cirillo PA, Reed JI, Walker AM: Body weight, body
mass index, and incident symptomatic osteoarthritis of the hand, hip,
and knee. Epidemiology 1999, 10:161-166.
3. Felson DT, Goggins J, Niu J, Zhang Y, Hunter DJ: The effect of body
weight on progression of knee osteoarthritis is dependent on
alignment. Arthritis Rheum 2004, 50:3904-3909.
4. Sharma L, Song J, Felson DT, Cahue S, Shamiyeh E, Dunlop DD: The role of
knee alignment in disease progression and functional decline in knee
osteoarthritis. JAMA 2001, 286:188-195.
5. Slemenda C, Heilman DK, Brandt KD, Katz BP, Mazzuca SA, Braunstein EM,
Byrd D: Reduced quadriceps strength relative to body weight: a risk
factor for knee osteoarthritis in women? Arthritis Rheum 1998,
41:1951-1959.
6. Carman WJ, Sowers M, Hawthorne VM, Weissfeld LA: Obesity as a risk
factor for osteoarthritis of the hand and wrist: a prospective study. Am
J Epidemiol 1994, 139:119-129.
7. Cicuttini FM, Baker JR, Spector TD: The association of obesity with
osteoarthritis of the hand and knee in women: a twin study. J
Rheumatol 1996, 23:1221-1226.
8. Abbate LM, Stevens J, Schwartz TA, Renner JB, Helmick CG, Jordan JM:
Anthropometric measures, body composition, body fat distribution,
and knee osteoarthritis in women. Obesity (Silver Spring) 2006,
14:1274-1281.
9. Dahaghin S, Bierma-Zeinstra SM, Koes BW, Hazes JM, Pols HA: Do
metabolic factors add to the effect of overweight on hand
osteoarthritis? The Rotterdam Study. Ann Rheum Dis 2007, 66:916-920.
10. Davis MA, Ettinger WH, Neuhaus JM: The role of metabolic factors and
blood pressure in the association of obesity with osteoarthritis of the
knee. J Rheumatol 1988, 15:1827-1832.
11. Davis MA, Neuhaus JM, Ettinger WH, Mueller WH: Body fat distribution
and osteoarthritis. Am J Epidemiol 1990, 132:701-707.
12. Hochberg MC, Lethbridge-Cejku M, Scott WW Jr, Reichle R, Plato CC,
Tobin JD: The association of body weight, body fatness and body fat
distribution with osteoarthritis of the knee: data from the Baltimore
Longitudinal Study of Aging. J Rheumatol 1995, 22:488-493.
13. Martin K, Lethbridge-Cejku M, Muller DC, Elahi D, Andres R, Tobin JD,
Hochberg MC: Metabolic correlates of obesity and radiographic
features of knee osteoarthritis: data from the Baltimore Longitudinal
Study of Aging. J Rheumatol 1997, 24:702-707.
14. Hart DJ, Doyle DV, Spector TD: Association between metabolic factors
and knee osteoarthritis in women: the Chingford Study. J Rheumatol
1995, 22:1118-1123.
15. Wellen KE, Hotamisligil GS: Inflammation, stress, and diabetes. J Clin
Invest 2005, 115:1111-1119.
16. Dumond H, Presle N, Terlain B, Mainard D, Loeuille D, Netter P, Pottie P:
Evidence for a key role of leptin in osteoarthritis. Arthritis Rheum 2003,
48:3118-3129.
17. Otero M, Gomez Reino JJ, Gualillo O: Synergistic induction of nitric oxide
synthase type II: in vitro effect of leptin and interferon-gamma in
human chondrocytes and ATDC5 chondrogenic cells. Arthritis Rheum
2003, 48:404-409.
18. Presle N, Pottie P, Dumond H, Guillaume C, Lapicque F, Pallu S, Mainard D,
Netter P, Terlain B: Differential distribution of adipokines between
serum and synovial fluid in patients with osteoarthritis. Contribution of
joint tissues to their articular production. Osteoarthritis Cartilage 2006,
14:690-695.
19. Bedson J, Croft PR: The discordance between clinical and radiographic
knee osteoarthritis: a systematic search and summary of the literature.
BMC Musculoskelet Disord 2008, 9:116.
20. Hannan MT, Felson DT, Pincus T: Analysis of the discordance between
radiographic changes and knee pain in osteoarthritis of the knee. J
Rheumatol 2000, 27:1513-1517.
21. Price DD: Psychological and neural mechanisms of the affective
dimension of pain. Science 2000, 288:1769-1772.
22. Apkarian AV, Bushnell MC, Treede RD, Zubieta JK: Human brain
mechanisms of pain perception and regulation in health and disease.
Eur J Pain 2005, 9:463-484.
23. Heim N, Snijder MB, Deeg DJ, Seidell JC, Visser M: Obesity in older adults
is associated with an increased prevalence and incidence of pain.
Obesity (Silver Spring) 2008, 16:2510-2517.
24. Shelby RA, Somers TJ, Keefe FJ, Pells JJ, Dixon KE, Blumenthal JA: Domain
specific self-efficacy mediates the impact of pain catastrophizing on
pain and disability in overweight and obese osteoarthritis patients. J
Pain 2008, 9:912-919.
25. Collins S, Martin TL, Surwit RS, Robidoux J: Genetic vulnerability to diet-
induced obesity in the C57BL/6J mouse: physiological and molecular
characteristics. Physiol Behav 2004, 81:243-248.
26. Silberberg M, Silberberg R: Effects of a high fat diet on the joints of
aging mice. AMA Arch Pathol 1950, 50:828-846.
27. Griffin TM, Guilak F: Why is obesity associated with osteoarthritis?
Insights from mouse models of obesity. Biorheology 2008, 45:387-398.
28. Koza RA, Nikonova L, Hogan J, Rim JS, Mendoza T, Faulk C, Skaf J, Kozak LP:
Changes in gene expression foreshadow diet-induced obesity in
genetically identical mice. PLoS Genet 2006, 2:e81.
29. Ward BD, Furman BD, Huebner JL, Kraus VB, Guilak F, Olson SA: Absence
of posttraumatic arthritis following intraarticular fracture in the MRL/
MpJ mouse. Arthritis Rheum 2008, 58:744-753.
30. Cao L, Youn I, Guilak F, Setton LA: Compressive properties of mouse
articular cartilage determined in a novel micro-indentation test
method and biphasic finite element model. J Biomech Eng 2006,
128:766-771.
31. Rodriguiz RM, Wetsel WC: Assessments of cognitive deficits in mutant
mice. In Animal Models of Cognitive Impairment Edited by: Levin E,
Buccafusco JJ. Boca Raton, FL: CRC Press; 2006:223-284.
32. Zumwalt AC, Hamrick M, Schmitt D: Force plate for measuring the
ground reaction forces in small animal locomotion. J Biomech 2006,
39:2877-2881.
33. Piscoya JL, Fermor B, Kraus VB, Stabler TV, Guilak F: The influence of
mechanical compression on the induction of osteoarthritis-related
biomarkers in articular cartilage explants. Osteoarthritis Cartilage 2005,
13:1092-1099.
34. Fermor B, Weinberg JB, Pisetsky DS, Misukonis MA, Fink C, Guilak F:
Induction of cyclooxygenase-2 by mechanical stress through a nitric
oxide-regulated pathway. Osteoarthritis Cartilage 2002, 10:792-798.
35. Benjamini Y, Hochberg Y: Controlling the false discovery rate: a practical
and powerful approach to multiple testing. J R Stat Soc Ser B (Methodol)
1995, 57:289-300.
36. Johnston SL, Souter DM, Tolkamp BJ, Gordon IJ, Illius AW, Kyriazakis I,
Speakman JR: Intake compensates for resting metabolic rate variation
in female C57BL/6J mice fed high-fat diets. Obesity (Silver Spring) 2007,
15:600-606.
37. LeRoux MA, Arokoski J, Vail TP, Guilak F, Hyttinen MM, Kiviranta I, Setton
LA: Simultaneous changes in the mechanical properties, quantitative
collagen organization, and proteoglycan concentration of articular
cartilage following canine meniscectomy. J Orthop Res 2000,
18:383-392.
Received: 18 March 2010 Revised: 19 May 2010
Accepted: 6 July 2010 Published: 6 July 2010
This article is available from: 2010 Griffin et al.; licensee BioMed Central Ltd. This is an open access article distributed under the terms of the Creative Commons Attribution License ( which permits unrestricted use, distribution, and reproduction in any medium, provided the original work is properly cited.Arthritis R esearch & Therapy 2010, 12:R130
Griffin et al. Arthritis Research & Therapy 2010, 12:R130
/>Page 17 of 18
38. Farley CT, Glasheen J, McMahon TA: Running springs: speed and animal
size. J Exp Biol 1993, 185:71-86.
39. Kiviranta I, Tammi M, Jurvelin J, Arokoski J, Saamanen AM, Helminen HJ:
Articular cartilage thickness and glycosaminoglycan distribution in the
young canine knee joint after remobilization of the immobilized limb.
J Orthop Res 1994, 12:161-167.
40. Muller FJ, Setton LA, Manicourt DH, Mow VC, Howell DS, Pita JC:
Centrifugal and biochemical comparison of proteoglycan aggregates
from articular cartilage in experimental joint disuse and joint
instability. J Orthop Res 1994, 12:498-508.
41. Roos EM, Dahlberg L: Positive effects of moderate exercise on
glycosaminoglycan content in knee cartilage: a four-month,
randomized, controlled trial in patients at risk of osteoarthritis. Arthritis
Rheum 2005, 52:3507-3514.
42. Torres R, Croll SD, Vercollone J, Reinhardt J, Griffiths J, Zabski S, Anderson
KD, Adams NC, Gowen L, Sleeman MW, Valenzuela DM, Wiegand SJ,
Yancopoulos GD, Murphy AJ: Mice genetically deficient in neuromedin
U receptor 2, but not neuromedin U receptor 1, have impaired
nociceptive responses. Pain 2007, 130:267-278.
43. Steru L, Chermat R, Thierry B, Simon P: The tail suspension test: a new
method for screening antidepressants in mice. Psychopharmacology
(Berl) 1985, 85:367-370.
44. Fernandes JC, Martel-Pelletier J, Pelletier JP: The role of cytokines in
osteoarthritis pathophysiology. Biorheology 2002, 39:237-246.
45. Feve B, Bastard JP: The role of interleukins in insulin resistance and type
2 diabetes mellitus. Nat Rev Endocrinol 2009, 5:305-311.
46. Frederich RC, Hamann A, Anderson S, Lollmann B, Lowell BB, Flier JS:
Leptin levels reflect body lipid content in mice: evidence for diet-
induced resistance to leptin action. Nat Med 1995, 1:1311-1314.
47. Iliopoulos D, Malizos KN, Tsezou A: Epigenetic regulation of leptin affects
MMP-13 expression in osteoarthritic chondrocytes: possible molecular
target for osteoarthritis therapeutic intervention. Ann Rheum Dis 2007,
66:1616-1621.
48. Otero M, Lago R, Lago F, Reino JJ, Gualillo O: Signalling pathway involved
in nitric oxide synthase type II activation in chondrocytes: synergistic
effect of leptin with interleukin-1. Arthritis Res Ther 2005, 7:R581-R591.
49. Simopoulou T, Malizos KN, Iliopoulos D, Stefanou N, Papatheodorou L,
Ioannou M, Tsezou A: Differential expression of leptin and leptin's
receptor isoform (Ob-Rb) mRNA between advanced and minimally
affected osteoarthritic cartilage; effect on cartilage metabolism.
Osteoarthritis Cartilage 2007, 15:872-883.
50. Griffin TM, Guilak F: The role of mechanical loading in the onset and
progression of osteoarthritis. Exerc Sport Sci Rev 2005, 33:195-200.
51. Bartolomucci A, Cabassi A, Govoni P, Ceresini G, Cero C, Berra D, Dadomo
H, Franceschini P, Dell'Omo G, Parmigiani S, Palanza P: Metabolic
consequences and vulnerability to diet-induced obesity in male mice
under chronic social stress. PLoS One 2009, 4:e4331.
52. Watters JW, Cheng C, Pickarski M, Wesolowski GA, Zhuo Y, Hayami T,
Wang W, Szumiloski J, Phillips RL, le Duong T: Inverse relationship
between matrix remodeling and lipid metabolism during
osteoarthritis progression in the STR/Ort mouse. Arthritis Rheum 2007,
56:2999-3009.
53. Jaeger K, Selent C, Jaehme W, Mahr S, Goebel U, Ibrahim S, Vollmar B,
Mueller-Hilke B: The genetics of osteoarthritis in STR/ort mice.
Osteoarthritis Cartilage 2008, 16:607-614.
54. Iliopoulos D, Malizos KN, Oikonomou P, Tsezou A: Integrative microRNA
and proteomic approaches identify novel osteoarthritis genes and
their collaborative metabolic and inflammatory networks. PLoS One
2008, 3:e3740.
55. Brandt KD, Heilman DK, Slemenda C, Katz BP, Mazzuca SA, Braunstein EM,
Byrd D: Quadriceps strength in women with radiographically
progressive osteoarthritis of the knee and those with stable
radiographic changes. J Rheumatol 1999, 26:2431-2437.
56. Segal NA, Torner JC, Felson D, Niu J, Sharma L, Lewis CE, Nevitt M: Effect of
thigh strength on incident radiographic and symptomatic knee
osteoarthritis in a longitudinal cohort. Arthritis Rheum 2009,
61:1210-1217.
57. Amin S, Baker K, Niu J, Clancy M, Goggins J, Guermazi A, Grigoryan M,
Hunter DJ, Felson DT: Quadriceps strength and the risk of cartilage loss
and symptom progression in knee osteoarthritis. Arthritis Rheum 2009,
60:189-198.
58. Andriacchi TP, Mundermann A, Smith RL, Alexander EJ, Dyrby CO, Koo S: A
framework for the in vivo pathomechanics of osteoarthritis at the
knee. Ann Biomed Eng 2004, 32:447-457.
59. Hurley MV, Scott DL, Rees J, Newham DJ: Sensorimotor changes and
functional performance in patients with knee osteoarthritis. Ann
Rheum Dis 1997, 56:641-648.
60. Messier SP: Osteoarthritis of the knee and associated factors of age and
obesity: effects on gait. Med Sci Sports Exerc 1994, 26:1446-1452.
61. Somers TJ, Keefe FJ, Pells JJ, Dixon KE, Waters SJ, Riordan PA, Blumenthal
JA, McKee DC, Lacaille L, Tucker JM, Schmitt D, Caldwell DS, Kraus VB, Sims
EL, Shelby RA, Rice JR: Pain catastrophizing and pain-related fear in
osteoarthritis patients: relationships to pain and disability. J Pain
Symptom Manage 2008, 37:863-872.
62. Felson DT, Niu J, Clancy M, Sack B, Aliabadi P, Zhang Y: Effect of
recreational physical activities on the development of knee
osteoarthritis in older adults of different weights: the Framingham
Study. Arthritis Rheum 2007, 57:6-12.
63. Szebenyi B, Hollander AP, Dieppe P, Quilty B, Duddy J, Clarke S, Kirwan JR:
Associations between pain, function, and radiographic features in
osteoarthritis of the knee. Arthritis Rheum 2006, 54:230-235.
64. Creamer P, Lethbridge-Cejku M, Hochberg MC: Factors associated with
functional impairment in symptomatic knee osteoarthritis.
Rheumatology (Oxford) 2000, 39:490-496.
65. Legendre A, Harris RB: Exaggerated response to mild stress in rats fed
high-fat diet. Am J Physiol Regul Integr Comp Physiol 2006,
291:R1288-R1294.
66. Nestler EJ, Barrot M, DiLeone RJ, Eisch AJ, Gold SJ, Monteggia LM:
Neurobiology of depression. Neuron 2002, 34:13-25.
67. Zhao G, Ford ES, Dhingra S, Li C, Strine TW, Mokdad AH: Depression and
anxiety among US adults: associations with body mass index. Int J Obes
(Lond) 2009, 33:257-266.
68. Smith BW, Zautra AJ: The effects of anxiety and depression on weekly
pain in women with arthritis. Pain 2008, 138:354-361.
69. Wang W, Baghdoyan HA, Lydic R: Leptin replacement restores
supraspinal cholinergic antinociception in leptin-deficient obese mice.
J Pain 2009, 10:836-843.
70. Alsio J, Roman E, Olszewski PK, Jonsson P, Fredriksson R, Levine AS,
Meyerson BJ, Hulting AL, Lindblom J, Schioth HB: Inverse association of
high-fat diet preference and anxiety-like behavior: a putative role for
urocortin 2. Genes Brain Behav 2009, 8:193-202.
71. Hotamisligil GS, Shargill NS, Spiegelman BM: Adipose expression of
tumor necrosis factor-alpha: direct role in obesity-linked insulin
resistance. Science 1993, 259:87-91.
72. Fenton JI, Nunez NP, Yakar S, Perkins SN, Hord NG, Hursting SD: Diet-
induced adiposity alters the serum profile of inflammation in C57BL/
6N mice as measured by antibody array. Diabetes Obes Metab 2009,
11:343-354.
73. Daheshia M, Yao JQ: The interleukin 1beta pathway in the pathogenesis
of osteoarthritis. J Rheumatol 2008, 35:2306-2312.
74. Lago R, Gomez R, Otero M, Lago F, Gallego R, Dieguez C, Gomez-Reino JJ,
Gualillo O: A new player in cartilage homeostasis: adiponectin induces
nitric oxide synthase type II and pro-inflammatory cytokines in
chondrocytes. Osteoarthritis Cartilage 2008, 16:1101-1109.
75. Loeser RF: Systemic and local regulation of articular cartilage
metabolism: where does leptin fit in the puzzle? Arthritis Rheum 2003,
48:3009-3012.
76. Griffin TM, Huebner JL, Kraus VB, Guilak F: Extreme obesity due to
impaired leptin signaling in mice does not cause knee osteoarthritis.
Arthritis Rheum 2009, 60:2935-2944.
77. Karsenty G: Convergence between bone and energy homeostases:
leptin regulation of bone mass. Cell Metab 2006, 4:341-348.
78. Dyck DJ: Adipokines as regulators of muscle metabolism and insulin
sensitivity. Appl Physiol Nutr Metab 2009, 34:396-402.
79. Adam O, Beringer C, Kless T, Lemmen C, Adam A, Wiseman M, Adam P,
Klimmek R, Forth W: Anti-inflammatory effects of a low arachidonic acid
diet and fish oil in patients with rheumatoid arthritis. Rheumatol Int
2003, 23:27-36.
80. Proudman SM, Cleland LG, James MJ: Dietary omega-3 fats for treatment
of inflammatory joint disease: efficacy and utility. Rheum Dis Clin North
Am 2008, 34:469-479.
81. Lim BW, Hinman RS, Wrigley TV, Sharma L, Bennell KL: Does knee
malalignment mediate the effects of quadriceps strengthening on
Griffin et al. Arthritis Research & Therapy 2010, 12:R130
/>Page 18 of 18
knee adduction moment, pain, and function in medial knee
osteoarthritis? A randomized controlled trial. Arthritis Rheum 2008,
59:943-951.
82. Jenkinson CM, Doherty M, Avery AJ, Read A, Taylor MA, Sach TH, Silcocks
P, Muir KR: Effects of dietary intervention and quadriceps
strengthening exercises on pain and function in overweight people
with knee pain: randomised controlled trial. BMJ 2009, 339:b3170.
83. Messier SP, Loeser RF, Miller GD, Morgan TM, Rejeski WJ, Sevick MA,
Ettinger WH Jr, Pahor M, Williamson JD: Exercise and dietary weight loss
in overweight and obese older adults with knee osteoarthritis: the
Arthritis, Diet, and Activity Promotion Trial. Arthritis Rheum 2004,
50:1501-1510.
84. Vuolteenaho K, Koskinen A, Kukkonen M, Nieminen R, Paivarinta U,
Moilanen T, Moilanen E: Leptin enhances synthesis of proinflammatory
mediators in human osteoarthritic cartilage - mediator role of NO in
leptin-induced PGE
2
, IL-6, and IL-8 production. Mediators Inflamm 2009,
2009:345838.
85. Hu K, Xu L, Cao L, Flahiff CM, Brussiau J, Ho K, Setton LA, Youn I, Guilak F,
Olsen BR, Li Y: Pathogenesis of osteoarthritis-like changes in the joints
of mice deficient in type IX collagen. Arthritis Rheum 2006,
54:2891-2900.
86. Helminen HJ, Saamanen AM, Salminen H, Hyttinen MM: Transgenic
mouse models for studying the role of cartilage macromolecules in
osteoarthritis. Rheumatology (Oxford) 2002, 41:848-856.
87. Mason RM, Chambers MG, Flannelly J, Gaffen JD, Dudhia J, Bayliss MT: The
STR/ort mouse and its use as a model of osteoarthritis. Osteoarthritis
Cartilage 2001, 9:85-91.
88. Sokoloff L, Mickelsen O: Dietary fat supplements, body weight and
osteoarthritis in Dba-2jn mice. J Nutr 1965, 85:117-121.
89. Silberberg M, Silberberg R, Orcutt B: Modifying effect of linoleic acid on
articular aging and osteoarthrosis in lard-fed mice. Gerontologia 1965,
11:179-187.
90. Silberberg M, Silberberg R: Age factor and high-fat diets in the evolution
of osteoarthritis in mice. J Gerontol 1957, 12:9-13.
91. Glasson SS, Askew R, Sheppard B, Carito B, Blanchet T, Ma HL, Flannery CR,
Peluso D, Kanki K, Yang Z, Majumdar MK, Morris EA: Deletion of active
ADAMTS5 prevents cartilage degradation in a murine model of
osteoarthritis. Nature 2005, 434:644-648.
doi: 10.1186/ar3068
Cite this article as: Griffin et al., Diet-induced obesity differentially regulates
behavioral, biomechanical, and molecular risk factors for osteoarthritis in
mice Arthritis Research & Therapy 2010, 12:R130