Báo cáo y học: " Detection of emphysema progression in alpha " docx
Bạn đang xem bản rút gọn của tài liệu. Xem và tải ngay bản đầy đủ của tài liệu tại đây (350.41 KB, 8 trang )
BioMed Central
Page 1 of 8
(page number not for citation purposes)
Respiratory Research
Open Access
Research
Detection of emphysema progression in alpha 1-antitrypsin
deficiency using CT densitometry; Methodological advances
David G Parr*
1
, Martin Sevenoaks
2
, ChunQin Deng
3
, Berend C Stoel
4
and
Robert A Stockley
2
Address:
1
Department of Respiratory Medicine, University Hospitals of Coventry and Warwickshire, Clifford Bridge Road, Coventry, CV2 2DX,
UK,
2
Lung Investigation Unit, University Hospital of Birmingham, Edgbaston, Birmingham, B15 2TH, UK,
3
Talecris Biotherapeutics, Research
Triangle Park, NC 27709, USA and
4
Division of Image Processing, Department of Radiology, Leiden University Medical Centre, Leiden 2300-RC,
The Netherlands
Email: David G Parr* - ; Martin Sevenoaks - ;
ChunQin Deng - ; Berend C Stoel - ; Robert A Stockley -
* Corresponding author
Abstract
Background: Computer tomography (CT) densitometry is a potential tool for detecting the
progression of emphysema but the optimum methodology is uncertain. The level of inspiration
affects reproducibility but the ability to adjust for this variable is facilitated by whole lung scanning
methods. However, emphysema is frequently localised to sub-regions of the lung and targeted
densitometric sampling may be more informative than whole lung assessment.
Methods: Emphysema progression over a 2-year interval was assessed in 71 patients (alpha 1-
antitrypsin deficiency with PiZ phenotype) with CT densitometry, using the 15
th
percentile point
(Perc15) and voxel index (VI) -950 Hounsfield Units (HU) and -910 HU (VI -950 and -910) on whole
lung, limited single slices, and apical, central and basal thirds. The relationship between whole lung
densitometric progression (ΔCT) and change in CT-derived lung volume (ΔCT
Vol
) was
characterised, and adjustment for lung volume using statistical modelling was evaluated.
Results: CT densitometric progression was statistically significant for all methods. ΔCT correlated
with ΔCT
Vol
and linear regression indicated that nearly one half of lung density loss was secondary
to apparent hyperinflation. The most accurate measure was obtained using a random coefficient
model to adjust for lung volume and the greatest progression was detected by targeted sampling
of the middle third of the lung.
Conclusion: Progressive hyperinflation may contribute significantly to loss of lung density, but
volume effects and absolute tissue loss can be identified by statistical modelling. Targeted sampling
of the middle lung region using Perc15 appears to be the most robust measure of emphysema
progression.
Published: 13 February 2008
Respiratory Research 2008, 9:21 doi:10.1186/1465-9921-9-21
Received: 24 September 2007
Accepted: 13 February 2008
This article is available from: />© 2008 Parr et al; licensee BioMed Central Ltd.
This is an Open Access article distributed under the terms of the Creative Commons Attribution License ( />),
which permits unrestricted use, distribution, and reproduction in any medium, provided the original work is properly cited.
Respiratory Research 2008, 9:21 />Page 2 of 8
(page number not for citation purposes)
Background
Emphysema is defined as 'abnormal, permanent enlarge-
ment of airspaces distal to the terminal bronchioles,
accompanied by destruction of their walls, and without
obvious fibrosis' [1]. The proteolytic tissue destruction
that is pathognomonic of emphysema should directly
cause a reduction in lung density, but additional loss
arises from lung hyperinflation that is secondary to
increased lung compliance. Lung density changes can be
measured using computed tomography (CT) scanning,
and CT lung densitometry is now widely accepted to be
the most sensitive and specific measure of emphysema in
vivo [2-7]. However, several technical issues remain unre-
solved. The level of inspiration during scan acquisition
influences lung density and, in sequential studies, varia-
bility in inspiratory level will reduce the reproducibility of
longitudinal data. Consequently, a number of methods
have been proposed that either control lung volume dur-
ing scan acquisition [8-10] or adjust density measure-
ments to correct for the influence of volume effects
[2,3,10-12]. These latter methods require an assessment
of lung volume derived from CT imaging acquired using a
whole lung volumetric scanning protocol and will negate
any density change that is secondary to hyperinflation.
Although whole lung imaging has additional advantages,
for example, comprehensive assessment of emphysema
severity and distribution, emphysema is not evenly dis-
tributed throughout the lung, but is located in character-
istic regions [13]. Disease progression may occur by the
extension of emphysema in a predictable pattern and,
therefore, targeted sampling from within a whole lung
imaging series may identify disease progression (and
response to emphysema-modifying therapy) with greater
discrimination than whole lung densitometric assess-
ment.
We hypothesised that the progression of CT densitometry
would relate to changes in lung volume, including pro-
gressive hyperinflation and, therefore, the influence of
inspiratory level could be predicted and controlled by sta-
tistical modelling. In addition, it was hypothesised that
disease progression would occur by the extension of
emphysema from basal and/or apical regions and, there-
fore, the greatest densitometric change would be detected
in the middle regions of the lung.
Methods
Subjects
Subjects with severe alpha 1-antitrypsin deficiency
(AATD) with a PiZ phenotype who had been selected
from those attending our centre for a previous study [13]
were invited to attend after an interval of 2 years for fur-
ther assessment. Ethics approval was given by the local
research ethics committee, and all subjects gave written
informed consent. The alpha 1-antitrypsin concentration
and phenotype were confirmed as described previously
[14] and, at the time of assessment, all subjects were in the
stable clinical state and none had received alpha 1-antit-
rypsin augmentation therapy. All patients gave written
informed consent. The study was approved by relevant
local ethics review committees and was conducted in
accordance with the Declaration of Helsinki and Good
Clinical Practice guidelines.
Lung function testing
Lung function testing was performed at baseline accord-
ing to the British Thoracic Society/Association of Respira-
tory Technicians and Physiologists (BTS/ARTP)
guidelines, as described previously [14,15], and results
expressed as a percentage of predicted values [16].
Computed tomography
Patients were scanned in the supine position (with shoul-
der abduction), at full inspiration, using a 'volume' proto-
col on a General Electric Lightspeed scanner in the helical
mode and without the use of intravascular contrast, as
previously described [13]. CT calibration included daily
automatic air calibration, as advised by the manufacturer
(General Electric Medical Systems, Milwaukee, WI, USA).
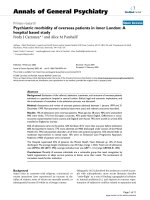
Additional quality assurance data was obtained using 3
electron density component rods from an RMI467 elec-
tron density CT phantom (Gammex – RMI Ltd, Notting-
ham, UK) (Figure 1). Two rods with density values
equivalent to lung tissue (LN300, LN450), and one rod
with equivalent density to water ('solid water'), were posi-
tioned over the mid-sternum during scan acquisition (see
'CT densitometry', below). Imaging was performed at
baseline and repeated after of an interval of approximately
2 years.
CT densitometry
Voxel index at a threshold of -950 Hounsfield Units (VI-
950HU) and -910 HU (VI-910HU) and the 15
th
percentile
point (Perc15) (Figure 2) were measured for whole lung
and additional single images selected from the whole lung
series, representing the upper (level of the aortic arch) and
lower (level of the inferior pulmonary veins) zones using
computer software (Pulmo-CMS, Medis Specials, Leiden,
the Netherlands) as described previously [13]. In addi-
tion, the lung was divided into 3 regions (apical, middle
and basal) using the sequential axial image numbers.
When possible, an equal number of image slices was allo-
cated to each region, but when the total number was not
exactly divisible by 3, the additional slices were allocated
to the basal third. Densitometric parameters were calcu-
lated on these three regions as described above.
Adjustment of all densitometric parameters was per-
formed using an internal air calibration method, as previ-
Respiratory Research 2008, 9:21 />Page 3 of 8
(page number not for citation purposes)
ously described [6], and additional quality assurance was
obtained by densitometric assessment of each electron
density rod using the Pulmo-CMS 'region of interest'
(ROI) facility. The whole lung volume that was achieved
with a full inspiratory manoeuvre during scan acquisition
(CT
Vol
) was calculated using Pulmo-CMS, as previously
described [13].
Relationship between densitometric progression and lung
volume change
Densitometric progression (ΔCT) and lung volume differ-
ence (ΔCT
Vol
) were calculated by measuring the difference
between baseline and follow-up measurements for each
parameter from a whole lung series and the annual rate of
change was estimated using time interval as the denomi-
nator.
Statistical analysis
Data were analysed using the Statistical Analysis System
(SAS) version 9.1.3, (SAS Institute, Cary, USA). Associa-
tions between ΔCT and ΔCT
Vol
were assessed by Pearson's
correlation coefficient.
CT densitometric progression was assessed using 3
approaches; (1) the differences between the baseline and
follow-up values were assessed with a paired t-test, coeffi-
cient of variation (CV%) and relative standard deviation
(RSD%); (2) adjustment of densitometric parameters for
inspiratory volume variability by linear regression of ΔCT
versus ΔCT
Vol
using an estimation of the intercept ΔCT
Vol
= 0; (3) a random coefficients model using densitometric
outcome as the dependent variable, time (years) as the
fixed effect, CT volume as longitudinal covariate, and
intercept and time (years) as random effects. The volume-
adjusted progression in densitometry was estimated from
the slope (coefficient for time variable).
Results
Baseline characteristics
Seventy-one patients agreed to participate in the follow-
up study. Fifty-five (78%) patients were index cases
(defined as individuals diagnosed with AAT deficiency
following presentation with lung disease) and 37 (52%)
were male. Thirty-eight (54%) patients had previously
smoked and 8 (11%) patients continued to smoke. The
baseline physiological characteristics expressed as the
mean ± standard deviation of percent predicted values are
as follows; FEV
1
57.1 ± 27.1, vital capacity 106.2 ± 23.1,
residual volume 126.5 ± 36.0, total lung capacity (TLC)
(helium dilution; TLC
He
) 115.3 ± 13.7, diffusing capacity
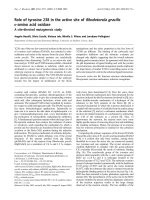
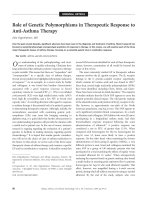
Cumulative voxel distribution histogram showing derivation of voxel index and percentile point parametersFigure 2
Cumulative voxel distribution histogram showing
derivation of voxel index and percentile point param-
eters. Voxel index (VI) below 950 Hounsfield Units (-
950HU) is defined as the proportion of lung voxels of low
density below a threshold of -950HU and increases with
worsening emphysema. The 15
th
percentile point (Perc15) is
defined as the cut-off value in HU below which 15% of all
voxels are distributed and, as a true measure of density, this
parameter consequently decreases with worsening emphy-
sema.
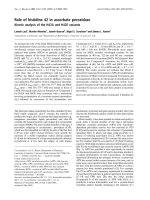
Electron density phantomFigure 1
Electron density phantom. Three electron density
rods (LN300, LN450 and 'solid water') were removed
and located over the sternum during scan acquisition
for use in internal quality assurance.
Respiratory Research 2008, 9:21 />Page 4 of 8
(page number not for citation purposes)
for carbon monoxide (TlCO) 64.0 ± 19.3 and transfer
coefficient (KCO) 65.2 ± 20.6.
CT calibration
The mean interval between scans was 2.03 ± 0.44 years.
CT calibration was maintained over the course of the
study as indicated by the calibration data in Table 1. Inter-
nal air calibration data was recorded for all scans (n = 71),
but electron density rods were utilised in 32 patients.
Relationship between TLC and inspiratory volume
measured from CT
Fifty-eight patients had TLC assessments performed using
both body plethysmography (TLC
pleth
) and TLC
He
meth-
ods, and the correlation between these measures was good
(r = 0.907, p < 0.001). The correlation between CT
Vol
and
TLC
pleth
(r = 0.938, p < 0.001) was better than the correla-
tion between CT
Vol
and TLC
He
(r = 0.889, p < 0.001).
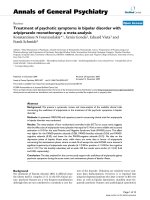
Bland-Altman plots [17] indicated that CT
Vol
systemati-
cally under-estimated in comparison to TLC
pleth
but was
similar to TLC
He
(see Figures 3A and 3B).
Relationship between densitometric progression and lung
volume change
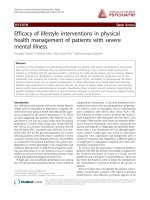
There was a close correlation between the rate of change
in lung volume measured from CT imaging (ΔCT
Vol
) and
the rate of densitometric progression assessed from whole
lung sampling, using Perc15 (r = -0.733, p < 0.001) (Fig-
ure 4), VI-950 (r = 0.600, p < 0.001) and VI-910
(r = 0.719, p < 0.001).
Progression of CT densitometry
'Raw' densitometric progression
Statistically significant densitometric progression was
identified using endpoint analysis with all densitometric
parameters (Table 2).
Adjustment for lung volume using linear regression
The regression equations for each densitometric parame-
ter, shown in Table 3, demonstrate that the measured
change in lung density was closely associated with
changes in lung volume. The intercept (ΔCT at ΔCT
Vol
= 0)
indicates the change in lung density that was not due to
change in inspiratory level during scan acquisition and
was, for each densitometric parameter, equivalent to
approximately 50% of the mean change in lung density
(Table 2). The gradient of the slope was greatest for Perc15
(12.12), and greater for VI-910 (6.58) than for VI-950
(2.54). When standardised for the change from baseline
for each densitometric parameter (Table 2) (slope/annual
change from baseline), the influence of inspiratory level
on densitometric progression was greatest for Perc15
(3.43), and greater for VI-910 (3.14) than for VI-950
(1.89). Correcting for differences in lung volume reduced
the magnitude of densitometric progression, but the
changes remained highly statistically significant for all
densitometric parameters (Table 3).
Adjustment for lung volume using a random coefficient model
Perc15 was the most sensitive measure of densitometric
progression after adjusting for lung volume variability,
and selective sampling of the middle third was the most
robust method for detecting change, based on the t value
(Table 4). The influence of lung volume accounted for
32.09% of the measured loss in lung density when
assessed using VI-950, compared with 42.21% of the pro-
gression using Perc15 and 44.5% of the progression using
VI-910.
Conclusion
The current study shows that emphysema progression can
be detected over a 2-year period by CT densitometry using
several methods for image analysis. Highly statistically
significant progression was demonstrated utilising both
percentile point and voxel index parameters. Densitomet-
ric progression was closely related to changes in lung vol-
ume and a significant proportion of the density loss
appeared to be related to apparent 'progressive hyperinfla-
tion'. The incorporation of statistical methods to adjust
for differences in inspiratory level between scans indicated
that, although increasing lung volume accounted for
some of the loss of lung density, statistically significant
changes could still be demonstrated following elimina-
tion of this component of the signal. It is logical to con-
clude that the remaining changes are likely to reflect
absolute change in lung mass and this is of fundamental
interest. There has been debate concerning whether loss of
tissue mass occurs in emphysema. The proteinase/anti-
proteinase theory predicts that loss of lung elastin is cen-
tral to the pathophysiological process [18,19]. However,
Table 1: CT calibration data
Baseline Follow-up Change from baseline
Internal air calibration (n = 68) -998.7 ± 0.9 -997.5 ± 1.9 1.2 ± 5.5
LN300 electron density rod (n = 32) -717.5 ± 2.4 -716.4 ± 3.2 1.1 ± 3.0
LN450 electron density rod (n = 32) -552.4 ± 2.6 -551.6 ± 2.8 0.8 ± 3.4
'Solid' water electron density rod (n = 32) -7.8 ± 3.5 -9.7 ± 3.6 1.9 ± 2.7
All values are presented as the mean ± standard deviation in Hounsfield Units (HU).
Respiratory Research 2008, 9:21 />Page 5 of 8
(page number not for citation purposes)
animal experiments showed that the initial loss was rap-
idly followed by elastin re-synthesis as the emphysema
developed [20]. Furthermore, fibrosis is often present in
emphysematous lung [20-22], which would increase lung
density. Our data indicate that part of the reduction in
lung density as emphysema progresses is related to a net
loss of tissue. Consequently, the inclusion of our statisti-
cal methods in future studies will enable differential
assessment of these 2 principal components of densito-
metric progression. In particular, this method of analysis
will be of importance in the characterisation of treatment
effect in therapeutic trials of potential disease-modifying
therapy.
Other approaches that have been proposed to reduce the
variability arising from inspiratory level have been
applied to individual patient data, either by controlling
inspiration during scan acquisition [9], or by adjusting
lung density to a chosen lung volume [2,3,12]. Whilst
these methods may reduce the variability of longitudinal
densitometry, thereby improving the statistical power of
interventional studies, they remain contentious. In con-
trast, the method utilised in the current study employs a
valid statistical approach that is recognised and accepted
for the comparison of grouped data in randomized, pla-
cebo-controlled trials. Furthermore, the application of
this method to group data enables differential assessment
of density change that arises from net tissue loss and pro-
gressive hyperinflation, and this may be pertinent in trials
of potential emphysema modifying therapy. Notwith-
standing this additional advantage, it is recognised that
the current method cannot be utilised to correct individ-
ual patient data and, therefore, the aforementioned alter-
native methods of volume correction are likely to remain
of potential use.
The magnitude of difference in CT
Vol
that was apparent in
our cohort is surprising, and much greater than would be
expected from the hyperinflation that is secondary to
increased compliance associated with emphysema pro-
gression. It is possible that some of the increase in CT
Vol
reflects either a patient learning effect, due to familiarisa-
tion with the required inspiratory manoeuvres on repeat
imaging, or from changes in the coaching methods
employed by the radiography staff. A component of the
measured increase in lung volume will undoubtedly
reflect emphysema-related hyperinflation and, although it
is desirable that this signal is not eliminated, it was not
possible to retain this component using the methodology
that was employed. Nevertheless, the data at baseline
indicate that CT
Vol
was closely related to physiologically-
derived TLC measurements and, therefore, it would be
possible in a long-term study during which emphysema-
related hyperinflation might be expected to be of greater
significance, that CT densitometric parameters could be
adjusted to a given lung volume derived from progressive
changes in TLC measured in the physiology laboratory.
Unfortunately, the current study did not include repeat
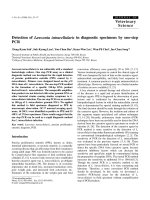
Correlation and regression of annual change in CT
Vol
with annual change in Perc15Figure 4
Correlation and regression of annual change in CT
Vol
with annual change in Perc15.
Bland-Altman plots indicating difference between (A) total lung capacity measured by helium dilution (TLC
He
) and inspiratory lung volume achieved during scan acquisition (CT
Vol
), and (B) total lung capacity measured by body plethysmography (TLC
Pleth
) and CT
Vol
Figure 3
Bland-Altman plots indicating difference between
(A) total lung capacity measured by helium dilution
(TLC
He
) and inspiratory lung volume achieved during
scan acquisition (CT
Vol
), and (B) total lung capacity
measured by body plethysmography (TLC
Pleth
) and
CT
Vol
. Continuous line represents mean difference and
dashed lines represent mean difference +/- 2 standard devia-
tions.
Respiratory Research 2008, 9:21 />Page 6 of 8
(page number not for citation purposes)
measures of TLC in all patients and further studies are
therefore needed to explore this potential method.
Contemporary scanning protocols for densitometric
assessment of emphysema commonly acquire volumetric
data and encompass the whole lung, but emphysema is
frequently localised within characteristic regions of the
lung [13], particularly in the early stages of disease. Con-
sequently, densitometric assessment of the whole lung
may be superfluous and more sensitive detection of
emphysema progression may be achieved by targeted
sampling. This is suggested from previous studies that
have identified differential rates of progression between
densitometric assessment of single slices in the upper and
lower lung regions [4]. The natural history of disease pro-
gression is likely to involve progressive extension from the
initial sites of emphysema development. In AATD, this
will most commonly occur in a basal to apical direction
but in usual chronic obstructive pulmonary disease
(COPD) in an apical to basal direction. There is no longi-
tudinal data of sufficient duration to confirm this
premise, but these patterns of emphysema extension may
explain why mortality is best predicted by upper zone
densitometric indices in subjects with AATD [23] and by
lower zone indices in subjects with usual COPD [24]. Our
group has previously shown that approximately one third
of subjects with AATD have an 'atypical' distribution of
emphysema that includes greater involvement of the api-
cal regions [13]. Consequently, we hypothesised that, in
an unselected group of subjects with AATD, targeted sam-
pling of the middle lung region would be the most sensi-
tive method for assessing disease progression, as this
would detect extension of both basal and apical emphy-
sema. The results verify this hypothesis, and suggest that
in future studies of potential emphysema-modifying ther-
apy, targeted sampling may be of greater discriminative
value in identifying a treatment effect that retards progres-
sion than whole lung assessment. Notwithstanding this
potential advantage, highly statistically significant differ-
ences in lung density were demonstrated for all sampling
methods and for all of the densitometric parameters that
were utilised. The Perc15 method was the most sensitive
parameter, and these data support previous comparative
studies [2,7] and the recommendations of a working party
[5]. However, the relationship between ΔCT and ΔCT
Vol
suggests that there is a greater influence of inspiratory
level on Perc15 than VI-950, and the use of volume con-
trol or adjustment is likely to be more critical when Perc15
is used for emphysema monitoring studies.
CT calibration has been shown to influence CT lung den-
sitometry [6,25,26] and internal calibration methods
have indicated scanner inconsistency over time, despite
the application of routine calibration practice. The current
study utilised a previously validated method of internal
calibration [6] and, in addition, explored the use of elec-
tron density rods for further quality assurance. Quality
assurance data using air densitometry acquired from
patient images indicated that there was a gradual change
in scanner performance over the course of the study
(Table 1). Densitometric data derived from ROI measure-
ments of the electron density rods indicated that the drift
in air calibration was not an isolated artefact and that the
magnitude of change was similar across a wide density
spectrum (Table 1). The likely effect of these changes
would be a small reduction in the apparent rate of emphy-
Table 3: Densitometric progression adjusted for lung volume using linear regression
Variable Linear regression models Intercept, mean ± SE (95% CI) t p value Annual change
WL Perc15 ΔPCP = -12.12*ΔCT
Vol
-3.57 -3.57 ± 0.83 (-5.48, -1.65) -3.72 0.0004 -1.79
WL VI-950 ΔVI-950 = 2.54* ΔCT
Vol
+ 1.94 1.94 ± 0.44 (1.07, 2.81) 4.45 < 0.0001 0.97
WL VI-910 ΔVI-910 = 6.58* ΔCT
Vol
+ 2.28 2.28 ± 0.57 (1.15, 3.42) 4.01 0.0002 1.14
WL, whole lung; Perc15, 15
th
percentile point (measured in Hounsfield Units); VI-950, voxel index at a threshold of -950HU (measured in %); VI-
910, voxel index at a threshold of -910HU (measured in %); Δ, change over study period; SE, standard error; 95% CI, 95% confidence interval;
annual change, change outcome measure from baseline to follow-up incorporating adjustment for lung volume, estimated from the intercept
(ΔCT
Vol
= 0).
Table 2: Densitometric progression ('raw' data)
Mean ± SD Baseline Follow-up Change from baseline t p value Annual change
WL Perc15 (HU) -939.09 ± 33.44 -946.16 ± 29.26 -7.06 ± 8.97 -6.64 < 0.0001 -3.53
WL VI-950 (%) 15.08 ± 10.63 17.75 ± 11.35 2.67 ± 3.34 6.74 < 0.0001 1.34
WL VI-910 (%) 36.29 ± 18.28 40.48 ± 18.06 4.18 ± 5.14 6.86 < 0.0001 2.09
WL, whole lung; Perc15,15
th
percentile point (measured in Hounsfield Units); SD, standard deviation; VI-950, voxel index at a threshold of -950HU
(measured in %); VI-910, voxel index at a threshold of -910HU (measured in %); annual change, change in outcome measure without adjustment for
lung volume.
Respiratory Research 2008, 9:21 />Page 7 of 8
(page number not for citation purposes)
sema progression but correction was achieved using a pre-
viously validated internal calibration method [6].
Additional internal calibration data from the electron
density rods indicated that the methodological assump-
tions of this approach were valid; in particular, the change
in air densitometric values obtained from patient images
could be used to assess and, therefore, adjust the densito-
metric value of tissue with density intermediate between
that of water and air, including the lung.
In conclusion, we have shown that CT densitometry is a
statistically robust tool for monitoring emphysema pro-
gression and that appropriate contemporary scanning
techniques are reproducible for use in longitudinal stud-
ies. Lung density change is greatly influenced by variation
in inspiratory level, but the accuracy of lung densitometry
is improved by the incorporation of statistical modelling
to adjust for the effects of lung volume. Perc15 is the most
sensitive index for monitoring progression and additional
sensitivity is achieved by densitometric assessment of the
middle region of the lung. Targeted sampling may, there-
fore, be more sensitive than whole lung assessment for the
identification of treatment effect in CT densitometric
studies of potential emphysema-modifying therapy.
Competing interests
Dr Parr's and Dr Sevenoaks' salaries were paid for by a
non-commercial grant from Bayer plc and Dr Parr acts as
a consultant for Talecris Biopharmaceuticals and Hoff-
man La Roche. Dr Stoel is consultant for Hoffman La
Roche, Talecris Biopharmaceuticals, CSL Behring and Bio-
imaging Technologies Inc. Professor Stockley has lectured
widely for non-promotional purposes to several pharma-
ceutical companies (GlaxoSmithKline, Bayer and Eli Lilly)
and acts on advisory boards with an interest in COPD
(Astra Zeneca, GlaxoSmithKline, Talecris Biopharmaceu-
ticals, Schering-Plough and Baxter Pharmaceuticals) and
as a consultant (Etiologics). In addition, significant non-
commercial research grants have been awarded by Astra
Zeneca and Bayer.
Authors' contributions
Every author has contributed to reviewing the paper. DGP
and MS performed the image analysis. DGP and CD per-
formed the statistical analysis. DGP drafted the manu-
script. BCS developed the software used for image analysis
(Pulmo-CMS). RAS is the principal investigator of the
project, obtained funding of and supervised the project.
All authors read and approved the final manuscript.
Table 4: Densitometric progression adjusted for lung volume using random coefficient model
Variable Annual change, mean ± SE (95% CI) t p value for annual rate p value for volume
Whole lung analysis
WL Perc15 -2.13 ± 0.44 (-3.01, -1.24) -4.82 < 0.0001 < 0.0001
WL VI-950 0.90 ± 0.19 (0.52, 1.29) 4.72 < 0.0001 < 0.0001
WL VI-910 1.16 ± 0.25 (0.66, 1.65) 4.67 < 0.0001 < 0.0001
Single slice analysis
UZPerc15 -2.02 ± 0.53 (-3.08, -0.97) -3.82 0.0003 < 0.0001
UZ VI-950 0.60 ± 0.21 (0.18, 1.02) 2.84 0.0057 < 0.0001
UZ VI-910 0.94 ± 0.33 (0.29, 1.59) 2.88 0.0051 < 0.0001
LZ Perc15 -1.93 ± 0.58 (-3.07, -0.78) -3.34 0.0013 < 0.0001
LZ VI-950 1.02 ± 0.32 (0.39, 1.65) 3.22 0.0019 < 0.0001
LZ VI-910 1.34 ± 0.38 (0.58, 2.1) 3.52 0.0007 < 0.0001
Targeted sampling
UT Perc15 -2.54 ± 0.62 (-3.77, -1.32) 4.13 < .0001 < 0.0001
UT VI-950 0.67 ± 0.22 (0.24, 1.10) 3.11 0.0027 < 0.0001
UT VI-910 1.28 ± 0.44 (0.42, 2.15) 2.95 0.0042 < 0.0001
MT Perc15 -2.94 ± 0.49 (-3.91, -1.97) -6.04 < 0.0001 < 0.0001
MT VI-950 1.20 ± 0.24 (0.73, 1.67) 5.08 < 0.0001 < 0.0001
MT VI-910 1.78 ± 0.35 (1.08, 2.47) 5.12 < 0.0001 < 0.0001
LT Perc15 2.85 ± 0.61 (-4.07, -1.64) -4.68 < 0.0001 < 0.0001
LT VI-950 1.28 ± 0.26 (0.76, 1.80) 4.96 < 0.0001 < 0.0001
LT VI-910 1.57 ± 0.29 (0.99, 2.15) 5.37 < 0.0001 < 0.0001
WL, whole lung; UZ, upper zone single slice; LZ, lower zone single slice; ATl, apical third; MT, middle third; LT, lower third; SE, standard error;
Perc15, 15
th
percentile point (measured in Hounsfield Units); VI-950, voxel index at a threshold of -950HU (measured in %); VI-910, voxel index at
a threshold of -910HU (measured in %). The random coefficient model consists of outcome measurement as the dependent variable, time (year) as
the fixed effect, volume as a time-dependent covariate, intercept and time (year) as random effects. The slope (coefficient for time variable) from
the model is the estimated annual change adjusted for volume.
Publish with BioMed Central and every
scientist can read your work free of charge
"BioMed Central will be the most significant development for
disseminating the results of biomedical research in our lifetime."
Sir Paul Nurse, Cancer Research UK
Your research papers will be:
available free of charge to the entire biomedical community
peer reviewed and published immediately upon acceptance
cited in PubMed and archived on PubMed Central
yours — you keep the copyright
Submit your manuscript here:
/>BioMedcentral
Respiratory Research 2008, 9:21 />Page 8 of 8
(page number not for citation purposes)
Acknowledgements
The authors would like to thank Dr Jan Stolk and Dr Berend Stoel for the
use of the Pulmo-CMS software, which was supported by European Union
funding (grant number RNDV.07773), and Dr Stuart Green for advice relat-
ing to the use of the electron density phantom for CT quality assurance.
References
1. Snider GL, Kleinerman J, Thurlbeck WM, Bengali ZH: The definition
of emphysema: report of a National Heart, Lung, and Blood
Institute, division of lung diseases workshop. Am Rev Resp Dis
1985, 132:182-185.
2. Dirksen A, Friis M, Olesen KP, Skovgaard LT, Sorensen K: Progress
of emphysema in severe alpha 1-antitrypsin deficiency as
assessed by annual CT. Acta Radiol 1997, 38:826-832.
3. Dirksen A, Dijkman JH, Madsen F, Stoel BC, Hutchison DC, Ulrik CS,
Skovgaard LT, Kok-Jensen Axel, Rudolphus A, Seersholm N,
Vrooman HA, Reiber JH, Hansen NC, Hecksher T, Viskum K, Solk J:
A randomized clinical trial of alpha 1-antitrypsin augmenta-
tion therapy. Am J Respir Crit Care Med 1999, 160:1468-1472.
4. Dowson LJ, Guest PJ, Stockley RA: Longitudinal changes in phys-
iological, radiological, and health status measurements in
alpha(1)-antitrypsin deficiency and factors associated with
decline. Am J Respir Crit Care Med 2001, 164:1805-1809.
5. Newell JD, Hogg JC, Snider GL: Report of a workshop: quantita-
tive computed tomography scanning in longitudinal studies
of emphysema. Eur Respir J 2004, 23:769-775.
6. Parr DG, Stoel BC, Stolk J, Nightingale PG, Stockley RA: Influence
of calibration on densitometric studies of emphysema pro-
gression using computed tomography. Am J Respir Crit Care Med
2004, 170:883-890.
7. Parr DG, Stoel BC, Stolk J, Stockley RA: Validation of computed
tomographic lung densitometry for monitoring emphysema
progression in alpha-1 antitrypsin deficiency. Thorax 2006,
61:485-490.
8. Gierada DS, Yusen RD, Pilgram TK, Crouch L, Slone RM, Bae KT,
Lefrak SS, Cooper JD: Repeatability of quantitative CT indexes
of emphysema in patients evaluated for lung volume reduc-
tion surgery. Radiology 2001, 220:448-454.
9. Kalender WA, Rienmuller R, Seissler W, Behr J, Welke M, Fichte H:
Measurement of pulmonary parenchymal attenuation: use
of spirometric gating with quantitative CT. Radiology 1990,
175:265-268.
10. Moroni C, Mascalchi M, Camiciottoli G, Bartolucci M, Falaschi F, Bat-
tolla L, Orlandi I, Pistolesi M, Villari N: Comparison of spiromet-
ric-gated and -ungated HRCT in COPD.
J Comput Assist Tomogr
2003, 27:375-379.
11. Bakker ME, Stolk J, Putter H, Shaker SB, Parr DG, Piitulainen E, Russi
EW, Dirksen A, Stockley RA, Reiber JH, Stoel BC: Variability in
densitometric assessment of pulmonary emphysema with
computed tomography. Invest Radiol 2005, 40:777-783.
12. Shaker SB, Dirksen A, Laursen L, Skovgaard LT, Holstein-Rathlou N-
H: Volume adjustment of lung density by computed tomog-
raphy scans in patients with emphysema. Acta Radiol 2004,
45:417-423.
13. Parr DG, Stoel BC, Stolk J, Stockley RA: Pattern of emphysema
distribution in alpha 1- antitrypsin deficiency influences lung
function impairment. Am J Respir Crit Care Med 2004,
170:1172-1178.
14. Dowson LJ, Guest PJ, Hill SL, Holder RL, Stockley RA: High-resolu-
tion computed tomography scanning in alpha1-antitrypsin
deficiency: relationship to lung function and health status.
Eur Respir J 2001, 17:1097-1104.
15. British Thoracic Society: Guidelines for the measurement of
respiratory function. Recommendations of the British Tho-
racic Society and the Association of Respiratory Technicians
and Physiologists. Respir Med 1994, 88:165-194.
16. European Respiratory Society: Standardized lung function test-
ing. Lung volumes and forced ventilatory flows. 1993 update.
European Respiratory Society 1993, 6:5-40.
17. Bland JM, Altman DG: Statistical methods for assessing agree-
ment between two methods of clinical measurement. Lancet
1986, 1:307-310.
18. Laurell CB, Eriksson S: The electrophoretic alpha 1-globulin
pattern of serum in alpha 1-antitrypsin deficiency. Scand J Clin
Lab Invest 1963, 15:132-140.
19. Shapiro SD: The pathogenesis of emphysema: the
elastase:antielastase hypothesis 30 years later. Proc Assoc Am
Physicians 1995, 107:346-352.
20. Vlahovic G, Russell ML, Mercer RR, Crapo JD: Cellular and con-
nective tissue changes in alveolar septal walls in emphysema.
Am J Respir Crit Care Med 1999, 160:2086-2092.
21. Lang MR, Fiaux GW, Gillooly M, Stewart JA, Hulmes DJ, Lamb D:
Collagen content of alveolar wall tissue in emphysematous
and non-emphysematous lungs. Thorax 1994, 49:319-326.
22. Wright JL, Churg A: Smoke-induced emphysema in guinea pigs
is associated with morphometric evidence of collagen break-
down and repair. Am J Physiol 1995, 268:L17-L20.
23. Dawkins PA, Dowson LJ, Guest PJ, Stockley RA: Predictors of mor-
tality in alpha 1-antitrypsin deficiency. Thorax 2003,
58:1020-1026.
24. Martinez FJ, Foster G, Curtis JL, Criner G, Weinmann G, Fishman A,
DeCamp MM, Benditt J, Sciurba F, Make B, Mohsenifar Z, Diaz P,
Hoffman E, Wise R, NETT Research Group: Predictors of mortal-
ity in patients with emphysema and severe airflow obstruc-
tion. Am J Respir Crit Care Med 2006, 173:1326-1334.
25. Kemerink GJ, Lamers RJ, Thelissen GR, van Engelshoven JM: Scanner
conformity in CT densitometry of the lungs. Radiology 1995,
197:749-752.
26. Stoel BC, Vrooman HA, Stolk J, Reiber JH: Sources of error in lung
densitometry with CT. Invest Radiol 1999, 34:303-309.