Báo cáo y học: "Meta-analysis of genome-wide linkage studies of asthma and related traits" potx
Bạn đang xem bản rút gọn của tài liệu. Xem và tải ngay bản đầy đủ của tài liệu tại đây (396.33 KB, 12 trang )
Respiratory Research
BioMed Central
Open Access
Research
Meta-analysis of genome-wide linkage studies of asthma and related
traits
Samuel Denham1, Gerard H Koppelman2, John Blakey1, Matthias Wjst3,
Manuel A Ferreira4, Ian P Hall1 and Ian Sayers*1
Address: 1Division of Therapeutics & Molecular Medicine, University Hospital of Nottingham, Nottingham, UK, 2Pediatric Pulmonology and
Pediatric Allergology, Beatrix Children's Hospital, University Medical Center Groningen, University of Groningen, The Netherlands, 3Institute of
Epidemiology, Ingolstädter Landstraße 1, D-85764 Neuherberg, Germany and 4Center for Human Genetic Research, Massachusetts General
Hospital, Boston, USA
Email: Samuel Denham - ; Gerard H Koppelman - ;
John Blakey - ; Matthias Wjst - ; Manuel A Ferreira - ;
Ian P Hall - ; Ian Sayers* -
* Corresponding author
Published: 28 April 2008
Respiratory Research 2008, 9:38
doi:10.1186/1465-9921-9-38
Received: 10 December 2007
Accepted: 28 April 2008
This article is available from: />© 2008 Denham et al; licensee BioMed Central Ltd.
This is an Open Access article distributed under the terms of the Creative Commons Attribution License ( />which permits unrestricted use, distribution, and reproduction in any medium, provided the original work is properly cited.
Abstract
Background: Asthma and allergy are complex multifactorial disorders, with both genetic and
environmental components determining disease expression. The use of molecular genetics holds
great promise for the identification of novel drug targets for the treatment of asthma and allergy.
Genome-wide linkage studies have identified a number of potential disease susceptibility loci but
replication remains inconsistent. The aim of the current study was to complete a meta-analysis of
data from genome-wide linkage studies of asthma and related phenotypes and provide inferences
about the consistency of results and to identify novel regions for future gene discovery.
Methods: The rank based genome-scan meta-analysis (GSMA) method was used to combine
linkage data for asthma and related traits; bronchial hyper-responsiveness (BHR), allergen positive
skin prick test (SPT) and total serum Immunoglobulin E (IgE) from nine Caucasian asthma
populations.
Results: Significant evidence for susceptibility loci was identified for quantitative traits including;
BHR (989 pedigrees, n = 4,294) 2p12-q22.1, 6p22.3-p21.1 and 11q24.1-qter, allergen SPT (1,093
pedigrees, n = 4,746) 3p22.1-q22.1, 17p12-q24.3 and total IgE (729 pedigrees, n = 3,224) 5q11.2q14.3 and 6pter-p22.3. Analysis of the asthma phenotype (1,267 pedigrees, n = 5,832) did not
identify any region showing genome-wide significance.
Conclusion: This study represents the first linkage meta-analysis to determine the relative
contribution of chromosomal regions to the risk of developing asthma and atopy. Several significant
results were obtained for quantitative traits but not for asthma confirming the increased phenotype
and genetic heterogeneity in asthma. These analyses support the contribution of regions that
contain previously identified asthma susceptibility genes and provide the first evidence for
susceptibility loci on 5q11.2-q14.3 and 11q24.1-qter.
Page 1 of 12
(page number not for citation purposes)
Respiratory Research 2008, 9:38
Background
Asthma is a disease characterised by recurrent respiratory
symptoms, reversible variable airway obstruction, airway
inflammation and increased bronchial hyper-responsiveness [1]. Estimates suggest that 100–150 million people
worldwide have asthma. Atopy is a predisposition
towards the development of immediate hypersensitivity
against common environmental antigens. Atopy and
asthma are closely related, however they are not interchangeable. Most asthmatic individuals are atopic but
atopic individuals may not have asthmatic symptoms.
Asthma and atopic disease show strong familial aggregation and heritability estimates vary between 36–79% [2].
A greater understanding of the genetic basis of asthma and
atopy holds great promise for the identification of novel
therapeutic targets.
Linkage analysis using short tandem repeats or microsatellites to follow the transfer of genetic information
between generations has been used to identify chromosomal regions that potentially contain asthma and atopy
susceptibility genes. Commonly sub-phenotypes of clinical relevance are used including; elevated total Immunoglobulin E (IgE) levels, atopy defined by positive skin
prick test to one or more allergen or elevated specific IgE
and bronchial hyper-responsiveness (BHR) [3]. These
studies have identified linkage on multiple chromosomal
regions e.g. 2q22-33, 5q31.1-33, 6p21.3, 11q13, 12q14.324.1, 13q14, 14q11.2-13 and 19q13; however replication
of linkage findings has been limited [3]. Low statistical
power and the potential for type I and type II errors may
explain these findings. Combining data has the potential
to provide inferences about the consistency of results
across studies and to identify regions that contain asthma
and atopy susceptibility genes.
The aim of the current study was to complete the first
meta-analysis of available genome wide linkage data for
asthma and related traits (asthma per se, BHR, total IgE,
allergen skin prick test response (SPT)) in the Caucasian
population using the Genome Scan Meta Analysis
(GSMA) method [4]. GSMA is a non parametric, rank
based approach and has been used extensively in other
disorders e.g. schizophrenia [5].
Methods
Systematic Literature Search
To identify published studies for inclusion in the GSMA of
asthma and related phenotypes we completed a systematic literature review in September 2006. We used
PubMed and the following search string (Asthma OR BHR
OR bronchial hyper responsiveness OR bronchial hyperreactivity OR AHR OR airway hyper responsiveness OR respiratory
hypersensitivity OR histamine OR slope OR methacholine OR
atopy OR atopic OR dermatitis, atopic OR IgE OR immu-
/>
noglobulin E OR SPT OR skin prick tests OR skin tests) AND
linkage AND genome-scan OR scan OR genome OR genomewide OR genome-wide OR LOD OR microsatellite). Limits
were set on the search including; published in English,
human studies, published 1996–2006 and the exclusion
of reviews. This initial search identified 516 matches of
which 488 were discarded as not containing genome-wide
linkage data. A further eight studies were discarded as they
were in non-Caucasian populations and we wished to
avoid any population stratification issues leaving 20
potential Caucasian studies for inclusion. Genome-wide
linkage analyses for asthma related traits in the Hutterite
Founder population [6] was not included in the current
analyses as limited data was available and the focus of the
present study was Caucasian out-bred populations.
Of the 20 manuscripts identified a further nine were
removed from the analyses for a combination of the following reasons; the study was superseded by another
including the families from the original, LOD score plots
in the manuscript were not labelled and/or unreadable,
no genome-wide data was presented e.g. in the manuscript describing the positional cloning of ADAM33, linkage analyses in 460 families for asthma, IgE and BHR
phenotypes were performed but has never been published
in full [7] or the phenotypes studied did not meet our criteria. All authors were contacted and invited to provide
complete datasets.
Phenotype definition and study inclusion/exclusion
There was a large degree of heterogeneity in phenotype
definitions and so these were standardised for inclusion.
Asthma was defined using doctor diagnosis and/or currently taking asthma medication, however we did include
data from the Dutch population which used an algorithm
based on asthma symptoms, the presence of BHR, reversibility to β2-adrenergic receptor agonist and smoking history to define asthma [8]. Analyses were completed with
and without the Dutch families. Total IgE levels were analysed in the genome scans using quantitative data generated by Pharmacia CAP system [9], Pharmacia IgE EIA
[10], Phadebas PRIST [11] and ELISA techniques [12,13]
which have shown good inter assay correlation [14,15],
therefore all studies were included. Positive skin prick
response to one or more allergen was used as a marker of
atopy and for inclusion in the GSMA. However, allergens
used in each study varied; Dermatphagoides pteronyssinus, mixed grass pollen [9], Dermatphagoides pteronyssinus, Cladosporium herbarum, Alternaria tenuis, timothy
grass, olive, birch, Parieteria judaica, ragweed, Aspergillus,
Blatella Germancia [11], mixed grass and tree pollens,
mixed weeds, Dermatphagoides pteronyssinus, dog, cat, a
mixture of guinea pig and rabbit, horse, Aspergillus fumigatus, Alternaria alternate [10], house dust mite [12], Dermatphagoides pteronyssinus and 10 others [13] and
Page 2 of 12
(page number not for citation purposes)
Respiratory Research 2008, 9:38
Dermatphagoides pteronyssinus, D. farinae, dog, cat,
grass mix, pollen and alternaria [16]. BHR was measured
in multiple ways using different provocation stimuli e.g.
histamine or methacholine providing categorical and/or
quantitative analyses. These provocation stimuli have
shown a significant correlation (r = 0.95) in the responses
induced [17], however it is worth noting that this has not
been reproduced in all studies. Studies with BHR data
were included in the GSMA irrespective of the criteria used
in the original manuscript.
Genome Scan Meta Analysis (GSMA)
GSMA was used as it is able to combine linkage data from
studies with different marker sets and analysed by different methods including permutated p-values. GSMA was
implemented using GSMA software [4,5,18]. Briefly, the
genome was divided into 120 bins of approximately 30
cM, for each study the maximum evidence for linkage e.g.
LOD score or p-value was identified for each bin and these
bins were then ranked relative to their evidence for linkage
in that study. These ranks were summed across studies
and the summed rank (SR) forms the basis of the test statistic [4]. An ordered rank (OR) statistic was also generated which gives a genome wide interpretation of
significance by comparing the n-th highest summed rank
with the distribution of the n-th highest summed ranks
obtained through simulation [5]. We completed an
unweighted and weighted analyses using information
content (√(no. pedigrees × no. markers)) as a weighting
factor.
Statistical Significance
Simulation studies have shown that any bin with a p(SR)
< 0.05 and a p(OR) < 0.05 has a high probability of containing a true susceptibility gene [5]. Applying Bonferroni
correction a p < 0.000417 provides evidence for genome
wide significance for linkage and a p < 0.0083 provides
suggestive evidence for linkage [5].
Results
Data included
The selection criteria and data requests provided eleven
studies of nine Caucasian asthma populations for our
analyses (Table 1) including data from 1,267 pedigrees (n
= 5,832) for asthma (80.2% of pedigrees available in the
public domain or following request, missing 249 [19] and
65 pedigrees [20]), 989 pedigrees (n = 4,294) for BHR
(79.9% of available, missing 249 pedigrees [19]), 1,093
pedigrees (n = 4,746) for SPT (81.5% of available, missing
249 pedigrees [19]) and 729 pedigrees (n = 3,224) for
total IgE (65.9% of available, missing 249 [19], and 129
pedigrees [21]).
/>
Asthma
The weighted asthma analyses did not identify any chromosomal region with a p(SR) and p(OR) < 0.05 (Figure 1
and Table 2). No bin p(SR) met genome wide significance
(p < 0.000417) or suggestive evidence for linkage (p <
0.0083) in these analyses however three regions demonstrated a p(SR) < 0.05; 6p22.3-p21.1, 10p14-q11.21 and
12q24.31-qter (Table 2). Eight regions met suggestive
linkage criteria in the ordered rank analyses; 1p31.1p13.3, 2p12-q22.1, 4p14-q13.3, 7q34-qter, 12pter-p12,1,
12p12.1-p11.21, 14q32.12-qter, 17pter-p12 and 20pterp12.3 (Table 2). Analyses of the asthma phenotype using
unweighted GSMA generated similar findings to the
weighted analyses (Figure 2). To confirm that the inclusion of the Dutch linkage data for the asthma phenotype
(defined by algorithm) had not confounded the analyses
we completed GSMA without these data focusing on doctor diagnosed asthma only (1,067 pedigrees). Again, no
chromosomal region with a p(SR) and p(OR) < 0.05 was
identified (data not shown).
Bronchial Hyper-responsiveness
The weighted BHR analyses strongly suggested that
6p22.3-p21.1 contains BHR susceptibility gene(s) as a
p(SR) and p(OR) < 0.05 was observed (p = 0.007, p =
0.049 respectively (Figure 1 and Table 3)). Two other
regions showed suggestive evidence (p < 0.0083) for linkage to the BHR phenotype; 2p12-q22.1 (p(SR) = 0.006)
and 11q24.1-qter (p(SR) = 0.005). In the unweighted
analyses three regions showed evidence for linkage (p(SR)
and p(OR) ≤ 0.05), i.e. 2q22.1-q23.3, 7q12.11-q31.1 and
5q23.2-q34 (Figure 2).
Positive allergen skin prick test
Weighted analyses of the SPT phenotype identified two
regions that had a p(SR) and p(OR) ≤ 0.05 strongly suggesting these regions are susceptibility loci (Figure 1 and
Table 4). These regions are 17p12-q24.3 (two adjacent
bins, 17p12-q21.33 p(SR) = 0.00043, p(OR) = 0.050 and
17q21.33-q24.3 p(SR) = 0.047, p(OR) = 0.038) and
region 3p22.1-q22.1 (three adjacent bins, 3p22.1-p14.1
p(SR) = 0.045, p(OR) = 0.063, 3p14.1-q12.3 p(SR) =
0.003, p(OR) = 0.0045 and 3q12.3-q22.1 p(SR) =
0.00084, p(OR) = 0.00406). The analyses of the
unweighted SPT datasets identified chromosomes 3 and
17 as containing the major determinants (Figure 2).
Total Immunoglobulin E
Weighted analyses of the IgE phenotype strongly suggested 5q11.2-q14.3 (p(SR) = 0.031, p(OR) = 0.060) and
6pter-p22.3 (p(SR) = 0.033, p(OR) = 0.026) contain
genes that influence IgE levels (Figure 1 and Table 5). The
region adjacent to 6pter-p22.3, i.e. 6p22.3-p21.1 has a
p(SR) = 0.00999 approaching suggestive linkage providing further evidence for this region. Analyses of the IgE
Page 3 of 12
(page number not for citation purposes)
Page 4 of 12
NUMBER OF.(b)
COHORT (REF.)
PHENOTYPES(a)
PED. (AFF/IND.)
MKS.
WF.
MKR MAP (SP.)(c)
STUDY TYPE(d)
ANALYSIS PROGRAM
INCLUDED IN GSMA
Australian [9]
B: Slope (-,0–12 μmol meth.)
80 (25/364)
253
142.267
- (10 cM)
Nonpar.two.
-
B: 23 p-values < 0.05
I: Quantitative
I: 21 p-values < 0.05
S: 2 allergens
S: 19 p-values < 0.05
CSGA [33]
A: Quest./Doc diag
79 (200/316)
360
168.642
Marshfield (10 cM)
Nonpar. multi.
Modified GENEHUNTER
A: LOD scores from graphs
German [34]
B: PD20 (Neb, < 8 mg/ml meth.)
97 (200/415)
333
179.725
Modified Genethon (10.7 cM)
Nonpar. multi.
GENEHUNTER, MAP-MAKER/SIBS
B: Complete dataset
A: Quest./Meds.
46 (102/210)
254
108.093
– (13 cM)
Nonpar. multi.
GENEHUNTER, SIBPAIR
A: 11 p-values
French [11]
B: Slope (-, meth.)
B: 8 p-values
I: Quantitative
I: 8 p-values
S: 11 allergens
S: 19 p-values
Icelandic [35]
A: Doc diag./Meds.
175 (596/1134)
976*
413.280
Decode (4 cM)
Nonpar. multi.
ALLEGRO
A: LOD scores from graphs
Dutch [10, 36, 37]
A: Algorithm
200 (-/1159)
366
270.555
Marshfield Weber v8 (10 cM)
Nonpar.
SOLAR, GENEHUNTER
A: Complete dataset
B: PD20 (-, < 32 mg/ml hist.)
B: Complete dataset
I: Quantitative
I: Complete dataset
S: 16 allergens
German [12]
A: Doc diag.
S: Complete dataset
201 (506/867)
364
270.489
Modified Genethon (10 cM)
Nonpar. multi.
MERLIN
A: Complete dataset
I: Quantitative/Catagorical
Australian [13]
I: Complete quantitative dataset
S: HDM+
S: Complete dataset
A: Quest./Meds.
202 (169/591)
624
355.032
- (7.1 cM)
Nonpar. multi.
MERLIN, SOLAR
A: Complete dataset
I: Complete dataset
S: 11 allergens.
GAIN [16]
B: Complete dataset
I: Quantitative
Respiratory Research 2008, 9:38
B: PD20 (-, < 7.8 μmol hist)
S: Complete dataset
A: Doc diag.
364 (1014/1555)
396*
379.663
Decode (-)
Nonpar. multi.
MERLIN
A: LOD scores from graphs
B: PD20 (-, < 8 mg/ml meth.)
B: LOD scores from graphs
S: 7 allergens
S: LOD scores from graphs
(a) A = asthma; B = bronchial hyper-responsiveness (Neb = nebuliser, Dos = dosimeter); I = total serum IgE; S = skin prick test response; Quest = questionnaire; Doc diag = doctor diagnosis; Meds =
asthma medication; Meth = methacholine; Hist = histamine; HDM = house dust mite; PD20 = provocation dose resulting in a 20% fall in FEV1. (b) Ped = total genotyped pedigrees; AFF = total genotyped
asthmatic cases, Ind = total genotyped individuals; Mks = total autosomal microsatellite markers; Wt = weighting factor. (c) Sp = average marker spacing. (d) Nonpar = nonparametric; Two = two point;
Multi = multipoint. (-) = not provided, *number of autosomal markers not given, total number used for weighting.
(page number not for citation purposes)
/>
Table 1: Characteristics of genome-wide linkage studies included in the GSMA
Respiratory Research 2008, 9:38
A.
/>
Asthma
B.
&KURPRVRPH
2
3
4
5
6
7
8
9
10
11
12
&KURPRVRPH
13 14 15 16 17 18 19 20
1
/RJ 7UDQVIRUPHG S YDOXH
/RJ 7UDQVIRUPHG S YDOXH
1
S
S
S
S
S
BHR
2
3
4
5
6
7
4
5
6
7
8
9
12
13 14 15 16 17 18 19 20
11
12
13 14 15 16 17 18 19 20
S
S
S
D.
10
SPT
&KURPRVRPH
11
12
13 14 15 16 17 18 19 20
1
/RJ 7UDQVIRUPHG S YDOXH
/RJ 7UDQVIRUPHG S YDOXH
3
11
S
Total IgE
2
10
%LQ
&KURPRVRPH
1
9
S
%LQ
C.
8
S
S
S
S
S
2
4
5
6
7
8
9
10
S
S
S
S
S
%LQ
%LQ
7UDQVIRUPHG :HLJKWHG S 65
3
7UDQVIRUPHG :HLJKWHG S 25
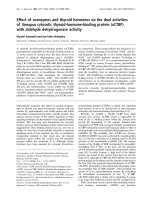
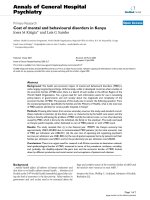
Figure p(OR) in weighted GSMA
p(SR) & 1
p(SR) & p(OR) in weighted GSMA. A. asthma. B. bronchial hyper-responsiveness. C. total serum IgE. D. skin prick test
response. A p(SR) of p < 0.000417 = significant linkage, p < 0.0083 = suggestive linkage. p(SR) & p(OR) data were transformed
using f(x) = 0.05/x and plotted on a log10 scale to improve clarity.
phenotype using the unweighted GSMA showed similar
overall findings (Figure 2).
Multiple phenotype analyses
In addition to the primary phenotype analyses we investigated overlapping chromosomal regions containing
genetic determinants of asthma and asthma related traits
consistent with gene(s) having pleiotrophic effects in
asthma and allergy (Table 6). Interestingly, region 6p22.3p21.1 which contains the HLA region showed a p(SR) <
0.05 in the asthma, BHR and IgE analyses potentially as
expected due to the role of HLA restriction in many immunological mechanisms. Several other regions also showed
overlapping concordance, in particular regions; 3p14.1q12.3 (asthma, SPT), 5q23.2-q34 (asthma, BHR, IgE) and
7p21.1-14.1 (asthma, BHR, IgE).
Discussion
This study represents the first meta-analysis of asthma and
related trait linkage data using the majority of the data
available for the Caucasian asthma cohorts in the public
domain. This analysis combines data from 10 years of
asthma and atopy genetics and is extremely timely providing a definitive analysis of available linkage data to complement the highly anticipated whole genome association
findings. Analysis of asthma and atopy quantitative traits
identified significant evidence for relatively few chromosomal regions as containing susceptibility gene(s) using
the most stringent genome-wide criteria i.e. BHR (6p22.3p21.1), total IgE (5q11.2-q14.3 and 6pter-p22.3) and
positive allergen skin prick test (3p22.1-q22.1, 17p12q24.3). Significantly no chromosomal region met stringent genome-wide criteria in the asthma phenotype anal-
Page 5 of 12
(page number not for citation purposes)
Respiratory Research 2008, 9:38
/>
Table 2: Weighted GSMA for Asthma (1,267 pedigrees, n = 5,832)
PROBABILITY
BIN(a)
GENETIC LOCUS(b)
DISTANCE (cM)(c)
PHYSICAL POSITION (KB)(d)
SUMMED RANK (SR)
p(SR)
p(OR)
1
5
8
15
18
20
24
31
34
43
44
50
53
54
55
59
60
62
68
75
79
80
84
87
89
92
101
105
113
114
1pter-p36.23
1p31.1-p13.3
1q31.1-q32
2p12-q22.1
2q31.1-q34
2q35-qter
3p14.1-q12.3
4p14-q13.3
4q28.3-q32.1
6pter-p22.3
6p22.3-p21.1
7p21.1-p14.1
7q31.1-q34
7q34-qter
8pter-p22
8q22-q24.21
8q24.21-qter
9p22.3-p21.1
10p14-q11.21
11p12-q13.3
12pter-p12.1
12p12.1-p11.21
12q24.31-qter
13q22.2-q33.1
14pter-q13.1
14q32.12-qter
17pter-p12
18pter-p11
20pter-p12.3
20p12.3-p11
0.00–20.61
113.69–142.24
201.58–231.11
101.56–128.41
177.53–206.74
233.62–269.07
88.60–117.76
51.60–78.97
134.74–159.30
0.00–32.62
32.62–65.14
29.28–59.93
122.48–148.11
148.11–181.97
0.00–27.40
110.2–137.92
137.92–167.90
27.32–53.60
29.15–62.23
47.06–72.82
0.00–24.45
24.45–53.28
139.61–170.60
58.54–85.41
0.00–40.11
105.00-138.18
0.00–25.14
0.00–24.08
0.00–21.15
21.15–47.52
pter-9332
82867–110103
185232–210150
79617–119705
172805–212021
230618-qter
64182–103187
38279–72275
137492–160828
pter-16854
16854–43207
19430–40230
75216–138638
138638-qter
pter-13111
99237–127416
127416-qter
14264–29850
10591–36230
36450–70234
pter-11686
11686–32879
120806-qter
74875–102346
pter- 33529
90647-qter
pter-11325
pter- 7462
pter-7608
7608–21259
376.576
346.834
347.872
341.174
317.985
316.169
612.921
343.939
346.992
383.747
592.740
317.779
381.650
313.741
376.368
365.804
373.141
349.926
635.659
353.473
299.278
292.228
607.388
354.469
362.366
305.539
312.768
377.842
339.111
282.935
0.68121
0.78259
0.77937
0.79974
0.86170
0.86603
0.02348
0.79152
0.78212
0.65433
0.03905
0.86218
0.66230
0.87152
0.68196
0.71999
0.69378
0.77291
0.01229
0.76155
0.90180
0.91466
0.02714
0.75831
0.73182
0.88932
0.87374
0.67650
0.80587
0.92982
0.03775
0.00718*
0.02791
0.00694*
0.03548
0.00908
0.80059
0.00714*
0.01609
0.03220
0.72593
0.01583
0.03107
0.00536*
0.01899
0.02820
0.02636
0.03321
0.79026
0.02578
0.00570*
0.00766*
0.65821
0.04007
0.03622
0.00423*
0.00213*
0.04965
0.00524*
0.01324
Chromosomal regions with a p(SR) or p(OR) < 0.05 are shown. aBin number from GSMA (1–120 inclusive). bCytogenetic band (Taken from April
2002 Genome Browser, UCSC). cGenetic distance in Marshfield cM (not cumulative). dPhysical position in kilobase pairs (Taken from December
2006 UniSTS, NCBI/Genome Browser, UCSC). *p < 0.000417 = Genome wide significance for linkage, p < 0.0083 = Suggestive for linkage [5].
Table 4: Weighted GSMA for skin prick test response (1,093 pedigrees, n = 4,746)
PROBABILITY
BIN(a)
GENETIC LOCUS(b)
DIST. (cM)(c)
PHYS POS. (KB)(d)
SUMMED RANK (SR)
p(SR)
p(OR)
6
23
24
25
45
46
77
102
103
108
118
1p13.3-q23.3
3p22.1-p14.1
3p14.1-q12.3
3q12.3-q22.1
6p21.1-q15
6q15-q23.2
11q22.3-q24.1
17p12-q21.33
17q21.33-q24.3
18q22.1-qter
21q21.3-qter
142.24–170.84
63.12–88.60
88.60–117.76
117.76–146.60
65.14–99.01
99.01–131.07
98.98–123.00
25.14–63.62
63.62–93.98
96.48–126.00
25.26–57.77
110103–159125
38845–64182
64182–103187
103187–134474
43207–90985
90985–132584
103732–122977
11325–39726
39726–66600
60025-qter
27903-qter
541.271
513.869
591.392
614.373
521.717
525.276
515.746
624.777
511.187
209.839
528.536
0.02081
0.04488
0.00298*
0.00084*
0.03654
0.03318
0.04276
0.00043*
0.04799
0.96132
0.03029
0.22906
0.06344
0.00450
0.00406
0.12598
0.18839
0.11460
0.05044
0.03824
0.03480
0.28738
Chromosomal regions with a p(SR) or p(OR) < 0.05 are shown. aBin number from GSMA (1–120 inclusive). bCytogenetic band (Taken from April
2002 Genome Browser, UCSC). cGenetic distance in Marshfield cM (not cumulative). dPhysical position in kilobase pairs (Taken from December
2006 UniSTS, NCBI/Genome Browser, UCSC). *p < 0.000417 = Genome wide significance for linkage, p < 0.0083 = Suggestive for linkage [5].
Page 6 of 12
(page number not for citation purposes)
Respiratory Research 2008, 9:38
A.
/>
Asthma
B.
&KURPRVRPH
2
3
4
5
6
7
8
9
10
11
12
&KURPRVRPH
13 14 15 16 17 18 19 20
1
/RJ 7UDQVIRUPHG S YDOXH
/RJ 7UDQVIRUPHG S YDOXH
1
S
S
S
S
S
BHR
2
3
4
5
6
7
4
5
6
7
8
9
12
13 14 15 16 17 18 19 20
11
12
13 14 15 16 17 18 19 20
S
S
S
D.
10
SPT
&KURPRVRPH
11
12
13 14 15 16 17 18 19 20
1
/RJ 7UDQVIRUPHG S YDOXH
/RJ 7UDQVIRUPHG S YDOXH
3
11
S
Total IgE
2
10
%LQ
&KURPRVRPH
1
9
S
%LQ
C.
8
S
S
S
S
S
%LQ
7UDQVIRUPHG 8QZHLJKWHG S 65
2
3
4
5
6
7
8
9
10
S
S
S
S
S
%LQ
7UDQVIRUPHG 8QZHLJKWHG S 25
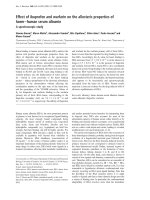
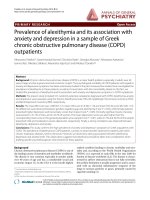
Figure p(OR) in unweighted GSMA
p(SR) & 2
p(SR) & p(OR) in unweighted GSMA. A. asthma. B. bronchial hyper-responsiveness. C. total serum IgE. D. skin prick test
response. A p(SR) of p < 0.000417 = significant linkage, p < 0.0083 = suggestive linkage. p(SR) & p(OR) data were transformed
using f(x) = 0.05/x and plotted on a log10 scale to improve clarity.
yses. This study did provide supporting evidence for
regions containing previously identified asthma susceptibility genes.
Linkage analyses has proven to be highly successful in single gene disorders e.g. cystic fibrosis but has been problematic in asthma and atopy mainly due to the complex
genetic basis of these phenotypes and the use of inadequate samples sizes leading to both type I and type II
errors. In the current study we aimed to combine all available linkage data for asthma and related trait phenotypes
(BHR, total IgE, positive allergen skin prick test) and provide inferences about the consistency of results across
studies, ultimately providing a focus for future gene discovery. The analyses of the quantitative traits provided the
most significant findings and may be consistent with the
observation that using objective markers of disease adds
to the homogeneity of the data and may improve results.
In addition the number of genes regulating these phenotypes may be smaller than "asthma" and power to find
these may be increased.
This study strongly suggested that regions 17p12-q21.33
and 3p14.1q22.1 contain gene(s) that influence allergen
skin prick responses and by inference atopy. Both of these
regions are large spanning 28.5 and 70.3 Mbp respectively. The 3p21 region has been identified as containing
genetic determinants of specific allergen responses in the
Hutterite founder asthma cohort [22] and has been identified as an atopic dermatitis locus (3p24-22) [23]. Linkage to chromosome 17 and specific allergen responses has
been described in the Hutterite population however these
Page 7 of 12
(page number not for citation purposes)
Respiratory Research 2008, 9:38
/>
Table 3: Weighted GSMA for bronchial hyper-responsiveness (989 pedigrees, n = 4,294)
PROBABILITY
BIN(a)
GENETIC LOCUS(b)
DISTANCE (cM)(c)
PHYSICAL POSITION (KB)(d)
SUMMED RANK (SR)
14
15
16
41
44
50
51
52
58
76
78
86
111
115
116
2p16.2-p12
2p12-q22.1
2q22.1-q23.3
5q23.2-q34
6p22.3-p21.1
7p21.1-p14.1
7p14.1-q21.11
7q21.11-q31.1
8q13.1-q22
11q13.3-q22.3
11q24.1-qter
13q13.2-q22.2
19q12-q13.33
20p11-q13.13
20q13.13-qter
76.34–101.56
101.56–128.41
128.41–154.48
131.48–164.19
32.62–65.14
29.28–59.93
59.93–91.67
91.67–122.48
82.84–110.20
72.82–98.98
123.00–147.77
26.87–58.54
52.59–75.41
47.52–72.27
72.27–101.22
54063–79617
79617–119705
119705–151529
123774–162087
16854–43207
19430–40230
40230–81002
81002–109766
67744–99237
70185–103732
122977-qter
33636–74875
35843–54589
21259–46747
46747-qter
532.855
576.585
518.593
551.701
571.381
523.367
518.746
461.380
468.188
465.589
579.520
472.999
460.759
476.308
467.593
p(SR)
p(OR)
0.02751
0.22094
0.00574* 0.14743
0.04085
0.08859
0.01511
0.09586
0.00716* 0.04861
0.03597
0.24658
0.04070
0.19114
0.13926
0.02065
0.12312
0.04443
0.12913
0.01652
0.00505* 0.46485
0.11255
0.03312
0.14078
0.01070
0.10563
0.03503
0.12448
0.02343
Chromosomal regions with a p(SR) or p(OR) < 0.05 are shown. aBin number from GSMA (1–120 inclusive). bCytogenetic band (Taken from April
2002 Genome Browser, UCSC). cGenetic distance in Marshfield cM (not cumulative). dPhysical position in kilobase pairs (Taken from December
2006 UniSTS, NCBI/Genome Browser, UCSC). *p < 0.000417 = Genome wide significance for linkage, p < 0.0083 = Suggestive for linkage [5].
linkages map to 17q25 in asthma [22]. Linkage to atopic
dermatitis on 17q23.1 has been reported [23]. Also of significance is the fact that the chromosome 17 locus
(17p12-q21.33) identified in the current analyses contains the recently identified ORMDL3 gene [24]. Using
whole genome association variants in the ORMDL3 gene
were shown to be associated with childhood onset asthma
[24]. Overall our data suggest that the major genes influencing allergen skin prick responses are found on chromosomes 3 and 17.
In the total IgE analyses there was strong evidence for the
presence of genes(s) regulating IgE production in the
5q11.2-q14.3 and 6pter-p21.1 regions. This region on
chromosome 6 contains the Human Leukocyte Antigen
(HLA) locus and so may be predicted to contain determinants of immunological processes. The finding that
5q11.2-q14.3 may contain gene(s) that influence IgE production is novel and warrants further investigation. The
IgE analyses also confirmed the potential contribution of
genes within the 5q23.2-q34 and 11q13.3-q22.3 regions
that have previously been suggested [25]. Interestingly, of
the four positionally cloned genes identified using IgE as
a key phenotype only the region encompassing the GPRA
gene showed limited (non significant) linkage (7p21.1p14.1, p(SR) = 0.027).
In the BHR analyses the 6p22.3-p21.1 region was identified as containing susceptibility gene(s). This region contains the HLA locus and the HLA-G gene within this
Table 5: Weighted GSMA for total serum IgE (729 pedigrees, n = 3,224)
PROBABILITY
BIN(a)
GENETIC LOCUS(b)
DIST. (cM)(c)
PHYS POS. (KB)(d)
SUMMED RANK (SR)
p(SR)
p(OR)
2
7
39
41
43
44
50
76
1p36.23-p35.3
1q23.3-q31.1
5q11.2-q14.3
5q23.2-q34
6pter-p22.3
6p22.3-p21.1
7p21.1-p14.1
11q13.3-q22.3
20.61–54.30
170.84–201.58
64.14–97.82
131.48–164.19
0.00–32.62
32.62–65.14
29.28–59.93
72.82–98.98
9332 – 24723
159125–185232
55758–88765
123774–162087
pter-16854
16854–43207
19430–40230
70185–103732
476.251
450.659
450.303
464.611
448.903
479.723
454.706
453.763
0.01171
0.03099
0.03127
0.01890
0.03276
0.00999
0.02708
0.02792
0.41867
0.14664
0.06031
0.40276
0.02583
0.71984
0.41494
0.22926
Chromosomal regions with a p(SR) or p(OR) < 0.05 are shown. aBin number from GSMA (1–120 inclusive). bCytogenetic band (Taken from April
2002 Genome Browser, UCSC). cGenetic distance in Marshfield cM (not cumulative). dPhysical position in kilobase pairs (Taken from December
2006 UniSTS, NCBI/Genome Browser, UCSC). *p < 0.000417 = Genome wide significance for linkage, p < 0.0083 = Suggestive for linkage [5].
Page 8 of 12
(page number not for citation purposes)
Respiratory Research 2008, 9:38
/>
Table 6: Overlapping chromosomal regions in weighted GSMA for asthma, and the three intermediate phenotypes
ASTHMA
BHR
TOTAL IGE
SPT RESPONSE
BIN(a)
GENETIC
LOCUS(b)
DIST. (cM)(c)
PHYS POS.
(KBp)(d)
p(SR)
p(OR)
p(SR)
p(OR)
p(SR)
p(OR)
p(SR)
6
7
15
24
40
41
43
44
45
46
50
55
71
1p13.3-q23.3
1q23.3-q31.1
2p12-q22.1
3p14.1-q12.3
5q5q14.3-q23.2
5q23.2-q34
6pter-p22.3
6p22.3-p21.1
6p21.1-q15
6q15-q23.2
7p21.1-p14.1
8pter-p22
10q23.33q26.13
11q13.3-q22.3
11q22.3-q24.1
11q24.1-qter
12q24.31-qter
13pter-q13.2
14q32.12-qter
18q22.1-qter
20p11-q13.13
21q21.3-qter
142.24–170.84
170.84–201.58
101.56–128.41
88.60–117.76
97.82–131.48
131.48–164.19
0.00–32.62
32.62–65.14
65.14–99.01
99.01–131.07
29.28–59.93
0.00–27.40
117.42–142.78
110103–159125
159125–185232
79617–119705
64182–103187
88765–123774
123774–162087
pter-16854
16854–43207
43207–90985
90985–132584
19430–40230
pter-13111
95985–123274
0.79974
0.02348
0.71879
0.06027
0.65433
0.03905
0.86218
0.68196
0.85805
0.00694
0.80059
0.05004
0.77886
0.03220
0.72593
0.01583
0.01899
0.05664
0.00574*
0.09312
0.01511
0.00716*
0.07128
0.09445
0.03597
0.16985
0.14743
0.17837
0.09586
0.04861
0.19832
0.10925
0.24658
0.08106
0.06630
0.03099
0.09195
0.01890
0.03276
0.00999
0.02708
-
0.13155
0.14664
0.08596
0.40276
0.02583
0.71984
0.41494
-
0.02081 0.22906
0.08924 0.13402
0.00298 0.00450*
0.09934 0.16043
0.03654 0.12598
0.03318 0.18839
0.06027 0.07341
-
72.82–98.98
98.98–123.00
123.00–147.77
139.61–170.60
0.00–26.87
105.00–138.18
96.48–126.00
47.52–72.27
25.26–57.77
70185–103732
0.12913 0.01652
103732–122977
122977-qter
0.00505* 0.46485
120806-qter
0.02714 0.65821
pter-33636
0.05521 0.18686
90647-qter
0.88932 0.00423*
60025-qter
0.08190 0.24216
21259–46747 0.65424 0.06184 0.10563 0.03503
27903-qter
0.20402 0.09140
0.02792
0.08890
0.07175
0.08835
-
0.22926
0.12887
0.10909
0.22042
-
0.04276
0.08072
0.95708
0.96132
0.03029
76
77
78
84
85
92
108
115
118
p(OR)
0.11460
0.12542
0.07887
0.03480
0.28738
Chromosomal regions with p(SR) or p(OR) < 0.1 in two or more weighted GSMA are shown. aBin number from GSMA (1–120 inclusive).
bCytogenetic band (Taken from April 2002 Genome Browser, UCSC). cGenetic distance in Marshfield cM (not cumulative). dPhysical position in
kilobase pairs (Taken from December 2006 UniSTS, NCBI/Genome Browser, UCSC). *p < 0.000417 = Genome wide significance for linkage, p <
0.0083 = Suggestive for linkage.
region has previously been identified as a potential
asthma and BHR susceptibility gene using four cohorts
(including the Dutch cohort used in the current analyses)
[26]. Our data confirms this region as a BHR locus and
less significantly a potential asthma locus (p(SR) =
0.039). Interestingly, four of the six populations used for
the BHR analyses ranked the chromosome 2p locus identified in the top 33% of bins including the Genetics of
Asthma International Network (GAIN) study (data not
shown). Further mapping of the 2p locus in the GAIN
population using single nucleotide polymorphisms
(SNP) spanning the region refined the linkage peak to ~70
cM with the greatest evidence being for the BHR phenotype (LOD score 4.58) [16]. Region 2p12-q22.1 contains
the DPP10 gene that has previously been identified as an
asthma and total IgE susceptibility gene [27] and the
IL1RN gene identified using asthma as the primary phenotype [28]. The identification of 11q24.1-qter as a
potential BHR susceptibility locus appears to be novel and
therefore these data may provide a platform for novel
BHR susceptibility gene identification. The BHR analyses
also confirmed the potentially modest contribution of
other loci in determining the BHR phenotype including
e.g. 5q23.2-q34 and 19q12-q13.33. In the analyses of the
BHR phenotype significant linkage was not driven by
studies using a specific agonist i.e. studies using both
methacholine and histamine provocation contributed to
the signal at a specific locus (data not shown). These data
suggest responsiveness to these agents share a common
genetic basis and provide support for combining studies
in the meta-analyses using these different provocation
stimuli.
Significantly, using asthma as a phenotype we did not
identify any chromosomal region as showing genomewide significance in our analyses. In most studies, asthma
was defined as a doctor's diagnosis. In the Dutch study,
families were ascertained through a proband with a doctor's diagnosis of asthma. In the offspring of these asthma
patients, an algorithm was used since a doctor's diagnosis
per se underestimated the prevalence of asthma in the offspring [8]. To confirm that the inclusion of the Dutch
linkage data for the asthma phenotype had not confounded the analyses we completed GSMA without these
data and again no chromosomal region with a p(SR) and
p(OR) < 0.05 was identified (data not shown). These data
may reflect the true locus heterogeneity in asthma or
reflect differences in phenotype definition when compar-
Page 9 of 12
(page number not for citation purposes)
Respiratory Research 2008, 9:38
ing asthma based on doctors' diagnosis over different
cohorts. In addition the use if a binary trait i.e. affection
will have the lowest intrinsic power compared to continual data e.g. IgE levels.
Interestingly, the recently published whole genome association study using 994 asthmatic children and 1,243 non
asthmatic children identified only 16 SNPs (eight on
chromosome 17) from a total of 317,447 SNPs tested
showing a significant association with asthma per se (5%
false discovery threshold, stratification corrected) [24].
This study complements our analysis using data from
1,257 families and taken together suggests that the use of
asthma as a phenotype may be confounded due to locus
heterogeneity in asthma and/or issues concerning phenotype definition/heterogeneity when combining cohorts. It
is important to note that the family based studies
included in this meta-analyses address the genetic basis of
asthma defined in children i.e. the mean age of siblings in
most studies is < 16 years.
Several regions showed suggestive evidence for linkage to
the asthma phenotype mainly based on the p(OR) statistic, however caution should be taken interpreting p(OR)
in isolation, especially in the presence of incomplete data
sets [5]. Further evidence for the chromosome 12 and 20
loci comes from the finding that adjacent bins have a
p(OR) < 0.05 suggesting the linkage is spanning the bin
interval. 4/6 regions containing the positionally cloned
asthma susceptibility genes i.e. ADAM33 (20p13[7]),
PHF11 (13q14.3 [29]), DPP10 (2q14.1 [27]), HLAG
(6p21.3 [26]), GPRA (7p14.3 [30]), IL1RN (2q13 [28])
and the recently reported gene ORMDL3 (17q12q21[24]) were identified by the GSMA approach,
ADAM33 (p(OR) = 0.005), DPP10 and IL1RN (p(OR) =
0.007) and less significantly HLA-G (p(SR) = 0.039) and
GRPA (p(OR) = 0.031). In addition our data also suggests
that further investigation of additional chromosomal
regions may be productive e.g. 1p31.1-p13.3 and
14q32.12-qter. Recently, the 1p31 and 14q32 regions
have been highlighted as potential asthma loci in a French
cohort with data suggesting 1p31 may contain gene(s) of
importance to asthma and atopic dermatitis co morbidity
and the 14q32 locus may interact with smoking exposure
and contain asthma susceptibility gene(s) [31,32].
The analysis of overlap between chromosomal regions
confirmed the importance of the HLA locus on chromosome 6 as being a key susceptibility locus in asthma and
also highlighted other regions that may be of importance
i.e. 5q23.2-q34 and 7p21.1-14.1. The 5q23.2-q34 region
contains the cytokine gene cluster (IL4, Il13, IL5, IL12B)
and has previously been suggested as an asthma/atopy
susceptibility locus [3] and the 7p21.1-14.1 region con-
/>
tains the previously identified asthma susceptibility gene,
GPRA (7p14.3) [30].
In conclusion, we present the first systematic meta-analyses of asthma and related trait linkage data in the Caucasian population. These data are based on the majority of
the data available in the public domain (or through collaboration) therefore we do not consider that exclusion or
missing data for other populations has biased our analyses. While the GSMA method has limitations e.g. only
large chromosomal regions can be identified, these analyses have determined the role of several previously identified susceptibility loci and highlighted the significance of
regions not previously implicated in asthma and atopy
susceptibility. Importantly, this study also highlighted the
limitations of using asthma as a phenotype in contrast to
quantitative traits even with the increased power of 1,267
families composed of 5,832 individuals. Finally, these
data will provide useful guidance for the interpretation of
the anticipated genome wide association analyses in
asthma and atopy.
List of abbreviations
GSMA: Genome Scan Meta-analysis; SPT: allergen positive
skin prick test; IgE: total serum Immunoglobulin E (IgE);
BHR: bronchial hyper-responsiveness (BHR).
Competing interests
The authors declare that they have no competing interests.
Authors' contributions
IS designed the study, compiled and interpreted results
and wrote the manuscript. SD contributed to the study
design, completed the data analyses and contributed to
the writing of the manuscript. GHK, MW and MAF provided datasets, contributed to the design of the study and
the writing of the manuscript. JB and IPH contributed to
the design of the study and the writing of the manuscript.
All authors read and approved the final manuscript.
Acknowledgements
I. Sayers is supported by the Medical Research Council (New Investigator
Award) and the Dutch family studies were supported by The Netherlands
Asthma Foundation and the National Institute of Health (NIH). We thank
Professor William Cookson for providing datasets and Dr Cathryn Lewis
for making the GSMA software available.
References
1.
2.
3.
4.
5.
Tattersfield AE, Knox AJ, Britton JR, Hall IP: Asthma. Lancet 2002,
360(9342):1313-1322.
Los H, Koppelman GH, Postma DS: The importance of genetic
influences in asthma. Eur Respir J 1999, 14(5):1210-1227.
Ober C, Hoffjan S: Asthma genetics 2006: the long and winding
road to gene discovery. Genes Immun 2006, 7(2):95-100.
Wise LH, Lanchbury JS, Lewis CM: Meta-analysis of genome
searches. Ann Hum Genet 1999, 63(Pt 3):263-272.
Levinson DF, Levinson MD, Segurado R, Lewis CM: Genome scan
meta-analysis of schizophrenia and bipolar disorder, part I:
Methods and power analysis. Am J Hum Genet 2003, 73(1):17-33.
Page 10 of 12
(page number not for citation purposes)
Respiratory Research 2008, 9:38
6.
7.
8.
9.
10.
11.
12.
13.
14.
15.
16.
17.
18.
19.
20.
Ober C, Tsalenko A, Parry R, Cox NJ: A second-generation
genomewide screen for asthma-susceptibility alleles in a
founder population. Am J Hum Genet 2000, 67(5):1154-1162.
Van Eerdewegh P, Little RD, Dupuis J, Del Mastro RG, Falls K, Simon
J, Torrey D, Pandit S, McKenny J, Braunschweiger K, Walsh A, Liu Z,
Hayward B, Folz C, Manning SP, Bawa A, Saracino L, Thackston M,
Benchekroun Y, Capparell N, Wang M, Adair R, Feng Y, Dubois J, FitzGerald MG, Huang H, Gibson R, Allen KM, Pedan A, Danzig MR,
Umland SP, Egan RW, Cuss FM, Rorke S, Clough JB, Holloway JW,
Holgate ST, Keith TP: Association of the ADAM33 gene with
asthma and bronchial hyperresponsiveness. Nature 2002,
418(6896):426-430.
Panhuysen CI, Bleecker ER, Koeter GH, Meyers DA, Postma DS:
Characterization of obstructive airway disease in family
members of probands with asthma. An algorithm for the
diagnosis of asthma. Am J Respir Crit Care Med 1998, 157(6 Pt
1):1734-1742.
Daniels SE, Bhattacharrya S, James A, Leaves NI, Young A, Hill MR,
Faux JA, Ryan GF, le Souef PN, Lathrop GM, Musk AW, Cookson
WO: A genome-wide search for quantitative trait loci underlying asthma. Nature 1996, 383(6597):247-250.
Koppelman GH, Stine OC, Xu J, Howard TD, Zheng SL, Kauffman HF,
Bleecker ER, Meyers DA, Postma DS: Genome-wide search for
atopy susceptibility genes in Dutch families with asthma. J
Allergy Clin Immunol 2002, 109(3):498-506.
Dizier MH, Besse-Schmittler C, Guilloud-Bataille M, Annesi-Maesano
I, Boussaha M, Bousquet J, Charpin D, Degioanni A, Gormand F,
Grimfeld A, Hochez J, Hyne G, Lockhart A, Luillier-Lacombe M, Matran R, Meunier F, Neukirch F, Pacheco Y, Parent V, Paty E, Pin I, Pison
C, Scheinmann P, Thobie N, Vervloet D, Kauffmann F, Feingold J,
Lathrop M, Demenais F: Genome screen for asthma and related
phenotypes in the French EGEA study. Am J Respir Crit Care Med
2000, 162(5):1812-1818.
Altmuller J, Seidel C, Lee YA, Loesgen S, Bulle D, Friedrichs F, Jellouschek H, Kelber J, Keller A, Schuster A, Silbermann M, Wahlen W,
Wolff P, Schlenvoigt G, Ruschendorf F, Nurnberg P, Wjst M: Phenotypic and genetic heterogeneity in a genome-wide linkage
study of asthma families. BMC Pulm Med 2005, 5:1.
Ferreira MA, O'Gorman L, Le Souef P, Burton PR, Toelle BG, Robertson CF, Visscher PM, Martin NG, Duffy DL: Robust estimation of
experimentwise P values applied to a genome scan of multiple asthma traits identifies a new region of significant linkage
on chromosome 20q13. Am J Hum Genet 2005, 77(6):1075-1085.
Bayne NK, Mathews KP: Determination of total IgE by ELISA in
tubes and plates compared with PRIST. Clinical biochemistry
1982, 15(3):167-169.
Bousquet J, Chanez P, Chanal I, Michel FB: Comparison between
RAST and Pharmacia CAP system: a new automated specific IgE assay. J Allergy Clin Immunol 1990, 85(6):1039-1043.
Pillai SG, Chiano MN, White NJ, Speer M, Barnes KC, Carlsen K, Gerritsen J, Helms P, Lenney W, Silverman M, Sly P, Sundy J, Tsanakas J,
von Berg A, Whyte M, Varsani S, Skelding P, Hauser M, Vance J, Pericak-Vance M, Burns DK, Middleton LT, Brewster SR, Anderson WH,
Riley JH: A genome-wide search for linkage to asthma phenotypes in the genetics of asthma international network families: evidence for a major susceptibility locus on
chromosome 2p. Eur J Hum Genet 2006, 14(3):307-316.
Sekerel BE, Saraclar Y, Kalayci O, Cetinkaya F, Tuncer A, Adalioglu G:
Comparison of four different measures of bronchial responsiveness in asthmatic children. Allergy 1997, 52(11):1106-1109.
Pardi F, Levinson DF, Lewis CM: GSMA: software implementation of the genome search meta-analysis method. Bioinformatics 2005, 21(24):4430-4431.
Bouzigon E, Dizier MH, Krahenbuhl C, Lemainque A, Annesi-Maesano
I, Betard C, Bousquet J, Charpin D, Gormand F, Guilloud-Bataille M,
Just J, Le Moual N, Maccario J, Matran R, Neukirch F, Oryszczyn MP,
Paty E, Pin I, Rosenberg-Bourgin M, Vervloet D, Kauffmann F, Lathrop
M, Demenais F: Clustering patterns of LOD scores for asthmarelated phenotypes revealed by a genome-wide screen in 295
French EGEA families. Hum Mol Genet 2004, 13(24):3103-3113.
Colilla S, Nicolae D, Pluzhnikov A, Blumenthal MN, Beaty TH,
Bleecker ER, Lange EM, Rich SS, Meyers DA, Ober C, Cox NJ: Evidence for gene-environment interactions in a linkage study
of asthma and smoking exposure. J Allergy Clin Immunol 2003,
111(4):840-846.
/>
21.
22.
23.
24.
25.
26.
27.
28.
29.
30.
31.
32.
33.
34.
Mathias RA, Freidhoff LR, Blumenthal MN, Meyers DA, Lester L, King
R, Xu JF, Solway J, Barnes KC, Pierce J, Stine OC, Togias A, Oetting
W, Marshik PL, Hetmanski JB, Huang SK, Ehrlich E, Dunston GM,
Malveaux F, Banks-Schlegel S, Cox NJ, Bleecker E, Ober C, Beaty TH,
Rich SS: Genome-wide linkage analyses of total serum IgE
using variance components analysis in asthmatic families.
Genet Epidemiol 2001, 20(3):340-355.
Ober C, Tsalenko A, Willadsen S, Newman D, Daniel R, Wu X, Andal
J, Hoki D, Schneider D, True K, Schou C, Parry R, Cox N: Genomewide screen for atopy susceptibility alleles in the Hutterites.
Clin Exp Allergy 1999, 29 Suppl 4:11-15.
Bradley M, Soderhall C, Luthman H, Wahlgren CF, Kockum I, Nordenskjold M: Susceptibility loci for atopic dermatitis on chromosomes 3, 13, 15, 17 and 18 in a Swedish population. Hum
Mol Genet 2002, 11(13):1539-1548.
Moffatt MF, Kabesch M, Liang L, Dixon AL, Strachan D, Heath S, Depner M, von Berg A, Bufe A, Rietschel E, Heinzmann A, Simma B,
Frischer T, Willis-Owen SA, Wong KC, Illig T, Vogelberg C, Weiland
SK, von Mutius E, Abecasis GR, Farrall M, Gut IG, Lathrop GM, Cookson WO: Genetic variants regulating ORMDL3 expression
contribute to the risk of childhood asthma. Nature 2007,
448::470-3.
Hoffjan S, Ober C: Present status on the genetic studies of
asthma. Curr Opin Immunol 2002, 14(6):709-717.
Nicolae D, Cox NJ, Lester LA, Schneider D, Tan Z, Billstrand C, Kuldanek S, Donfack J, Kogut P, Patel NM, Goodenbour J, Howard T,
Wolf R, Koppelman GH, White SR, Parry R, Postma DS, Meyers D,
Bleecker ER, Hunt JS, Solway J, Ober C: Fine mapping and positional candidate studies identify HLA-G as an asthma susceptibility gene on chromosome 6p21. Am J Hum Genet 2005,
76(2):349-357.
Allen M, Heinzmann A, Noguchi E, Abecasis G, Broxholme J, Ponting
CP, Bhattacharyya S, Tinsley J, Zhang Y, Holt R, Jones EY, Lench N,
Carey A, Jones H, Dickens NJ, Dimon C, Nicholls R, Baker C, Xue L,
Townsend E, Kabesch M, Weiland SK, Carr D, von Mutius E, Adcock
IM, Barnes PJ, Lathrop GM, Edwards M, Moffatt MF, Cookson WO:
Positional cloning of a novel gene influencing asthma from
chromosome 2q14. Nat Genet 2003, 35(3):258-263.
Gohlke H, Illig T, Bahnweg M, Klopp N, Andre E, Altmuller J, Herbon
N, Werner M, Knapp M, Pescollderungg L, Boner A, Malerba G, Pignatti PF, Wjst M: Association of the interleukin-1 receptor
antagonist gene with asthma. Am J Respir Crit Care Med 2004,
169(11):1217-1223.
Zhang Y, Leaves NI, Anderson GG, Ponting CP, Broxholme J, Holt R,
Edser P, Bhattacharyya S, Dunham A, Adcock IM, Pulleyn L, Barnes PJ,
Harper JI, Abecasis G, Cardon L, White M, Burton J, Matthews L,
Mott R, Ross M, Cox R, Moffatt MF, Cookson WO: Positional cloning of a quantitative trait locus on chromosome 13q14 that
influences immunoglobulin E levels and asthma. Nat Genet
2003, 34(2):181-186.
Laitinen T, Polvi A, Rydman P, Vendelin J, Pulkkinen V, Salmikangas P,
Makela S, Rehn M, Pirskanen A, Rautanen A, Zucchelli M, Gullsten H,
Leino M, Alenius H, Petays T, Haahtela T, Laitinen A, Laprise C, Hudson TJ, Laitinen LA, Kere J: Characterization of a common susceptibility locus for asthma-related traits. Science 2004,
304(5668):300-304.
Dizier MH, Bouzigon E, Guilloud-Bataille M, Genin E, Oryszczyn MP,
Annesi-Maesano I, Demenais F: Evidence for a locus in 1p31
region specifically linked to the co-morbidity of asthma and
allergic rhinitis in the EGEA study. Hum Hered 2007, 63(34):162-167.
Dizier MH, Bouzigon E, Guilloud-Bataille M, Siroux V, Lemainque A,
Boland A, Lathrop M, Demenais F: Evidence for gene x smoking
exposure interactions in a genome-wide linkage screen of
asthma and bronchial hyper-responsiveness in EGEA families. Eur J Hum Genet 2007, 15(7):810-815.
CSGA: A genome-wide search for asthma susceptibility loci
in ethnically diverse populations. The Collaborative Study on
the Genetics of Asthma (CSGA).
Nat Genet 1997,
15(4):389-392.
Wjst M, Fischer G, Immervoll T, Jung M, Saar K, Rueschendorf F, Reis
A, Ulbrecht M, Gomolka M, Weiss EH, Jaeger L, Nickel R, Richter K,
Kjellman NI, Griese M, von Berg A, Gappa M, Riedel F, Boehle M, van
Koningsbruggen S, Schoberth P, Szczepanski R, Dorsch W, Silbermann M, Wichmann HE, et al.: A genome-wide search for linkage
Page 11 of 12
(page number not for citation purposes)
Respiratory Research 2008, 9:38
35.
36.
37.
/>
to asthma. German Asthma Genetics Group. Genomics 1999,
58(1):1-8.
Hakonarson H, Bjornsdottir US, Halapi E, Palsson S, Adalsteinsdottir
E, Gislason D, Finnbogason G, Gislason T, Kristjansson K, Arnason T,
Birkisson I, Frigge ML, Kong A, Gulcher JR, Stefansson K: A major
susceptibility gene for asthma maps to chromosome 14q24.
Am J Hum Genet 2002, 71(3):483-491.
Meyers DA, Postma DS, Stine OC, Koppelman GH, Ampleford EJ,
Jongepier H, Howard TD, Bleecker ER: Genome screen for
asthma and bronchial hyperresponsiveness: interactions
with passive smoke exposure. J Allergy Clin Immunol 2005,
115(6):1169-1175.
Xu J, Postma DS, Howard TD, Koppelman GH, Zheng SL, Stine OC,
Bleecker ER, Meyers DA: Major genes regulating total serum
immunoglobulin E levels in families with asthma. Am J Hum
Genet 2000, 67(5):1163-1173.
Publish with Bio Med Central and every
scientist can read your work free of charge
"BioMed Central will be the most significant development for
disseminating the results of biomedical researc h in our lifetime."
Sir Paul Nurse, Cancer Research UK
Your research papers will be:
available free of charge to the entire biomedical community
peer reviewed and published immediately upon acceptance
cited in PubMed and archived on PubMed Central
yours — you keep the copyright
BioMedcentral
Submit your manuscript here:
/>
Page 12 of 12
(page number not for citation purposes)