Báo cáo y học: "Biochemical and morphological changes in endothelial cells in response to hypoxic interstitial edema" pdf
Bạn đang xem bản rút gọn của tài liệu. Xem và tải ngay bản đầy đủ của tài liệu tại đây (635.14 KB, 14 trang )
BioMed Central
Page 1 of 14
(page number not for citation purposes)
Respiratory Research
Open Access
Research
Biochemical and morphological changes in endothelial cells in
response to hypoxic interstitial edema
Laura Botto, Egidio Beretta, Rossella Daffara, Giuseppe Miserocchi and
Paola Palestini*
Address: Department of Experimental, Environmental Medicine and Biotechnologies (DIMESAB), University of Milano-Bicocca, Via Cadore 48
20052 Monza, Italy
Email: Laura Botto - ; Egidio Beretta - ; Rossella Daffara - ;
Giuseppe Miserocchi - ; Paola Palestini* -
* Corresponding author
Abstract
Background: A correlation between interstial pulmonary matrix disorganization and lung cellular response was
recently documented in cardiogenic interstitial edema as changes in the signal-cellular transduction platforms
(lipid microdomains: caveoale and lipid rafts). These findings led to hypothesize a specific "sensing" function by
lung cells resulting from a perturbation in cell-matrix interaction. We reason that the cell-matrix interaction may
differ between the cardiogenic and the hypoxic type of lung edema due to the observed difference in the
sequential degradation of matrix proteoglycans (PGs) family. In cardiogenic edema a major fragmentation of high
molecular weight PGs of the interfibrillar matrix was found, while in hypoxia the fragmentation process mostly
involved the PGs of the basement membrane controlling microvascular permeability. Based on these
considerations, we aim to describe potential differences in the lung cellular response to the two types of edema.
Methods: We analysed the composition of plasma membrane and of lipid microdomains in lung tissue samples
from anesthetized rabbits exposed to mild hypoxia (12 % O
2
for 3–5 h) causing interstitial lung edema. Lipid
analysis was performed by chromatographic techniques, while protein analysis by electrophoresis and Western
blotting. Lipid peroxidation was assessed on total plasma membranes by a colorimetric assay (Bioxytech LPO-
586, OxisResearch). Plasma membrane fluidity was also assessed by fluorescence. Lipid microdomains were
isolated by discontinuous sucrose gradient. We also performed a morphometric analysis on lung cell shape on
TEM images from lung tissue specimen.
Results: After hypoxia, phospholipids content in plasma membranes remained unchanged while the cholesterol/
phospholipids ratio increased significantly by about 9% causing a decrease in membrane fluidity. No significant
increase in lipid peroxidation was detected. Analysis of lipid microdomains showed a decrease of caveolin-1 and
AQP1 (markers of caveolae), and an increase in CD55 (marker of lipid rafts). Morphometry showed a significant
decrease in endothelial cell volume, a marked increase in the cell surface/volume ratio and a decrease in caveolar
density; epithelial cells did not show morphological changes.
Conclusion: The biochemical, signaling and morphological changes observed in lung endothelial cell exposed to
hypoxia are opposite to those previously described in cardiogenic edema, suggesting a differential cellular
response to either type of edema.
Published: 13 January 2006
Respiratory Research 2006, 7:7 doi:10.1186/1465-9921-7-7
Received: 28 October 2005
Accepted: 13 January 2006
This article is available from: />© 2006 Botto et al; licensee BioMed Central Ltd.
This is an Open Access article distributed under the terms of the Creative Commons Attribution License ( />),
which permits unrestricted use, distribution, and reproduction in any medium, provided the original work is properly cited.
Respiratory Research 2006, 7:7 />Page 2 of 14
(page number not for citation purposes)
Background
The interstitial compartment of the lung is kept at a subat-
mospheric pressure in physiological conditions, a feature
shared by other compartments where extravascular water
is kept at a least amount. In the lung, a relatively "dry"
interstitial space allows a minimum thickness of the air-
blood barrier to optimize gas diffusion. A rise in extravas-
cular lung water may occur because of an increase in the
pressure gradient across the microvascular barrier and/or
by an increase in perm-porosity of the endothelial barrier.
The first case, the so called cardiogenic lung edema, may
represent the consequence of left ventricular failure with
increased left atrial and pulmonary capillary pressure.
Conversely, hypoxia exposure may fall into the second
case as it may augment microvascular permeability. Severe
lung edema is indeed a life threatening complication of
high altitude exposure with presence of protein rich fluid
in the alveolar spaces.
An important finding concerning the initial phase of
edema development in both models is that a minor
increase in extravascular water, about 5%, leads to a
marked increase in interstitial pressure (from about -10 to
about 5 cm H
2
O [1]), indicating a fairly low compliance
of the lung extracellular matrix that obviously represents a
strong "tissue safety factor" against edema development as
it balances further microvascular filtration [2]. It was also
found that in interstitial lung edema, some degree of dis-
organization of the extracellular matrix occurs, despite its
strong mechanical resistance, particularly at the expense
of proteoglycans (PGs) [3]. These molecules are responsi-
ble for the structural integrity of pulmonary interstitium
as they control fluid dynamics through their influence on
microvascular permeability and tissue compliance. Fur-
thermore, proteoglycans are also involved in cell-cell and
cell-matrix interactions and in the cytokine network [4] as
they regulate the traffic of the molecules within the inter-
stitial space and promote interactions. A possible correla-
tion between matrix disorganization and cellular function
was documented in the cardiogenic model of interstitial
edema as changes in composition of plasma membrane
lipid microdomains involved in signal-transduction [5].
These findings led to hypothesize a specific "sensing"
function by lung cells resulting from a perturbation in
cell-matrix interaction [6]. We may reason that the cell-
matrix interaction may differ between the two types of
edema as a difference was found in the sequential degra-
dation of PGs family and in the interaction properties of
PGs to some matrix components [7,8]. Indeed, in the car-
diogenic model we found a major fragmentation of high
molecular weight chondroitin sulphate PGs of the interfi-
brillar matrix, while in hypoxia the fragmentation process
mostly involved the intermediate molecular weight
heparansulphate PGs, such as perlecan of the basement
membrane. Furthermore, for a similar increase in
extravascular water, PGs degradation, as judged from total
hexuronate recovery, was greater in hypoxia [7]. Based on
these considerations, we aim to describe potential differ-
ences in the lung cellular response to the two types of
edema that imply differences in the process of disorgani-
zation of the extracellular matrix. We performed a bio-
chemical and morphometric study focusing in particular
on the plasma membrane bilayer lipid pattern, including
a particular subset of phospholipids (lyso-phospholipids
and plasmalogens) that are implicated in the oxidant-
antioxidant phenomena and on lipid microdomains
(caveolae and lipid rafts).
Methods
Chemical
The reagents used (analytical grade) and HPTLC plates
(Kieselgel 60) were purchased from Merck GmbH (Darm-
stadt, Germany). CAPS, MES, Percoll, PMSF, HRP-CTB
were from Sigma Chem. Co. (Milano, Italy). Antibody
against caveolin-1 (C2297) and flotillin (F65020) were
from Transduction Labs (Lexington, KY, USA). Antibody
against aquaporin-1 (sc-9878) was from Santa Cruz Bio-
technology (CA, USA). CD55 (1A10) was from BD Phar-
migen. Antibody against actin (A 2066) was from SIGMA.
All the material for the electrophoresis was from BioRad,
(Milano, Italy). Autoradiographic films was from Amer-
sham Pharmacia Biotech (Uppsala, Sweden).
Lung tissue preparation and plasma membrane
purification
General preparation. Experiments were done in rabbits
(2.5 ± 0.5 (SD) Kg body wt) anesthetized with a mixture
of 2.5 ml/kg of 50% urethane (wt/vol, in saline solution)
and 40 ml/kg body wt of ketamine injected into an ear
vein. Subsequent doses of anesthetic were administered
during the experiments judging from the arousal of ocular
reflexes.
The study was based a protocol accepted by D.L. 116/
1992, art.3, 4, 5 and performed according to the estab-
lished rules of animal care.
The trachea was cannulated. We considered the following
groups of animals for biochemical determinations:1) ani-
mals exposed to room air breathing sacrificed immedi-
ately after anesthesia and tracheotomy (control N = 5); 2)
animals exposed to room air and left to breath in anesthe-
sia for up to 3 h (sham N = 4); 3) animals exposed to
hypoxia (12 % O
2
in nitrogen) for 3 h (N = 4); 4) animals
exposed to hypoxia for 5 hours (N = 3).
We perfused the lungs for about 5 min at room tempera-
ture with mammalian Ringer's solution (without calcium)
containing nitroprusside (20 mg/ml). Nitroprusside is a
donor of nitric oxide; however this effect should be
Respiratory Research 2006, 7:7 />Page 3 of 14
(page number not for citation purposes)
present both in control and treated animal samples; there-
fore the observed differences in membrane protein
response when comparing control and sham to treated
animals should be due to the specific conditions caused
by hypoxia. After this, the lungs were flushed with 50 ml
of solution 1 (0.25 M sucrose, 20 mM Tricine pH 7.4 and
40 µg/ml of the protease inhibitors aprotinin, chymosta-
tin, leupeptin and antipapain), excised from the chest and
immersed in ice cold solution 1.
We also estimated the level of lipid peroxidation in con-
trol, sham, hypoxia exposure and saline induced lung
edema (i.v. infusion 0.5 ml/kg min for 3 h) that mimics
cardiogenic edema: in these animals, we added butylate
hydroxytoluene in solution 1 to reach a concentration 0.2
mM.
The lung tissue was finely minced at 4°C and homoge-
nated in solution 1, then filtered sequentially through 53
and 30 µm filters. The homogenate was subjected to cen-
trifugation (1,000 g for 10 min) at 4°C, and the superna-
tants were saved. The resulting pellet was resuspended in
3 ml of buffer and subjected again to centrifugation as
above. The pooled supernatants were overlaid over 25 ml
of 30% Percoll in buffer. After centrifugation using a
SW28 rotor at 84,000 g for 45 min at 4°C, we collected a
single membranous band (about 1 ml) readily visible at
about 2/3 from bottom of the tube. To reduce the vol-
umes and concentrate the membranes, the bands were
pelleted by first diluting the suspension 3 fold with PBS
before centrifugation at 100,000 g for 20 min at 4°C.
These membrane fractions were collected and called PMC
(for control), PMH3 and PMH5 (for 3 and 5 hours of
hypoxia) respectively, and aliquots were taken for differ-
ent analysis.
Isolation of detergent-resistant fraction
The plasma membrane pellets (PMC and PMH3) were
resuspended in 1 ml of MBS buffer (25 mM of MES buffer,
pH 6.5, containing 150 mM NaCl, 1 mM phenylmethyl-
sulfonylfluoride and 75 units/ml aprotinin) and we deter-
mined its protein content (BCA methods). Next, we took
a volume containing 4.5 mg of protein, a quantity
required for each gradient procedure. In order to maintain
a constant protein/detergent ratio in all experiments, we
added MBS buffer containing Triton X-100 up to a volume
of 2 ml to reach a final Triton concentration of 1%. All the
procedure was carried on ice for 20 min to maintain the
integrity of lipid rafts. Finally, the 2 ml were diluted with
an equal volume of 80% (w\v) sucrose in MBS lacking Tri-
ton X-100 and placed at the bottom of a tube where a dis-
continuous sucrose concentration gradient was created
(40, 30, 5 % sucrose, from bottom up) in MBS lacking Tri-
ton X-100. After centrifugation at 250,000 g for 18 hrs at
4°C with a TW-41 rotor (Beckman Instruments), 1 ml
fractions were collected from the top of the gradient and
submitted to further analysis. From now on, fraction #5
(from the top) is referred as DRF (Detergent Resistant
Fraction); fractions from # 6 to 8 as IDF (Intermediate
Density Fraction); fractions from # 9 to 12 as HDF (High
Density Fraction).
Phosphorus analysis and fluorescence spectroscopy
Aliquots of PMC, and PMH3 and PMH5 from all animals
were used for phospholipid phosphorus determination
[9]. Data were expressed as micromoles per milligrams of
protein. The membrane fluidity of different samples was
assessed by fluorescence anisotropy measurements of the
fluorescent probe 1, 6-diphenyl-1, 2, 5-hexatriene (DPH)
as described [10] with minor modification. A suspension
of PMC, PMH3 and PMH5, containing ~200 nmol of
phosphorus per 1.5 ml of PBS was used. The fluorescent
probe molecule DPH was added to membrane suspension
at a final concentration of 10
-3
M. Light scattering was cor-
rected by using a blank containing the sample but not
DPH. Membranes with and without fluorescent probe
were incubated in the dark under stirring for 45 min at
37°C and were used for fluorescence polarization studies
immediately after preparation. A polarization spectrofluo-
rimeter (Cary Eclipse, Varian) with fixed excitation and
emission polarization filters was used to measure fluores-
cence intensity parallel (I
pa
) and perpendicular (I
per
) to
the polarization plane of the exciting light [10]. Excitation
and emission wavelengths were 360 and 430 nm, respec-
tively. Fluorescence anisotropy was calculated as r (I
pa
-I
per
/
I
pa
+I
per
). The sample was continuously stirred with a
microstirrer, and the temperature (37°C) was monitored
by a thermistor in the cuvette.
Table 1: Lipid content of plasma membrane fractions in control (PMC; N of animals = 3) and after 3 (PMH3; N of animals = 3) and 5
hours of hypoxia exposure (PMH5; N of animals = 3).
PMC PMH3 PMH5
Phosphorus Phospholipid (µmol/mg protein) 1.10 ± 0.2 (8) 1.24 ± 0.25 (10) 1.2 ± 0.3 (7)
Cholesterol (nmol/mg protein) 247 ± 9.8 (10) 299 ± 23.7 (24)
#
296 ± 26.7 (17)
#
Cholesterol/Phospholipids (nmol/µmol) 0.224 0.241
#
0.246
#
The data are means ± SD; in parenthesis the number of determinations ;
#
P < 0.001 vs. control
Respiratory Research 2006, 7:7 />Page 4 of 14
(page number not for citation purposes)
Lipids and fatty acid analysis
Aliquots of PMC, PMH3 and PMH5, were submitted to
lipid extraction [10]. An organic phase (containing all lip-
ids with the exception of gangliosides) and an aqueous
phase (containing gangliosides) were obtained. The lipids
were separated on HPTLC plates. The phospholipids from
PMC, PMH3 and PMH5 were chromatographed in solu-
tion B (chloroform:methanol:acetic acid:water, 60:45:4:2,
each by vol). The cholesterol, from plasma membranes,
was chromatographed in solution D (hexane:diethyl-
ether:acetic acid, 20:35:1, each by vol). In the case of neu-
tral glycosphingolipids (GLS), the lipids extracted were
submitted to alkaline methanolysis (1 h at 37°C in 0.6 N
NaOH in methanol) to remove contaminating phosphol-
ipids. After extensive dialysis, the GLS were chromato-
graphed in solution E (chloroform:methanol:water,
110:40:6, each by vol). For the analysis of the plasmalo-
gens, the phospholipids were chromatographed in solu-
tion B. The plates were then exposed to HCl vapors for 10
min and subsequently chromatographed in solution F for
second dimension (chloroform:methanol:acetone:acetic
acid:water, 50:15:15:10:5, each by vol).
For the analysis of the lysophospholipids, the phospholi-
pids were chromatographed in solution B and subse-
quently chromatographed in solution G for second
dimension (chloroform:methanol:88% formic acid,
65:25:10, each by vol).
Phospholipids and cholesterol were visualized with anis-
aldehyde, and neutral glycosphyngolipids with orcinol.
The plates were scanned with Bio-Rad system and spot
identification, and quantification was accomplished by
comparison with authentic standard lipids. Aliquots of
different total lipids extracted, corresponding to 100–150
nmol of phosphorus, were submitted to fatty acid analysis
[10].
The double bound index (DBI), commonly considered as
an index of the ratio of saturated to unsaturated fatty
acids, was calculated as follows: ∑ saturated fatty acids/∑
unsaturated fatty acids, where ∑ unsaturated f.a. is
obtained by adding the percentage of each unsaturated
fatty acid multiplied by the number of the double bounds
in its molecule.
Lipid peroxidation
Lipid peroxidation was assessed on total plasma mem-
branes in 1 animal for each group (control, sham, 3 h of
hypoxia exposure) by a colorimetric assay (Bioxytech
LPO-586, OxisResearch) of malondialdehyde (MDA) as
indicator of peroxidation. Data of MDA from lung tissue
were expressed as nmol/µmol of plasma membrane phos-
pholipidic phosphorous sampled.
Protein analysis
Aliquots of PMC, PMH3 and PMH5 and all fractions col-
lected from the gradient, were submitted to trichloroacetic
acid precipitation. The pellets, washed with acetone, were
suspended in water and protein quantity determined by
BCA method (SIGMA, USA). Thereafter, 50 µg of PMC,
PMH3 and PMH5 and 10 µg of proteins collected from
the gradient, respectively, were loaded on SDS-PAGE;
10% -polyacrylamide gel, and submitted to electrophore-
sis. Subsequently, the proteins were transferred to mem-
branes that were stained with Ponceau S to assess protein
loading by densitometry (BIORAD Densitometry 710,
program Quantity one) [6,11]. We compared on our sam-
ples the densitometry of the whole lane for protein load-
ing obtained from total plasma membranes and all
gradient fractions from control and treated animals.
Actin contents was used to normalize total plasma mem-
brane protein contents. This normalisation is not possible
for proteins from fractions obtained from discontinuous
sucrose concentration gradient because actin contents dif-
fers among these fractions [12].
Subsequently the membranes were submitted to Western
blotting. After blocking, blots were incubated for 2 h with
the primary antibody diluted in PBS-T/milk (anti-cav1
1:1000, anti-flotillin-1 1:250, anti AQP1 1:100, anti
CD55 1:100, anti actin 1:1000). Then, blots were incu-
bated for 2 hr with horseradish peroxidase-conjugated
anti-mouse/goat IgG (5,000–10,000-fold diluted in PBS-
T/milk). The protein samples were obtained from 3 con-
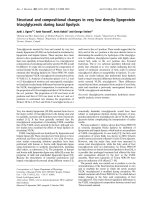
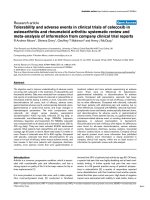
Content of phospholipids in plasma membrane fractionsFigure 1
Content of phospholipids in plasma membrane frac-
tions. Data were obtained from control (PMC) and treated
lungs, after 3 h (PMH3) and 5 h (PMH5) of exposure to
hypoxia and represent mean ± SD; data are from 3 animals in
each condition (three determinations in each animal). SPH :
sphingomyelin; PC : phosphatidylcholine; PS: phosphatidylser-
ine; PI: phosphatidylinositol; PE: phosphatidylethanolamine.
*P < 0.02 vs control.
Respiratory Research 2006, 7:7 />Page 5 of 14
(page number not for citation purposes)
trols and 3 treated animals. Proteins were detected by the
SuperSignal detection kit (Pierce, Rockford, IL). We per-
formed in parallel immunoblot analysis of samples from
one control and one treated animal for total plasmamem-
brane, and proteins from all gradient fractions. Immuno-
blot bands were analyzed by BIORAD Densitometry 710.
Statistical analysis
Biochemical determinations were repeated at least three
times for each animal. Biochemical results were expressed
as means ± SD, averaging data from the different animals.
The significance of the differences among groups was
determined using one-way ANOVA and t-test.
Morphometry
The morphometric analysis was done in the following
animal groups:1) rabbits exposed to room air breathing
sacrificed immediately after anesthesia and tracheotomy
(control; N = 2); 2) rabbits kept under anesthesia for 3
hours (sham 3 h; N = 3); 3) rabbits kept under anesthesia
for 5 hours (sham 5 h; N = 2), 4) rabbits exposed to
hypoxia (12% O
2
in nitrogen) for 3 h (N = 3); 5) rabbits
exposed to hypoxia for 5 hours (N = 3); 6) rabbits receiv-
ing i.v. saline infusion (0.5 ml/kg min for 3 h; N = 4) to
cause an increase in lung extravascular water similar to
that caused by hypoxia exposure.
For morphometric analysis we performed lung perfusion-
fixation in situ following a technique carefully detailed in
a previous paper [13]. Animals were killed by an overdose
of anesthetic just prior to the perfusion procedure; next,
with pleural sacs intact, we infused through the pulmo-
nary artery first saline (11.06 g NaCl/l plus 3% dextran T-
70 and 1,000 U heparin/dl, 350 m O sm) and then fixa-
tive (phosphate buffered 2.5% glutaraldehyde plus 3%
dextran T-70, 500, under a pressure head of 15 cm H
2
O.
Tissue samples were obtained following a stratified ran-
dom sampling procedure from ventral (top) to dorsal
(bottom) lung region and immersed in 2.5% glutaralde-
hyde for 1 hour at room temperature and subsequently
processed for resin embedding.
For light microscopy analysis, 1 µm thick sections were
obtained and stained with methylene blue. For electron
microscopy, 60 nm thick sections were obtained; they
were mounted on uncoated 200-mesh copper grids,
stained with uranyl acetate and lead citrate, finally
observed in a Zeiss EM900 electron microscope.
Morphometry at light microscopy
Micrographs were originally obtained at 100× (Olympus
BX51) and brought to a final magnification of 2600× on
the computer video screen for morphometric measure-
ments that were done according to established stereologi-
cal techniques [14]. We evaluated the surface area of the
capillaries (Sc) from the number of intersections of test
lines with the boundary profile of the capillaries accord-
ing to Sc = (2 × I)/L
t
, where L
t
is the total length of all the
test lines of the grid (length of each test line = 8.57 µm).
The data base for morphometric analysis at light micros-
Table 3: Double bound index (DBI) and fluorescence anisotropy (r) in plasma membrane fraction in control (PMC; N of animals = 3)
and after 3 (PMH3; N of animals = 3) and 5 hours of hypoxia exposure (PMH5; N of animals = 3).
PMC PMH3 PMH5
DOUBLE BOUND INDEX (DBI) 0.643 ± 0.01 0.563 ± 0.03 0.605 ± 0.02
FLUORESCENCE ANISOTROPY (r) 0.250 ± 0.009 0.269 ± 0.007* 0.265 ± 0.006*
The data are means ± SD (n = 6). * P < 0.001 vs control
Table 2: Fatty acid composition of total lipids in plasma membrane fraction in control (PMC; N of animals = 3) and after 3 (PMH3; N of
animals = 3) and 5 hours of hypoxia exposure (PMH5; N of animals = 3)
Fatty acid PMC PMH3 PMH5
14:0 1.59 ± 0.37 1.57 ± 0.38 2.48 ± 0.73 *
16:0 38.49 ± 0.58 33.36 ± 2.1* 35.2 ± 2.16 *
16:1 2.83 ± 0.22 2.38 ± 0.49 3.6 ± 0.53
18:0 14.07 ± 1.8 13.50 ± 1.4 16.1 ± 3.10
18:1 18.8 ± 0.9 18.30 ± 2.6 18.3 ± 0.92
18:2 13.36 ± 2.3 13.60 ± 1.6 13.3 ± 1.06
20:0 0.78 ± 0.25 2.0 ± 0.7
§
1.09 ± 0.17
20:1 0.42 ± 0.01 0.68 ± 0.9 0.53 ± 0.44
20:4 9.16 ± 0.2 12.46 ± 2.35
§
10.43 ± 1.97
The data are means ± SD (n = 6). § P < 0.05 vs control; * P < 0.001 vs control
Respiratory Research 2006, 7:7 />Page 6 of 14
(page number not for citation purposes)
copy was obtained from about 1000 fields from each ani-
mal group.
Morphometry at transmission electron microscopy of the
thin portion of the air-blood barrier
The thin portion of the air-blood barrier is primarily
involved in gas diffusion and corresponds to septal
regions were only a fused basement membrane separates
endothelium and epithelium. In these regions we per-
formed a morphometric evaluation of endothelial, epi-
thelial and interstitial compartments on micrographs
obtained at 22,000×, brought at a final magnification of
66,000×.
The mean arithmetic thickness (τ) of the interstitial layer
separating the endothelial and the epithelial compart-
ments was determined using a multipurpose M168 grid
(40) as given by: τ = (d·P)/[2·(I tot)], were d is the length
of test line (d = 0.174 µm), P being the number of points
falling in the compartment and I tot being its overall sur-
face boundary profile.
Volume densities (Vv) of endothelial and epithelial com-
partments were obtained by the point counting method,
while total surface areas (Stot) of each of these compart-
ments were obtained by the intersection counting
method, using a cycloidal test system [15]. For a given
compartment, total surface area and volume density are
linked by the relationship Stot = Vv × Sv, where Sv is
defined as surface density, namely surface area per unit
volume (µm
2
/µm
3
). Surface density is given by Sv = 2 × I
i
,
where I
i
is the number of intersections between the surface
area and the test lines per unit length of test line (0.1855
µm).
We also evaluated the numerical density (N
v
) of plasma-
lemmal vesicles (PVs) in endothelial and epithelial cells;
vesicles were identified by their morphology as being
non-coated and 50–90 nm in diameter. Numerical den-
sity was obtained as N
v
= number of PVs/unit volume
multiplied by a correction factor given by ( + T - 2h)
where: is the true mean diameter of the PVs (consid-
ered to average 70 nm, as commonly accepted in litera-
ture); T is the thickness of the ultrathin sections (60 nm);
h is the depth by which a vesicle must penetrate the sec-
tion before it is detected [14,16].
The data base for the analysis came, for each animal
group, from about 150 counting fields randomly chosen
on the micrographs.
For morphometric analysis, primary data (point, line
intersection and vesicle counts) were summed over all the
micrographs derived from each section and the parame-
ters were computed as the ratio of sums. The parameters
were then averaged over the various section samples. Data
were expressed as means ± SE. The significance of the dif-
ferences among groups was determined using one-way
ANOVA and t-test.
An estimate of the extravascular water accumulation was
obtained for the ratio between the weight of the fresh tis-
sue samples and after drying in the oven at 70°C for at
least 24 h (W/D ratio).
Results
Lipid analysis
The amount of phospholipidic phosphorus in plasma
membranes, normalized to total protein quantity did not
change significantly in hypoxic lungs relative to control
D
D
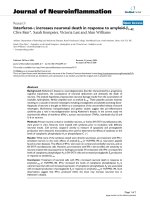
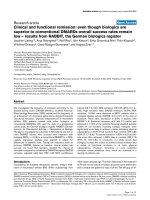
Protein contents of total plasma membranesFigure 2
Protein contents of total plasma membranes. Caveo-
lin-1, flotillin-1, AQP1, CD55 and actin contents in plasma
membrane from tissue homogenates in control (C) and
hypoxia (3 H, 5 H). At 3 H, caveolin-1 was significantly
decreased.
Respiratory Research 2006, 7:7 />Page 7 of 14
(page number not for citation purposes)
(Table 1). Data referring to sham animals were pooled
with control as they did not differ significantly.
Aliquots of samples were submitted to lipid extraction,
and the different lipids (cholesterol, glycolipid, and phos-
pholipid) were separated on HPTLC plates. The choles-
terol concentration increased significantly at 3 h,
remaining steady up to 5 h (P < 0.001) of hypoxia expo-
sure and, consequently, also the cholesterol/phospholip-
ids ratio increased significantly (Table 1). Some
differences were found in the pattern of neutral glycolip-
ids obtained from plasma membranes. The most abun-
dantglycolipid, the lacto-N-neotetraesosylceramide
decreased in PMH3 and PMH5, relative to PMC (from 73
% to 65 %, respectively), whereas triesosylceramide
increased from 8 % to 14 %, respectively, both changes
being significant (P < 0.01).
The phospholipid pattern, normalized to protein quan-
tity, is shown in Fig. 1. When comparing to control, only
phosphatidylethanolamine (PE) and phosphatidylcho-
line (PC) showed significant differences. The PE increased
by ~24 % in PMH3 and PMH5 (P < 0.02), while PC
decreased by ~7% and ~13 % in PMH3 and PMH5,
respectively. The PC/PE ratio increased from 1.3 in con-
trol, to 1.67 and 1.84 at 3 and 5 h of hypoxia, respectively.
Phosphatidylglycerol quantity was similar in control and
treated lungs, averaging ~3% of total phospholipids.
In PMC the amount of choline plasmalogen (included in
PC) and ethanolamine plasmalogen (included in PE)
were 0.024 and 0.16 nmoles/mg proteins, respectively. In
PMH3, these values increased (0.048 and 0.215 nmoles/
mg proteins, for choline and ethanolamine plasmalogen,
respectively) while in PMH5, they returned towards con-
trol values (0.021 and 0.192 nmoles/mg proteins, respec-
tively).
Lysophsophatidylethanolamine, as determined by 2D-
HPTLC, was unchanged after hypoxia exposure and aver-
aged about 0.07 nmoles/mg protein. Lysophsophatidyl-
choline was undetectable in all conditions.
Lipid peroxidation
MDA values (nmol/µmol phosphorous) were 5.7 ± 0.32
(control plus sham), 6.8 ± 2.66 (hypoxia 3 h) and 6.51 ±
0.32 (saline infusion); the increase observed in hypoxia
and saline infusion (19 and 14%, respectively) were not
significant.
Fatty acid analysis and fluorescence spectroscopy
Table 2 reports the percentage composition of total lipid
fatty acids obtained from plasma membranes. A signifi-
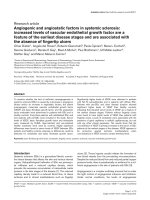
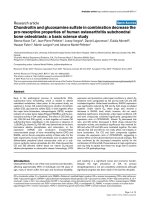
Distribution of phospholipids in the plasma membrane deter-gent resistant fractionFigure 4
Distribution of phospholipids in the plasma mem-
brane detergent resistant fraction. Distribution of dif-
ferent phospholipids in fraction 5 (detergent resistant
fraction) in control and after exposure to 3 h of hypoxia
(Control and hypoxia, respectively). SPH, sphingomyelin; PC,
phosphatidylcholine; PS, phosphatidylserine; PI, phosphati-
dylinositol; PE, phosphatidylethanolamine
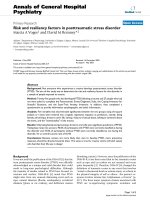
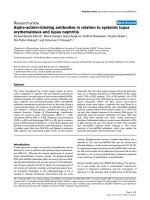
Immunoblot analysis of plasma membrane proteins in sucrose gradient fractionsFigure 3
Immunoblot analysis of plasma membrane proteins
in sucrose gradient fractions. Immunoblot analysis of
Caveolin-1 (CAV-1), flotillin (FLOT-1), AQP1 and CD55
from control and after exposure to 3 h of hypoxia (C and 3
H, respectively). In hypoxia, CAV-1 and AQP1 decreased in
fraction 5; FLOT-1 did not change while CD55 increased in
fractions 4 and 5
Respiratory Research 2006, 7:7 />Page 8 of 14
(page number not for citation purposes)
cant decrease of palmitic acid (16:0) was observed both in
PMH3 and PMH5. Arachidonic (20:4) and arachidic acid
(20:0) increased significantly only in PMH3, while miris-
tic acid (14:0) increased significantly only in PMH5.
These modifications in fatty acid composition caused a
decrease, though not significant, of the DBI (Table 3).
Using the fluorescent probe of the membrane fluidity
DPH, a significant increase of the anisotropy parameter r
was detected in PMH3 and PMH5, indicating a decrease in
fluidity of the plasma membrane (Table 3).
Protein analysis in DRF
The protein quantity of lipid microdomains obtained
from DRF amounted to about 3% of total plasma mem-
brane protein quantity and this value did not change sig-
nificantly on comparing control to 3 h hypoxia exposure.
Caveolin-1, flotillin-1, aquaporin-1 (AQP1), and CD55
were assessed by Western blotting analysis in total plasma
membranes fractions (Fig. 2) and in sucrose gradient frac-
tions (Fig. 3) of lung tissue samples from animals exposed
to 3 h of hypoxia. Fig. 2 shows that the caveolin-1 content
in total plasma membranes, evaluated from the densitom-
etry, decreased significantly (P < 0.01) by about 36% at 3
h of hypoxia but returned towards control value at 5 h.
AQP1, flotillin-1 and CD55 did not change in hypoxic
lungs with respect to control as well as beta- actin.
Fig. 3 shows the protein distribution in the detergent
resistant fractions after 3 h of hypoxia. Flotillin-1 content
in fractions 4 and 5 was unchanged on comparing control
to hypoxia. Caveolin-1 was enriched in fraction 5 in con-
trol, while it decreased about 7 fold in hypoxia in this frac-
tion; furthermore it was also found in intermediate
density fractions. AQP1 was mainly present in fractions
4–6 in control while in hypoxia it spread also towards
higher density fractions. CD55 was mostly present in frac-
tions 4 and 5 in control and in minor amount in fraction
7, while in hypoxia almost doubled in fractions 4 and 5.
Lipid analysis in DRF
Cholesterol was enriched in DRF in control (878 ± 80,
nmol/mg prot) and did not significantly change after 3 h
of hypoxia (802 ± 77, nmol/mg prot). Fig. 4 shows that
the phospholipid content in DRF, expressed as µ moles of
phosphorous/mg protein, remained essentially
unchanged after 3 h of hypoxia.
Morphometry
The morphometric analysis did not show differences
between sham and control, therefore the data were
pooled. Table 4 shows that the average thickness τ of the
interstitial space in the various groups of rabbits. Data rel-
ative to controls were pooled with those of sham referring
to 3 and 5 h as no differences were found. As Table 4
shows, τ increased with hypoxia exposure, doubling sig-
nificantly at 5 h; a similar increase occurred in the saline
infusion group, indicating a similar degree of interstitial
Ultrastructural appearance of the thin portion of the air-blood barrierFigure 5
Ultrastructural appearance of the thin portion of the
air-blood barrier. Micrographs at transmission electron
microscope of the air-blood barrier in control lungs (A), in
hypoxia (B) and in cardiogenic edema (C) at high magnifica-
tion (x66000). CL, capillary lumen; AS, alveolar space; EN,
endothelium; PV, plasmalemmal vesicle; BM, basement mem-
brane; EP, epithelium. Scale bar = 0.5 µm.
Table 4: Thickness of the interstitial layer of the air-blood barrier
(τ int, derived from transmission electron microscopy images)
and surface density of pulmonary capillaries (Sc, from light
microscopy images).
τ int, µm Sc cm
2
/cm
3
CONTROL + SHAM 0.03 ± 0.004 803.15 ± 28.06
HYPOXIA 3 h 0.05 ± 0.002 1018.25* ± 11.27
HYPOXIA 5 h 0.06* ± 0.01 857.05 ± 19.72
CARDIOGENIC EDEMA 0.06
*$
± 0.01 890.84
$
± 47.47
Mean ± SD. * P < 0.05 vs control; $ data from ref. 13 for comparison
Respiratory Research 2006, 7:7 />Page 9 of 14
(page number not for citation purposes)
edema. Hypoxia also induced a remarkable increase in
lung perfusion as indicated by the increase in surface area
(Sc) of capillaries at 3 h, with a subsequent return towards
control values at 5 h (Table 4).
Fig.5 shows high magnification (× 66000) micrographs of
the thin portion of the air blood-barrier made of endothe-
lial and epithelial cells, separated by a layer of fused base-
ment membrane. Relative to control (A), hypoxia
exposure (B) induced a thickening of the basement mem-
brane, a considerable thinning of the endothelial layer but
no appreciable changes in the epithelial layer. Fig. 5 C
allows to evaluate the response of endothelial and epithe-
lial cells of the air blood barrier in the cardiogenic edema
group; for an increase in basement membrane thickness
similar to that occurring in hypoxia, there was a consider-
able increase in cell volume and, particularly for endothe-
lial cells, in surface area and in density of plasmalemmal
vesicles.
Fig. 6A shows the frequency distribution of the volume of
the endothelial cell compartment in the various groups.
One can appreciate that in control (data pooled with
sham) and after hypoxia exposure, the frequency distribu-
tions of cellular volumes depart from normality showing
a marked skewness as the median value was smaller than
the mean (Table 5 provides the results of the normality
test). After 3h of hypoxia, the highest frequency distribu-
tion (67%) occurred for the smallest volume range and
both the mean and the median values significantly
decreased (Table 5). After 5 h of hypoxia, cell volume
tended to return towards control values. By contrast, in
Frequency distribution of volume and surface of endothelial and epithelial cells in the air-blood barrierFigure 6
Frequency distribution of volume and surface of endothelial and epithelial cells in the air-blood barrier. Histo-
grams of frequency distribution of cytoplasm volume density in endothelial (A) and epithelial (C) compartments and of total
surface of the endothelial (B) and epithelial (D) compartments in control, after 3 and 5 hours of hypoxia and in cardiogenic
edema. For simplicity of graphic presentation, volume density is presented as number of points falling in endothelial and epithe-
lial compartments, while endothelial and epithelial surfaces are presented as number of intersections between the surface and
the test lines.
Respiratory Research 2006, 7:7 />Page 10 of 14
(page number not for citation purposes)
the cardiogenic model group, endothelial volume signifi-
cantly increased (both for the mean and the median val-
ues) as the distribution extended towards high cell
volume values, remaining skew (Table 5). Fig. 6B shows
the frequency histograms for total endothelial cell surface:
the distribution appears fairly similar in control (pooled
data with sham) and hypoxia while, in the cardiogenic
edema group, the distribution of surface values extended
towards higher values with a significant increase in mean
and median values (Table 5).
A similar analysis was carried on the epithelial cells. The
epithelial cell volume distributions (Fig. 6C) were sub-
stantially similar in control (pooled data with sham) and
after 3 and 5 h of hypoxia exposure; in the cardiogenic
edema group, the average volume significantly increased
(Table 6) because of a shift in volume towards higher val-
ues, although the overall range of volume distribution
was the same in all conditions. Fig. 6D reports the fre-
quency histograms for the total surface of epithelial cells.
Despite the mean surface values do not differ on compar-
ing control (pooled data with sham) to 3 and 5 h of
hypoxia exposure (Table 6), there was a considerable
increase in frequency in the low range of surface values (a
ten fold increase, from ~ 4 to ~ 40% for the surface range
16–20). In the cardiogenic edema group, the epithelial
cell surface distribution was shifted towards higher values
and indeed the mean and median surface values were sig-
nificantly increased relative to the other groups (Table 6).
Fig. 7 allows to better estimate the modifications induced
on cellular morphology by either type of edema by plot-
ting the plasma membrane surface to cell volume ratio
(Sv) vs cell volume (Vv) for the endothelial and epithelial
layers. These relationships are hyperbolic in nature and
one can appreciate that in control conditions (closed cir-
cles, pooled data with sham) the data cover a wide spec-
trum of variation both in endothelial (Fig. 7A) and
epithelial cells (Fig. 7C). In response to hypoxia (open cir-
cles, pooled data from 3 and 5 h), there is a definite trend
for the data to scatter towards high Sv values and, corre-
spondingly, very low cell volume in endothelial cells (Fig.
7A), while no significant variations, relative to control,
were observed in epithelial cells (Fig. 7C). Conversely, in
the cardiogenic edema model (open triangles), the data
scatter towards high cell volume and correspondingly very
low Sv values in endothelial cells (Fig. 7B), with no signif-
icant variations in epithelial cells (Fig. 7D).
Fig. 8 shows that a significant regression could be found
by plotting caveolar density (Nv) in endothelial cell vs
endothelial cell volume.
Table 6: Statistics on frequency histograms of volume and surface distribution of epithelial compartment of the thin portion of the air-
blood barrier. F and P indicate either failed or passed for the normality test. For the significance of the median values the Dunn's
method was used, while for that of the mean values the Holm-Sidak method was used.
CONTROL HYPOXIA 3 h HYPOXIA 5 h CARDIOG. EDEMA
Cell Volume Cell Surface Cell Volume Cell Surface Cell Volume Cell Surface Cell Volume Cell Surface
Normality
test
FFPPPFPF
Skewness 1.53 2.9 0.48 0.1 0.99 1.52 0.46 1.64
Mean ± SE 6.8 ± 0.4 22.1 ± 0.4 6.2 ± 0.3 21.6 ± 0.3 7.5 ± 0.4 22.8 ± 0.4 11.5* ± 0.4 26.9* ± 0.5
Median 6 20 6 21 7 22 11* 25*
Mean ± SD. * significantly different (P < 0.05) relative to control and hypoxia exposure.
Table 5: Statistics on frequency histograms of volume and surface distribution of endothelial compartment of the thin portion of the
air-blood barrier. F and P indicate either failed or passed for the normality test. For the significance of the median values, the Dunn's
method was used, while for that of the mean values the Holm-Sidak method was used.
CONTROL HYPOXIA 3 h HYPOXIA 5 h CARDIOG. EDEMA
Cell volume Cell surface Cell volume Cell surface Cell volume Cell surface Cell volume Cell surface
Normality
test
FFFPPPFF
Skewness 1.53 1.36 1.24 0.77 0.67 0.98 1.07 1.39
Mean ± SE 6.5 ± 0.5 22.1 ± 0.3 4.6# ± 0.4 21.9 ± 0.3 5.9 ± 0.5 22.6 ± 0.4 16.2* ± 0.8 27.8* ± 0.7
Median 5.7 21 3.5 # 21 5.2 22 14* 25*
Mean ± SD. * significantly different (P < 0.05) relative to control and hypoxia exposure. # significantly different (P < 0.001) relative to control
Respiratory Research 2006, 7:7 />Page 11 of 14
(page number not for citation purposes)
The W/D ratio was 4.98 ± 0.3 in control conditions (aver-
age data from zero time and sham for 3 h), 5.12 ± 0.1 and
5.16 ± 0.2 at 3 and 5 h of hypoxia exposure (for compari-
son, W/D was 5.42 ± 0.2 in the animals receiving saline
infusion).
Discussion
This study provides a contribution to the understanding
of the cellular response to interstitial lung edema, a con-
dition characterized by a relatively small increase in
extravascular water, but considerable changes in intersti-
tial space mechanics [2] and extracellular matrix composi-
tion [3]. particularly considering that recent findings led
to hypothesize a specific "sensing" function by lung cells
resulting from a perturbation in cell-matrix interaction
[6].
Plasma membrane composition
We found essentially no change in content of phospholi-
pid phosphorous after 3 or 5 h of hypoxia. This finding is
in line with the morphometric evaluation of lung cells in
the air-blood barrier of animals exposed to similar
hypoxic conditions indicating essentially minor changes
in overall surface area of plasma membranes after hypoxia
exposure, as also documented in isolated pulmonary
endothelial cells [17]. This finding is at variance with the
previous observation that phospholipid phosphorous was
found to increase in response to saline infusion, reflecting
in particular the increase in plasma membrane surface in
endothelial cells [6,10].
Furthermore, the changes in pattern of total plasma mem-
brane phospholipids differed in the two types of edema,
as in hypoxia PC decreased and PE increased, while in
saline induced edema they both increased [10].
PC is also an important component of surfactant phos-
pholipids and therefore its modifications may potentially
reflect changes in surfactant turnover. The increase in PE
may contribute to the modification in lipid microenviron-
ment surrounding plasma membrane channels whose
activity could monitor changes in cell-matrix interaction
[18,19].
We considered the plasmalogen production as this partic-
ular subset of phospholipids, by virtue of its ether bond,
acts as endogenous antioxidant protecting cells and mem-
brane from reactive oxygen species [20]. Plasmalogens
were found to increase, as much as in the case of the saline
induced edema [10]; this increase may buffer the decrease
in glutathione level in hypoxia [21]. In the latter case we
found no increase in lysophospholipids, suggesting no
activation of PLA
2
, a finding similar to that observed in
cultured endothelial cells exposed to 3% O
2
for 4 h [17].
The no activation of PLA
2
, stems for a relative preservation
of cellular integrity, considering that PLA
2
activation in
anoxia may lead to cellular death through a caspase inde-
pendent mechanism by inducing nuclear shrinkage [22].
In line, with these findings, we did not find a significant
increase of MDA, suggesting that the level of peroxidation
remained unchanged in both models of interstitial
edema.
Membrane fluidity and cell surface-volume regulation
The biochemical determination of fluidity of plasma
membrane is an estimate of its deformability that reflects
its composition and the mobility of the lipid bilayer.
Plasma membrane is relatively rigid as it can stretch elas-
tically until the area increases up to 2–4%, beyond which
rupture occurs [23]. Deformability increases when the
phospholipids/cholesterol and PC/PE ratios increase. This
occurred in the cardiogenic edema, allowing an increase
in surface profile of endothelial cells [6], while opposite
changes are found following hypoxia exposure.
Data of Fig. 6 and 7 also suggest that surface area and cell
volume regulation are correlated and differently regulated
in the two edema models, likely reflecting the specificity
of cell-matrix mechanical interaction. Indeed, variations
in cell volume may represent a step in the signalling proc-
ess involving changes in the conductance of membrane
ion channels [18,19].
Lipid microdomains
Lipid microdomains include caveolae and lipid rafts that
represent specialized sites of the plasma membranes since
Relationship between caveolar density and endothelial cell volumeFigure 8
Relationship between caveolar density and endothe-
lial cell volume. Regression between number of plasmale-
mmal vescicles per unit volume of endothelial cells (Nv)
plotted vs the median values of endothelial cells volume in
control (ct), after 3 and 5 h of hypoxia and cardiogenic
edema.
Respiratory Research 2006, 7:7 />Page 12 of 14
(page number not for citation purposes)
they host some important proteins implicated in signal-
transduction [5,12]. We decided to monitor proteins that
are known markers of either caveolae or lipid rafts. For
caveolae we estimated the presence of cav-1, a structural
protein responsible for the flask-like shape, and AQP1, a
specialized protein channel found in endothelial cells for
water and small nonionic molecules. In the present inves-
tigation we only determined the total amount of marker
proteins, without determining their phosphorylated
form, that is known to influence their redistribution and
translocation from cytosol to membrane [24,25]. As spe-
cific marker of lipid rafts we considered CD55, a GPI-
Surface-volume relationships in endothelial and epithelial cellsFigure 7
Surface-volume relationships in endothelial and epithelial cells. Surface and Volume densities (Sv and Vv, respectively)
are presented for endothelial (A, B) and epithelial (C, D) cellular compartments. Panels A and C refer to control condition
(closed circles) and hypoxia exposure (open circles); the data for 3 and 5 hours of hypoxia were grouped together. Panels B
and D refer to control condition (closed circles) and to cardiogenic edema (open triangles). The continuous lines in panels A
and B correspond to the iso-surface conditions.
Respiratory Research 2006, 7:7 />Page 13 of 14
(page number not for citation purposes)
anchor proteins [26]. We also determined flotillin-1, a
membrane protein expressed both in lipid rafts and cave-
olae [27,28]. After 3 h of hypoxia exposure, the decrease
of cav-1 and AQP1 in DRF and their corresponding
increase in IDFs and HDFs (Fig. 3), suggests an inhibition
of the vesicle formation, as confirmed by the decrease in
caveolar density in endothelial cells of the air-blood bar-
rier (Fig. 8). These modifications are opposite to those
previously documented in cardiogenic edema where cave-
olar expression was increased [5].
In the cardiogenic edema model, an increase in lipid
microdomains was suggested by the increase in specific
lipid components (PE, cholesterol). In hypoxia induced
edema, where an inhibition of caveolae was found, the
quantity of these lipids remained unchanged in DRF;
therefore, this lends support to the hypothesis that these
lipids may be used for lipid rafts formation. This hypoth-
esis is strengthened by the observation that CD55 signifi-
cantly increased at 3 h of hypoxia. In fact, each lipid raft
can host a limited number of GPI- anchored protein [29],
given the large size of its head, compared to the relatively
small surface area of the lipid rafts. Therefore, an
increased number of these molecules can only be accom-
modated by a corresponding increased number of lipid
rafts. Since the total amount of flotillin-1 in DRF was
unchanged, this further supports the hypothesis of a trans-
location of this protein from caveolae to lipid rafts. The
inverse correlation between caveolin-1 and GPI-anchored
protein was described in mutant cells lines either deficient
in GPI biosynthesis or after overexpression of caveolin-1
[30].
A rearrangement of plasma membrane lipid microdo-
mains suggests a modification in the expression of signal
transduction proteins in response to the two edema mod-
els.
Lung cellular response to interstitial edema
The morphometric studies indicate that mostly endothe-
lial but not epithelial cells showed morphological
changes in response to either type of edema, therefore,
one may hypothesize that pulmonary interstitial edema
(extracellular volume increase not exceeding 5%) evokes
a response predominantly in endothelial cells as a result
of a perturbation induced in their microenvironment. In
both of our edema models, no alveolar flooding was
present.
Alveolar epithelial cells regulate the volume and electro-
lyte composition of the alveolar lining fluid through the
AQP5 and ENaC channels. For the level of hypoxia
induced, no changes in AQP5 were found by western blot-
ting (data not shown) and furthermore other data suggest
that in mild hypoxia no inhibition of ENaC channels was
found [31,32].
Conclusion
We suggest a differential response of lung endothelial cells
to cardiogenic and hypoxic pulmonary edema that reflect
different pathophysiological mechanisms. In fact, the dif-
ference in the sequence of matrix macromolecules frag-
mentation [7] in the two models, might induce a specific
cascade of cellular events from signalling – transduction
to cellular functional attitude aimed at tissue repair.
List of abbreviations
PGs: proteoglycans
PMC: plasma membrane fractions in control
PMH3 and PMH5: plasma membrane fractions at 3 and 5
h of hypoxia
DRF: Detergent Resistant Fraction
IDF: Intermediate Density Fraction
HDF: High Density Fraction
DBI: double bound index
MDA: malondialdehyde
DPH: 1, 6-diphenyl-1, 2, 5-hexatriene
PC: phosphatidylcholine
PE: phosphatidylethanolamine
PLA
2
: phospholipase A
2
Vv: cellular volume density
Stot: total cellularsurface area
Sv: cellularsurface density (surface area per unit volume,
µm
2
/µm
3
)
Sc: surface area of capillaries
N
v
: numerical density of plasmalemmal vesicles
PVs: plasmalemmal vesicles
W/D; fresh weight to dry weight tissue ratio
Publish with BioMed Central and every
scientist can read your work free of charge
"BioMed Central will be the most significant development for
disseminating the results of biomedical research in our lifetime."
Sir Paul Nurse, Cancer Research UK
Your research papers will be:
available free of charge to the entire biomedical community
peer reviewed and published immediately upon acceptance
cited in PubMed and archived on PubMed Central
yours — you keep the copyright
Submit your manuscript here:
/>BioMedcentral
Respiratory Research 2006, 7:7 />Page 14 of 14
(page number not for citation purposes)
Competing interests
The author(s) declare that they have no competing inter-
ests.
Authors' contributions
LB and EB performed the biochemical studies; RD per-
formed the morphometric studies; GM and PP conceived
the study, participated in design and coordination and
gave their contribution to write the manuscript.
Acknowledgements
This research was supported by Fondazione Banca del Monte di Lombardia.
References
1. Miserocchi G, Negrini D, Del Fabbro M, Venturoli D: Pulmonary
interstitial pressure in intact in-situ lung: transition to inter-
stitial edema. J Appl Physiol 1993, 74(3):1171-1177.
2. Miserocchi G, Negrini D, Passi A, De Luca G: Development of lung
edema: interstitial fluid dynamics and molecular structure.
News Physiol Sci 2001, 16:66-71.
3. Negrini D, Passi A, De Luca G, Miserocchi G: Matrix proteogly-
cans in development of pulmonary edema. In Proteoglycans in
lung disease Edited by: Garg HG, Roughley PJ, Hales CA. Marcel
Dekker, Inc; 2002.
4. Roberts CR, Weight TN, Hascall VCH: Proteoglycans. In The Lung:
Scientific Foundation Volume Chapt. 52. 2nd edition. Edited by: Crystal
RG, West JB, Barnes PJ, Weibel ER. Philadelphia, PA: Lippincott-
Raven; 1997:757-767.
5. Palestini P, Calvi C, Conforti E, Daffara R, Botto L, Miserocchi G:
Compositional changes in lipid microdomains of ABB
plasma membranes in pulmonary interstitial edema. J Appl
Physiol 2003, 95(4):1446-1452.
6. Daffara R, Botto L, Beretta E, Conforti E, Faini A, Palestini P, Miser-
occhi G: Endothelial cells as early sensors of pulmonary inter-
stitial edema. J Appl Physiol 2004, 97:1575-1583.
7. Miserocchi G, Passi A, Negrini D, Del Fabbro M, De Luca G: Pulmo-
nary interstitial pressure and tissue matrix structure in
acute hypoxia. Am J Physiol Lung Cell Mol Physiol 2001,
280:L881-L887.
8. Negrini D, Passi A, De Luca G, Miserocchi G: Pulmonary intersti-
tial pressure and proteoglycans during development of pul-
monary edema. Am J Physiol Heart Circ Physiol 1996,
270:H2000-H2007.
9. Barlett GR: Phosphorus assay in column chromatography. J
Biol Chem 1959, 234:466-468.
10. Palestini P, Calvi C, Conforti E, Botto L, Fenoglio C, Miserocchi G:
Composition, biophysical properties and morphometry of
plasma membranes in pulmonary interstitial edema. Am J
Physiol Lung Cell Mol Physiol 2002, 282:L1382-L1390.
11. Moore MK, Viselli SM: Staining and quantification of proteins
transferred to polyvinylidine fluoride membranes. Anal Bio-
chem 2000, 279:241-242.
12. Lisanti MP, Sherer PE, Vidugiriene J, Tang ZL, Hermanowski-Vosatka
A, Ya-Huei Tu, Cook RF, Sargiacomo M: Characterisation of cave-
olin rich membrane domains isolated from an endothelial
rich source: implications for human disease. J Cell Biol 1994,
126:111-126.
13. Conforti E, Fenoglio C, Bernocchi G, Bruschi O, Miserocchi G: Mor-
pho-functional analysis of lung tissue in mild interstitial
edema. Am J Physiol (Lung Cell Mol Physiol) 2002, 282:L766-L774.
14. Weibel ER: Stereological Methods. Practical Methods for Biological Mor-
phometry New York: Academic; 1979.
15. Howard CV, Reed MG: Unbiased Stereology: Three-dimensional meas-
urements in microscopy New York: Springer; 1998.
16. Gil J, Silage DA: Morphometry of pinocytotic PVs in the capil-
lary endothelium of rabbit lungs using automated equip-
ment. Circ Res 1980, 47:384-391.
17. Tretyakov AV, Farber HW: Endothelial cell phospholipid distri-
bution and phospholipases activity during acute and chronic
hypoxia. Am J Physiol 1993, 265:C770-C780.
18. Danthi S, Enyeart JA, Enyart JJ: Modulation of native TREK-1 and
Kv1.4 K
+
channels by polyunsaturated fatty acids and lyso-
phospholipids. J Membrane Biol 2003, 195:147-164.
19. Eggermont J, Trouet D, Carton I, Nilius B: Cellular function and
control of volume -regulated anion channels. Cell Biochem Bio-
phys 2001, 35:263-274.
20. Zoeller RA, Grazia TJ, La Camera P, Park J, Gaposchkin DP, Farber
HW: Increasing plasmalogen levels protects human endothe-
lial cells during hypoxia. Am J Physiol Heart Cir Physiol 2002,
283:H671-H679.
21. Mansfield KD, Simon MC, Keith B: Hypoxic reduction in cellular
glutathione levels requires mitochondrial reactive oxygen
species (mtROS). J Appl Physiol 2004, 97:1358-1366.
22. Shinzawa K, Tsujimoto Y: PLA
2
activity is required for nuclear
shrinkage in caspase-independent cell death. J Cell Biol 2003,
163:1219-1230.
23. Morris CE, Homann U: Cell surface area regulation and mem-
brane tension. J Membrane Biol 2001, 179:79-102.
24. Schlegel A, Arvan P, Lisanti MP: Caveolin-1 binding to endoplas-
mic reticulum membranes and entry into the regulated
secretory pathway are regulated by serine phosphorylation.
J Biol Chem 2001, 276:4398-4408.
25. Han Z, Patil RV: Protein kinase A-dependent phosphorylation
of Aquaporin-1. Biochem Biophys Res Com 2000, 273:328-332.
26. Legler DF, Doucey MA, Schneider P, Chapatte L, Bender FC, Bron C:
Differential insertion of GPI-anchored GFPs into lipid rafts of
live cells. FASEB J 2004. doi:10.1096/fj.03-1338fje
27. Chatenay-Rivauday C, Cakar ZP, Jeno P, Kuzmenko ES, Fiedler K:
Caveolae: biochemical analysis. Mol Biol Rep 2004, 31:67-84.
28. Gallegos AM, McIntosh AL, Atshaves BP, Schroeder F: Structure
and cholesterol domains dynamics of an enriched caveolae/
raft isolate. Biochem J 2004, 382:451-461.
29. Sharma P, Varma R, Sarasij RC, Ira , Gousset K, Krishnamoorthy G,
Rao M, Mayor S: Nanoscale organization of multiple GPI-
anchored proteins in living cell membranes. Cell 2004,
116:577-589.
30. Abrami L, Fivaz M, Kobayashi T, Kinoshita T, Parton RG, van der
Goot FG: Cross-talk between caveolae and glycosylphosphati-
dylinositol-rich domains. J Biol Chem 2001, 276:30729-30736.
31. Matthay MA, Folkesson HG, Clerici C: Lung epithelial fluid trans-
port and the resolution of pulmonary edema. Physiol Rev 2002,
82:569-600.
32. Wodopia R, Soo Ko H, Billian J, Wiesner R, Bärtsch P, Mairbäurl H:
Hypoxia decreases proteins involved in epithelial electrolyte
transport in A549 cells and rat lung. Am J Physiol (Lung Cell Mol
Physiol) 2000, 279:L1110-L1119.