Báo cáo sinh học: "A combinatorial optimization approach for diverse motif finding applications" pdf
Bạn đang xem bản rút gọn của tài liệu. Xem và tải ngay bản đầy đủ của tài liệu tại đây (359.84 KB, 13 trang )
BioMed Central
Page 1 of 13
(page number not for citation purposes)
Algorithms for Molecular Biology
Open Access
Research
A combinatorial optimization approach for diverse motif finding
applications
Elena Zaslavsky* and Mona Singh*
Address: Department of Computer Science & Lewis-Sigler Institute for Integrative Genomics, Princeton University, Princeton, NJ 08544, USA
Email: Elena Zaslavsky* - ; Mona Singh* -
* Corresponding authors
Abstract
Background: Discovering approximately repeated patterns, or motifs, in biological sequences is
an important and widely-studied problem in computational molecular biology. Most frequently,
motif finding applications arise when identifying shared regulatory signals within DNA sequences or
shared functional and structural elements within protein sequences. Due to the diversity of
contexts in which motif finding is applied, several variations of the problem are commonly studied.
Results: We introduce a versatile combinatorial optimization framework for motif finding that
couples graph pruning techniques with a novel integer linear programming formulation. Our
approach is flexible and robust enough to model several variants of the motif finding problem,
including those incorporating substitution matrices and phylogenetic distances. Additionally, we
give an approach for determining statistical significance of uncovered motifs. In testing on numerous
DNA and protein datasets, we demonstrate that our approach typically identifies statistically
significant motifs corresponding to either known motifs or other motifs of high conservation.
Moreover, in most cases, our approach finds provably optimal solutions to the underlying
optimization problem.
Conclusion: Our results demonstrate that a combined graph theoretic and mathematical
programming approach can be the basis for effective and powerful techniques for diverse motif
finding applications.
Background
Motif discovery is the problem of finding approximately
repeated patterns in unaligned sequence data. It is impor-
tant in uncovering transcriptional networks, as short com-
mon subsequences in genomic data may correspond to a
regulatory protein's binding sites, and in protein function
identification, where short blocks of conserved amino
acids code for important structural or functional ele-
ments.
The biological problems addressed by motif finding are
complex and varied, and no single currently existing
method can solve them completely (e.g., see [1,2]). For
DNA sequences, motif finding is often applied to sets of
sequences from a single genome that have been identified
as possessing a common motif, either through DNA
microarray studies [3], ChIP-chip experiments [4] or pro-
tein binding microarrays [5]. An orthogonal approach,
which attempts to identify regulatory sites among a set of
orthologous genes across genomes of varying phyloge-
netic distance, is adopted by [6-10]. For protein
Published: 17 August 2006
Algorithms for Molecular Biology 2006, 1:13 doi:10.1186/1748-7188-1-13
Received: 02 July 2006
Accepted: 17 August 2006
This article is available from: />© 2006 Zaslavsky and Singh; licensee BioMed Central Ltd.
This is an Open Access article distributed under the terms of the Creative Commons Attribution License ( />),
which permits unrestricted use, distribution, and reproduction in any medium, provided the original work is properly cited.
Algorithms for Molecular Biology 2006, 1:13 />Page 2 of 13
(page number not for citation purposes)
sequences, and especially in the case of divergent
sequence motifs, it is particularly useful to incorporate
amino acid substitution matrices [11,12]. Often, motif
finding methods are either tailor-made to a specific vari-
ant of the motif finding problem, or perform very differ-
ently when presented with a diverse set of instances.
Numerous approaches to motif finding have been sug-
gested (e.g., [13-24], and those referenced in [1]). These
methods differ mainly in the choice of the motif represen-
tation, the objective function used for assessing the qual-
ity of a motif, and the search procedure used for finding
an optimal (or sub-optimal but reasonable) solution. Two
broad categories of motif finding algorithms can be iden-
tified [25]: stochastic-search methods based on the posi-
tion-specific scoring matrix (PSSM) representation and
combinatorial approaches based on variants of the con-
sensus sequence representation. Both categories come
with their own sets of scoring functions (e.g., see [25,26]),
and most variants of the motif finding problem are NP-
hard, including those optimizing either the average infor-
mation content score or the sum-of-pairs score [27]. The
performance of these two broad groups of methods seem
to be complementary in many cases, with a slight per-
formance advantage demonstrated by representative
methods of the combinatorial class (e.g., Weeder [24]), as
reported in a recent comprehensive study [1]. However,
many combinatorial methods enumerate every possible
pattern, and are thus limited in the length of the motifs
they can search for. While this may be less of an issue in
eukaryotic genomes, where transcriptional regulation is
mediated combinatorially with a large number of tran-
scription factors with relatively short binding sites, sub-
stantially longer motifs are found when considering either
DNA binding sites in prokaryotic genomes (e.g., for helix-
turn-helix binding domains of transcription factors) or
protein motifs [28,29].
Here, we introduce a combinatorial optimization frame-
work for motif finding that is flexible enough to model
several variants of the problem and is not limited by the
motif length. Underlying our approach, we consider motif
discovery as the problem of finding the best gapless local
multiple sequence alignment using the sum-of-pairs (SP)
scoring scheme. The SP-score is one of many reasonable
schemes for assessing motif conservation [30,31]. In the
case of motif search, where the goal is to use a set of
known motif instances and uncover additional instances,
the SP-score has been shown empirically to be compara-
ble to PSSM-based methods [32]. Additionally, unlike the
PSSM models, which typically assume independence of
motif positions, the SP-score can address the problem of
nucleotide or amino acid dependencies in a natural way.
This is an important consideration; for example in the
case of nucleotides, it has been shown that there are inter-
dependent effects between bases [33,34]. Moreover, mod-
eling these dependencies using the SP-score leads to
improved performance in representing and searching for
binding sites; a similar statistically significant improve-
ment is not observed when extending PSSMs to incorpo-
rate pairwise dependencies [32]. The SP-score was most
recently utilized in the context of motif finding in MaMF
[13].
In this paper, we use the SP-score and recast the motif
finding problem as that of finding a maximum (or mini-
mum) weight clique in a multi-partite graph, and intro-
duce a two-pronged approach, based on graph pruning
and mathematical programming, to solve it. In particular,
we first formulate the problem as an integer linear pro-
gram (ILP) and then consider its linear programming
relaxation. In practice, the linear programs (LPs) arising
from motif finding applications can be prohibitively
large, numbering in the millions of variables. Thus, to
reduce the size of the LPs, we develop a number of new
pruning techniques, building upon the ideas of [35,36].
These fall into the broad category of dead-end elimination
(DEE) algorithms (e.g., [37]), where sequence positions
that are incompatible with the optimal alignment are dis-
carded. In practice, such methods are very effective in
reducing problem size; to handle the rare cases where the
DEE techniques do not sufficiently prune the problem
instance, we also develop a heuristic iterative scheme to
eliminate sequence positions. The reduced linear pro-
grams are then solved by the ILOG CPLEX LP solver, and
in cases where fractional solutions are found, an ILP
solver is applied.
Given a motif discovered by any method, it is important
to be able to assess its statistical significance, as even opti-
mal solutions for their respective objective functions may
result in very poor motifs. We demonstrate how to test the
statistical significance of the motifs discovered via the
graph pruning/mathematical programming approach by
using the background frequencies for each base or amino
acid and computing the motif scores' probability distribu-
tion [38]. We then assess the number of motifs of the
same or better quality that are expected to occur in the
data at random. In the few cases where the heuristic DEE
procedure is applied, we are able to give a lower bound on
the significance value of the optimal solution; this allows
us to evaluate how much better an alternate undiscovered
motif might be.
We test our coupled mathematical programming and
pruning approach, LP/DEE, in diverse settings. First, we
consider the problem of finding shared motifs in protein
sequences. Unlike commonly-used PSSM-based methods
for motif finding (e.g., [15,18]), our combinatorial for-
mulation naturally incorporates amino acid substitution
Algorithms for Molecular Biology 2006, 1:13 />Page 3 of 13
(page number not for citation purposes)
matrices. For all tested datasets, we find the actual protein
motifs exactly, and these motifs correspond to optimal
solutions according to the SP scoring scheme. Second, we
consider sets of genes known to be regulated by the same
E. coli transcription factor, and apply our approach to find
the corresponding binding sites in genomic sequence
data. We compare our results with those of three popular
methods [18,22,39], and show that our method is often
able to better locate the actual binding sites. Using the
same dataset, we also embed E. coli binding sites within
sequences of increasingly biased composition, and show
that our scoring scheme and motif finding procedure is
effective in this scenario as well. Third, we consider the
phylogenetic footprinting problem [9], and find shared
motifs upstream of orthologous genes. The difficulty of
this problem lies in that the sequences may not have had
enough evolutionary time to diverge and may share
sequence level similarity beyond the functionally impor-
tant site; incorporation of additional information, in the
form of weightings obtained from a phylogenetic tree
relating the species, proves useful in this context. Finally,
we demonstrate in the context of phylogenetic footprint-
ing that our formulation can be used to find multiple
solutions, corresponding to several distinct motifs. In all
scenarios, we test the uncovered motifs for statistical sig-
nificance. We show that our method works well in prac-
tice, typically recovering statistically significant motifs
that correspond to either known motifs or other motifs of
high conservation.
Interestingly, the vast majority of motif finding instances
considered are not only effectively pruned by the optimal-
ity-preserving DEE methods, but also lead to linear pro-
grams whose optimal solutions are integral. These two
conditions together guarantee optimality of the final solu-
tion for the original SP-based motif finding problem. This
is interesting, since the motif finding formulation is
known to be NP-hard [27], and nevertheless our approach
runs in polynomial time for many practical instances of
the problem. Overall, the ability of our LP/DEE method to
find optimal solutions to large problems demonstrates
the power of the computational search procedures, and its
performance in uncovering known motifs illustrates its
utility for novel sequence motif discovery.
Methods
Broad problem formulation
Motif discovery is modeled here as the problem of finding
an ungapped local multiple sequence alignment (MSA) of
fixed length with the best sum-of-pairs (SP) score. That is,
given N sequences {S
1
, , S
N
} and a block length param-
eter l, the goal is to find an l-long subsequence from each
input sequence so that the total similarity among selected
blocks is maximized. More formally, let refer to the l-
long subsequence in sequence S
i
beginning in position k
and let sim(x, y) denote a similarity score between the l-
long subsequences x, y. The objective is then to find the set
of positions {k
1
, , k
N
} in each sequence, such that the
SP-score ∑
i<j
sim ( , ) is maximized.
This problem can be formulated in graph-theoretic terms
[40]. Let G be an undirected N-partite graph with node set
V
1
∪ ∪ V
N
, where V
i
includes a node u for each l-long
subsequence in the i-th sequence. Note that the subse-
quences corresponding to two consecutive vertices over-
lap in l - 1 positions, and that the V
i
's may have varying
sizes. Each pair of nodes u ∈ V
i
and v ∈ V
j
(i ≠ j), corre-
sponding to subsequences and in S
i
and S
j
respec-
tively, is joined by an edge with weight of w
uv
= sim (,
). By this construction G is a complete N-partite graph.
The MSA is achieved by picking the highest weight N-par-
tite clique in graph G.
Similarity between l-long subsequences can be defined
using a simple scoring scheme, such as counting up the
number of matching bases or amino acids when the sub-
sequences are aligned. However, for DNA sequences, the
background distribution of the input sequence can vary
substantially, and in order to reward matches of more
infrequent bases, instead of using 1 for a match, we assign
a score of log(1/f(b)) for a base b pairing, where f(b) is the
zero-corrected frequency of base b in the background, and
0 for any mismatch. (We also experimented with a scheme
that assigns a score of 1/f(b) for a base b match; both
methods perform similarly). In practice, we work with
integral scores by scaling the floating point numbers to
the desired degree of accuracy and rounding (here, we use
the scale factor of 100). For protein sequences, on the
other hand, compositional bias is not as major an issue,
and instead, to better capture the relationships between
the amino acids, we score the similarity between two
amino acids using substitution matrices. This assigns
higher scores to more favorable substitutions and better
reflects shared biochemical properties of such pairings.
We experiment with both PAM [11] and BLOSUM [12]
matrix families.
Integer linear programming formulation
The motif finding problem can be formulated as an ILP as
follows. For a graph G = (V, E) corresponding to the motif
finding problem, where V = V
1
∪ ∪ V
N
and E = {(u, v):
u ∈ V
i
, v ∈ V
j
, i ≠ j}, we introduce a binary decision varia-
ble x
u
for every vertex u, and a binary decision variable y
uv
s
i
k
s
i
k
i
s
j
k
j
s
i
k
s
i
k
s
j
k
′
s
i
k
s
j
k
′
Algorithms for Molecular Biology 2006, 1:13 />Page 4 of 13
(page number not for citation purposes)
for every edge (u, v). Setting x
u
to 1 corresponds to select-
ing vertex u for the clique and thus choosing the sequence
position corresponding to u in the alignment. Edge varia-
ble y
uv
is set to 1 if both endpoints u and v are selected for
the clique. Then the following ILP solves the motif finding
problem formulated above:
The first set of constraints ensures that exactly one vertex
is picked from every graph part, corresponding to one
position being chosen from every input sequence. The sec-
ond set of constraints relates vertex variables to edge vari-
ables, allowing the objective function to be expressed in
terms of finding a maximum edge-weight clique. An edge
is chosen only if it connects two chosen vertices. This for-
mulation is similar to that used by us [41] in fixed-back-
bone protein design and homology modeling.
ILP itself is NP-hard, but replacing the integrality con-
straints on the x and y variables with 0 ≤ x
u
, y
uv
≤ 1 gives an
LP that can be solved in polynomial time. If the LP solu-
tion happens to be integral, it is guaranteed to be optimal
for the original ILP and motif finding problem. Non-inte-
gral solutions, on the other hand, are not feasible for the
ILP and do not translate to a selection of positions for the
MSA problem; in these cases, more computationally
intensive ILP solvers must be invoked.
Graph pruning techniques
In this section, we introduce a number of successively
more powerful optimality-preserving dead-end elimina-
tion (DEE) techniques for pruning graphs corresponding
to motif finding problems. The basic idea is to discard ver-
tices and/or edges that cannot possibly be part of the opti-
mal solution.
Basic clique-bounds DEE
The idea of our first pruning technique is as follows. Sup-
pose there exists a clique of weight C* in G. Then a vertex
u, whose participation in any possible clique in G reduces
the weight of that clique below C*, is incompatible with
the optimal alignment and can be safely eliminated (sim-
ilar to [36]).
For u ∈ V
i
define star(u) to be a selection of vertices from
every graph part other than V
i
. Let F
u
be the value induced
by the edge weights for a star(u) that form best pairwise
alignments with u:
If u were to participate in any clique in G, it cannot possi-
bly contribute more than F
u
to the weight of the clique.
Similarly, let be the value of the best possible star(u)
among all u ∈ V
i
:
is an upper bound on what any vertex in V
i
can con-
tribute to any alignment.
Now, if F
z
, the most a vertex z ∈ V
k
can contribute to a
clique, assuming the best possible contributions from all
other graph parts, is insufficient compared to the value C*
of an existing clique, i.e. if
z can be discarded. The clique value C* is used with a fac-
tor of 2 since two edges are accounted for between every
pair of graph parts in the above inequality.
In fact, the values of are further constrained by requir-
ing a connection to z when z is under consideration. That
is, when considering a node z ∈ V
k
to eliminate, and cal-
culating according to Equation 2 among all possible u
∈ V
i
, the F
u
of Equation 1 is instead computed as:
The value of C* can be computed from any "good" align-
ment. We use the weight of the clique imposed by the best
overall star.
Tighter constraints for clique-bounds DEE
For a vertex u ∈ V
i
and every other V
j
, an edge has to con-
nect u to some v ∈ V
j
in any alignment. When calculating
F
u
, we can constrain its value by considering three-way
alignments and requiring that the vertices in the best
star(u) chosen as neighbors of u in graph parts other than
V
j
are also good matches to v. Performing this computa-
tion for every pair of u, V
j
and considering every edge inci-
dent on u would be too costly. Therefore, we only
consider such three-way alignments for every vertex u ∈ V
i
Maximize
subject to
for c
wy
xjNnode
uv uv
uv E
u
uV
j
⋅
=≤≤
∈
∈
∑
∑
(,)
(11 oonstraints
for constraints
)
,\( )yx jNvVVedge
x
uv v
uV
j
j
=≤≤∈
∈
∑
1
uuuv
yuVuvE,{,} ,(,)∈∈∈01 for
Fw
u
vV
ji
uv
j
=
()
∈
≠
∑
max
1
F
i
∗
FF
i
uV
u
i
∗
∈
=
()
max
2
F
i
∗
FCF
zi
ik
<× −
()
∗∗
≠
∑
2
3
,
F
i
∗
F
i
∗
Fw w
uzu
vV
jik
uv
j
=+
()
∈
≠
∑
max
,
4
Algorithms for Molecular Biology 2006, 1:13 />Page 5 of 13
(page number not for citation purposes)
and the next part V
i+1
of the graph (with the last and first
parts paired). Essentially, this procedure shifts the empha-
sis onto edges, allowing better alignments and bounds,
and yet eliminates vertices by considering the best edge
incident on it.
For a given edge (u, v) with endpoints u ∈ V
i
and v ∈ V
i+1
we consider an adjacent double star with two centers at u
and v, and sharing all the endpoints x
j
in the other graph
parts, denoted as dstar(u, v); the weight of such a dstar(u,
v) is . Now consider a clique
{u
1
∈ V
1
, , u
N
∈ V
N
} of some value C*, and the sum of
its double stars:
This sum is equal to 4C*, as each edge (u
i
, u
j
) is counted
four times. We define F
uv
with for an edge (u, v) with end-
points u ∈ V
i
and v ∈ V
i+1
as
F
uv
can be viewed as the weight of the best dstar centered
at the pair of vertices u, v (or edge (u, v)) and it is the best
possible contribution to any alignment, if the edge (u, v)
was required to be a part of the alignment. We define F
u
for u ∈ V
i
and for part i similarly to the above defini-
tions as
F
u
is the value of the best dstar centered on vertex u ∈ V
i
and some vertex v ∈ V
i+1
, and is the value of the best
dstar centered on any pair of vertices u ∈ V
i
and v ∈ V
i+1
.
For any clique {u
1
∈ V
1
, , u
N
∈ V
N
} of value C* in the
graph, by Equations 5–8 we have
Then Equation 3, with 2C* replaced by 4C*, can be used
to eliminate vertices in the same way as before, eliminat-
ing a vertex z in a particular graph part if F
z
, the value of
its best adjacent dstar, is insufficient considering best pos-
sible contributions from all other graph parts. For best
pruning results the value of C* should be as high as pos-
sible; we choose C* as the clique weight induced by the
best overall dstar.
Graph decomposition
We also use a divide-and-conquer graph decomposition
approach for pruning vertices. For every graph part i and
vertex u ∈ V
i
we consider induced subgraphs G
u
= (V
u
, E
u
)
in turn, where V
u
= u ∪ V\V
i
. Application of the clique-
bounds DEE technique to graphs G
u
is very effective since
one of the graph parts, contains only one vertex, u,
and all the F and F* values that need to be recomputed for
the new graph G
u
are greatly constrained. The process of
updating the F and F* values is efficient as the changes are
localized to one part in the graph. Importantly, the best
known clique value C* remains intact, since the clique of
that larger value exists in the original graph and can be
used for the decomposed one, helping to eliminate verti-
ces. For some of the vertices u, iterative application of the
DEE criterion and re-computation of the F and F* values
causes G
u
to become disconnected, implying that vertex u
cannot be part of the optimal alignment. Such a vertex u
is marked for deletion, and that information is propa-
gated to all subsequently considered induced subgraphs,
further constraining the corresponding F and F* values
and helping to eliminate other vertices in turn.
Statistical significance
Once we have found a motif of a particular SP-score, we
evaluate its statistical significance by calculating the
number of motifs of equal or better quality expected to
occur in random data with the same characteristics. Let
the score of the motif of length l in question be denoted
by s, and let f(b) be the zero-corrected background fre-
quency of nucleotide (or residue) b in the input
sequences, and sim(b
1
, b
2
) be the integral score computed
for all residue pairs as above. We compute P
l
(X), the prob-
ability distribution of scores for a motif of length l in N
sequences, in the first two steps of the following, and infer
the e-value of score s in the last two:
1. Calculate the exact probability distribution P
1
(X) for a
single column of N random residues. We use the multino-
mial distribution to compute the probability of observing
every combination of bases (or residues) in the column
according to the background distribution, and calculate
the corresponding SP-score for the column. We then add
2
1
www
uv ux vx
ji
ji
jj
++
≠
≠+
∑
()
(())22
5
11
1
11
www w
uu uu uu
ji
ji
i
N
uu
jii
N
ii ji ji ji++
++=
(
≠
≠+
=≠=
∑∑∑∑
))
Fw ww
uv uv
xV
ji
ji
xu xv
j
=+ +
()
∈
≠
≠+
∑
2
6
1
max( )
F
i
∗
FF
u
vV
uv
i
=
()
∈
+
max
1
7
FF
i
uV
u
i
∗
∈
=
()
max
8
F
i
∗
4
9
1
111
CF F F
uu
iN
u
iN
i
iN
ii i
∗
==
∗
=
≤≤≤
()
+
∑∑∑
G
i
u
Algorithms for Molecular Biology 2006, 1:13 />Page 6 of 13
(page number not for citation purposes)
probabilities for the same scores resulting from different
base combinations. To make the computation feasible for
the protein alphabet and for large numbers of sequences,
we calculate the scores and probabilities in such an order
that every new score and probability is computable from
the previous one by a local update operation.
2. Calculate the probability distribution P
l
(X) for l ran-
dom columns by convolution of P
1
(X)as in [38], where
we inductively construct a distribution for i columns
based on the distribution for i - 1 columns, P
i-1
(X), and
the single column distribution P
1
(X).
3. For a given score s of interest, we calculate the probabil-
ity that an l-long pattern has score greater than or equal to
s by chance alone. This probability is ∑
x>=s
P
l
(x).
4. Finally, we compute the total number of possible
motifs of length l in the data. If the sequences have lengths
L
1
, , L
N
, then the search space size L = ∏
i
(L
i
- l + 1). The
expected number of alignments with score at least s by
chance alone, or the e-value, is equal to L* ∑
x>=s
P
l
(x).
Overview of approach
Our basic LP/DEE approach is to: (1) formulate an
instance of motif finding as a graph problem (2) apply the
DEE techniques described above in the order of increasing
complexity so as to prune the graph (3) use mathematical
programming to find a solution to the smaller graph
problem and (4) evaluate statistical significance.
While applying DEE, if the size of the graph becomes
small enough (set at 800 vertices for the described experi-
ments), we submit the appropriate LP to the CPLEX LP
solver and, if necessary, to the ILP solver. To reduce the
graph to that necessary small size, we apply the DEE vari-
ants, running each one of them until either the specified
graph size has been reached, or to convergence so that no
further pruning is possible. In particular, we first attempt
to prune the graph using basic clique-bounds DEE, then we
consider tighter bound computations, and lastly we
employ graph decomposition in conjunction with the DEE
methods.
In rare cases the optimality-preserving DEE procedures are
unable to prune the graph, and we perform what we call
speculative pruning using higher C* values, which do not
necessarily correspond to known cliques in graph G. Three
outcomes of such pruning are possible: (i) The graph is
eliminated completely. This guarantees that a clique of
value C* does not exist in G. (ii) The pruning proves once
again insufficient to reduce the graph. (iii) The pruning
procedure converges to a small graph. We search the space
of possible C* values until we find one that produces out-
come (iii). To identify such a value we first translate the
possible clique scores into their corresponding e-values,
and then perform binary search on the e-value exponent.
This method converges quickly, typically locating an
appropriate C* in fewer than 10 iterations. If the optimal
solution for the final reduced graph is better than the C*
used in pruning, then it is also optimal for the original
graph. Otherwise, the e-value corresponding to C* pro-
vides us with a lower bound on the significance of the
actual optimal solution.
Extensions for other motif finding frameworks
Phylogenetic footprinting
An increasingly common way of finding regulatory sites is
to look for them among upstream regions of a set of
orthologous genes across species (e.g., [9]). In this case
additional data, in the form of the phylogenetic tree relat-
ing the species, is available and can be exploited. This is
especially important when closely related species are part
of the input, and, unweighted, they contribute duplicate
information and skew the alignment. We use a phyloge-
netic tree and branch lengths when calculating the edge
weights in the graph, with highly diverged sequence pairs
getting larger weights. The precise weighting scheme fol-
lows the ideas of weighted progressive alignment [42], in
which weights
α
i
are computed for every sequence i. The
calculation sums branch lengths along the path from the
tree root to the sequence at the leaf, splitting shared
branches among the descendant leaves, and thereby
reducing the weight for related sequences. In essence, we
solve a multiple sequence alignment problem with
weighted SP-score using match/mismatch, where the
computed weight for a pair of positions in sequences i and
j is multiplied by
α
i
×
α
j
. The rest of the algorithm operates
as in the basic motif finding case above, employing the
same LP formulation and DEE techniques.
Subtle motifs
Another widely studied formulation of motif finding is
the 'subtle' motifs formulation [17], in which an
unknown pattern of a length l is implanted with d modi-
fications into each of the input sequences. The graph ver-
sion of the problem remains the same except that edges
only exist between two vertices that correspond to subse-
quences whose Hamming distance is at most 2d (since
otherwise they cannot both be implanted instances of the
same pattern). Edges can either be unweighted, or
weighted by the number of mismatches between the cor-
responding subsequences. Either is easily modeled via
slight modification of the ILP given earlier (with variables
corresponding to non-existent edges removed, and sum-
mations in the edge constraints taken only over existing
edges), and the resulting ILP can be used in conjunction
with the numerous graph pruning techniques previously
developed for this problem (e.g. [17]).
Algorithms for Molecular Biology 2006, 1:13 />Page 7 of 13
(page number not for citation purposes)
Multiple motifs
Here we give extensions to address the issue of multiple
motifs existing in a set of sequences. Discovery of distinct
multiple motifs, such as sets of binding sites for two dif-
ferent transcription factors, can be done iteratively by first
locating a single optimal motif, masking it out from the
problem instance, and then looking for the next one. We
mask the previous motif by deleting its solution vertices
from the original graph, and then reapplying the LP/DEE
techniques to locate the next optimal solution and its cor-
responding motif.
To identify multiple occurrences of a motif in some of the
input sequences, it is possible to iteratively solve several
ILPs in order to find multiple near-optimal solutions, cor-
responding to the best cliques of successively decreasing
total weights. At iteration t, we add t - 1 constraints to the
ILP formulation so as to exclude all previously discovered
solutions:
where S
k
contains the optimal set of vertices found in iter-
ation k. This requires that the new solution differs from all
previous ones in at least one graph part. We note that to
use this type of constraint for the basic formulation of the
motif finding problem, the DEE methods given above
have to be modified so as not to eliminate nodes taking
part in near-optimal but not necessarily optimal solu-
tions. For the subtle motifs problem, existing DEE meth-
ods (e.g., [17]) only eliminate nodes and edges based on
whether they can take part in any clique in the graph, and
thus constraint 10 can be immediately applied to itera-
tively find cliques of successively decreasing weight.
Experimental results
We apply our LP/DEE approach to several motif finding
problems. We attempt to discover motifs in instances aris-
ing from both DNA and protein sequence data, and com-
pare them with known motifs and those found by other
motif finding methods. We then consider the phyloge-
netic footprinting problem, and demonstrate the discov-
ery of multiple motifs.
Protein motif finding
We study the performance of LP/DEE on a number of pro-
tein datasets with different characteristics (summarized in
Table 1). The datasets are constructed from SwissProt
[29], using the descriptions of [15] for the first two data-
sets, [36] for the next two, and [43] for the last one. These
datasets are highly variable in the number and length of
their protein sequences, as well as in the degree of motif
conservation. The motif length parameters are set based
on the lengths described by the above authors, and the
BLOSUM62 substitution matrix is used for all reported
results.
For each of the test protein datasets, our approach uncov-
ers the optimal solution according to the SP-measure.
These discovered motifs correspond to those reported by
[15,36,43], and their SP-scores are highly significant, with
e-values less than 10
-15
for all of them. As described by
[15], the HTH dataset is very diverse, and the detection of
the motif is a difficult task. Nonetheless, our HTH motif is
identical to that of [15], and agrees with the known anno-
tations in every sequence. We likewise find the lipocalin
motif; it is a weak motif with few generally conserved res-
idues that is in perfect correspondence with the known
lipocalin signature. We also precisely recover the immu-
noglobulin fold, TNF and zinc metallopeptidase motifs.
The protein datasets demonstrate the strength of our
graph pruning techniques. The five datasets are of varying
difficulty to solve, with some employing the basic clique-
bounds DEE technique to prune the graphs, while others
requiring more elaborate pruning that is constrained by
three-way alignments (see Table 1). In each case, the size
of the reduced graph is at least an order of magnitude
smaller. For three of the five datasets, the pruning proce-
dures alone are able to identify the underlying motifs.
In contrast to [36], who limit sequence lengths to 500, we
retain the original protein sequences, making the problem
more difficult computationally. For example, the average
sequence length in the zinc metallopeptidase dataset is
xN k t
u
uS
k
≤− = −
()
∈
∑
111
10
for , , ,
Table 1: Descriptions of protein datasets. # Seq. gives the number of input protein sequences. Length gives the length of the protein
motif searched for. |V| gives the number of vertices in the original graph constructed from the dataset. DEE gives the methods used to
prune the graph, and are denoted by (1) clique-bounds DEE, (2) tighter constrained bounds and (3) graph decomposition. |V
DEE
| is the
number of vertices in the graph after pruning. E-value lists the e-value of the motif found by the LP/DEE algorithm.
Dataset # Seq. Length |V| DEE |V
DEE
|E-value
Lipocalin 5 16 844 (1) 5 3.80 × 10
-16
Helix-Turn-Helix 30 20 6870 (1,2,3) 260 3.88 × 10
-67
Tumor Necrosis Factor 10 17 2329 (1) 10 1.50 × 10
-40
Zinc Metallopeptidase 10 12 7761 (1,2) 10 5.82 × 10
-23
Immunoglobulin Fold 18 10 7498 (1,2,3) 187 3.04 × 10
-24
Algorithms for Molecular Biology 2006, 1:13 />Page 8 of 13
(page number not for citation purposes)
approximately 800, and some sequences are as long as
1300 residues. The motif we recover is identical to the
motif reported by [36] in nine of ten sequences (see Addi-
tional Table 1); yet, with the difference in the last
sequence, the motif discovered by our method is superior
both in terms of sequence conservation and statistical sig-
nificance (with an e-value of 5.7729 × 10
-23
for us vs
1.12155 × 10
-21
for [36]).
Detecting bacterial regulatory elements
We apply our method to identify the binding sites of 36
E.coli regulatory proteins. We construct our dataset from
that of [6,28], as described in [32]. For each binding site,
we locate it within the genome and extract up to 600 bp
of DNA sequence upstream from the gene it regulates. We
remove binding sites for sigma factors, binding sites for
transcription factors with fewer than three known sites,
and those that could not be unambiguously located in the
genome. Motif length parameters are set as reported by
[28], except for crp, where a length of 18 instead of 22 is
used. Background nucleotide frequencies are computed
using the upstream regions for each dataset individually.
The final dataset consists of 36 transcription factors, each
regulating between 3 and 33 genes, with binding site
length ranging between 11 and 48 (see Table 2).
We evaluate the overlap between motif predictions made
by our approach and the known motifs using the nucle-
otide level performance coefficient (nPC) [1,17]. Let nTP,
nFP, nTN, nFN refer to nucleotide level true positives, false
positives, true negatives and false negatives respectively.
For example, nTP is the number of nucleotides in com-
mon between the known and predicted motifs. The nPC is
defined as nTP/(nTP + nFN + nFP); it is a stringent statistic,
penalizing a method for both failing to identify any nucle-
otide belonging to the motif as well as falsely predicting
any nucleotide not belonging to the motif. Though nPC
takes both false positives and false negatives at the nucle-
otide level into account, we also find it useful to consider
site level statistics. Following [1], we consider two sites to
be overlapping if they overlap by at least one-quarter the
length of the site. Defining site level statistics similarly to
the nucleotide level statistics above (e.g., site level true
positives, sTP, is the number of known sites overlapped by
predicted sites), site level sensitivity sSn is sTP/(sTP + sFN).
Motif finding in genomic data
We compare the performance of our method to three oth-
ers, MEME [18], Gibbs Motif Sampler [39], and Projection
[22]. We choose these particular methods as they are
widely-used, readily accessibly for download via the inter-
net, and can handle the lengths of motifs (11–48 bps) in
our dataset. While a recent performance evaluation of
motif finders [1] indicates that combinatorial methods
such as Weeder [24] have somewhat better performance
than other methods, most enumerative combinatorial
methods, Weeder included, are not able to handle the
lengths of the motifs in our bacterial dataset.
Two of the methods we compare against, MEME and
Gibbs Motif Sampler, are stochastic-search based algo-
rithms. We run them requiring one motif instance per
sequence and limiting the search to the primary sequence
strand only, while leaving other parameters at their
Table 2: Listing of the transcription factors' datasets (columns 1,
2, and 3) and the results of motif finding by LP/DEE. TF is the
transcription factor dataset. Seq is the number of input
sequences. Len is the length of the motif searched for. The rest of
the listed measures refer to the motifs discovered by the LP/DEE
algorithm: IC is the average per-column information content
[44]; RE is the average per-column relative entropy; E-value is
the e-value, computed according to our statistical significance
assessment; nPC is the nucleotide level performance coefficient;
and sSn is the site level sensitivity. The four starred entries
indicate potentially non-optimal solutions; entries marked with †
indicated usage of the ILP solver.
TF Seq Len IC RE E-value nPC sSn
ada 3 31 1.3000 1.0846 9.16 × 10
-1
0.1341 0.33
araC 4 48 1.1437 0.9940 1.15 × 10
-3
0.3474 0.50
arcA 11 15 1.2505 1.1992 4.31 × 10
-6
0.4224 0.73
argR 8 18 1.2990 1.2149 1.30 × 10
-7
0.2857 0.50
cpxR 7 15 1.3290 1.2337 1.09 × 10
-5
0.5556 0.71
crp*† 33 18 0.7196 0.7045 3.08 × 10
-9
0.5570 0.76
cytR 5 18 1.2317 1.1069 2.48 × 10
-1
0.0588 0.20
dnaA 6 15 1.4535 1.3300 6.12 × 10
-6
1.0000 1.00
fadR 5 17 1.3466 1.2074 1.33 × 10
-2
0.5455 0.80
fis* 8 35 0.8927 0.8376 1.37 × 10
-6
0.1966 0.38
flhCD 3 31 1.3942 1.1656 4.79 × 10
-3
0.0000 0.00
fnr 10 22 1.1025 1.0476 1.85 × 10
-9
0.6176 0.80
fruR 10 16 1.2094 1.1491 5.52 × 10
-8
0.8182 0.90
fur 7 18 1.3285 1.2332 1.28 × 10
-8
0.4237 0.71
galR 7 16 1.5445 1.4347 1.52 × 10
-16
0.5034 0.71
glpR 4 20 1.4227 1.2441 2.63 × 10
-2
0.5534 0.75
hns 5 11 1.5175 1.3660 2.25 0.0000 0.00
ihf* 19 48 0.3932 0.3859 2.26 × 10
+8
0.0381 0.16
lexA 17 20 1.1481 1.1192 1.01 × 10
-40
0.7215 0.88
lrp 4 25 1.2879 1.1237 6.44 × 10
-2
0.0989 0.25
malT 6 10 1.5071 1.3815 1.73 × 10
-1
0.0000 0.00
metJ 5 16 1.6842 1.5195 3.37 × 10
-12
0.6495 1.00
metR 6 15 1.3097 1.1970 6.57 × 10
-2
0.0000 0.00
modE 3 24 1.5618 1.3145 3.95 × 10
-4
1.0000 1.00
nagC 5 23 1.2795 1.1462 1.03 × 10
-3
0.0360 0.20
narL 10 16 1.1391 1.0828 8.06 × 10
-4
0.8182 0.90
narP 4 16 1.4534 1.2737 7.48 × 10
-4
0.0000 0.00
ntrC 4 17 1.6621 1.4605 1.28 × 10
-8
0.6386 1.00
ompR 4 20 1.3566 1.1860 4.27 × 10
-6
0.0000 0.00
oxyR 4 39 1.0965 0.9521 2.64 0.0796 0.25
phoB 8 22 1.1567 1.0835 4.14 × 10
-9
0.8051 1.00
purR 20 26 0.8305 0.8147 1.53 × 10
-37
0.7247 0.95
soxS*† 11 35 0.7771 0.7453 1.26 × 10
-9
0.0815 0.27
trpR 4 24 1.4069 1.2291 3.74 × 10
-6
0.8462 1.00
tus 5 23 1.5839 1.4276 1.05 × 10
-17
0.8400 1.00
tyrR 10 22 1.0693 1.0159 3.63 × 10
-9
0.5017 0.70
Algorithms for Molecular Biology 2006, 1:13 />Page 9 of 13
(page number not for citation purposes)
defaults. Gibbs Motif Sampler is run with 100 random
restarts to allow for sufficient sampling of the search
space, and MEME is allowed to execute its own algorithm
to search the dataset for good starting points for EM. Note
that Gibbs Motif Sampler failed to execute on three largest
datasets, crp, ihf and purr when run on our local linux
machines; these datasets were submitted through the web
server.
Projection method has a combinatorial component, com-
bining the idea of locality-sensitive hashing with post-
processing by MEME, and unlike most enumerative
combinatorial methods, Projection is not limited by motif
length. Since many of the motifs in our dataset are not
well conserved, we set the d parameter, assessing the aver-
age number of mismatches per motif instance, to it maxi-
mum suggested value of 0.25 of the motif length. Length
parameters of the known motif are used for each dataset.
We detail the performance of our algorithm on the full set
of binding sites for 36 E. coli transcription factors in Table
2. Considering a motif to have been correctly identified if
at least half of its sites were found with at least 25% over-
lap with the known site (as in [1], and essentially corre-
sponding to datasets with sSn of at least 0.5), our method
accurately discovers motifs for 22 transcription factors.
Setting an e-value threshold at 1.0 (a lower threshold
causes other methods to identify too few datasets as hav-
ing significant motifs), we find statistically significant
motifs for 33 datasets. Of the three transcription factor
datasets with no significant solutions, one, hns, is a short
motif, and the other two, oxyr and ihf, are very poorly con-
served motifs with low information content (IC) [44],
such that the average per-column IC for the known oxyr
and ihf motifs are 0.89 and 0.36, respectively, whereas
these values are 0.95 and 0.39 for their discovered motifs.
In general, as compared to the motifs corresponding to
the actual known transcription factor binding sites, the
motifs found by our method exhibit equal or higher IC,
measuring motif conservation in isolation from back-
ground sequence, as well as higher relative entropy, meas-
uring the difference with the background distribution
(Table 2).
MEME reports motifs for all 36 transcription factor data-
sets, with e-values less than 1.0 for 20 of them. Gibbs
Motif Sampler discovers motifs for 34 of the transcription
factors, with 15 of them considered significant via their
positive logMAP scores (no motifs are found for araC and
flhCD). Projection reports motifs with no significance
assessment for all 36 transcription factor datasets. The LP/
DEE approach described in this paper has the best overall
performance. Taking significance assessment into
account, and considering all datasets with no significant
motifs to have zero sSn and nPC values, our method pro-
duces 0.554 averaged sSn and 0.411 nPC values. Indeed,
only two datasets, oxyr and ihf, have motifs that are
deemed insignificant using our scheme yet have non-zero
overlap with the actual motifs. Performance statistics for
MEME and Gibbs Motif Sampler are considerably lower
with the averaged sSn of 0.338 and nPC of 0.257 for
Gibbs, and corresponding sSn and nPC values of 0.382
and 0.285 for MEME. Since Projection does not report sig-
nificance values, we also note averages of raw coefficients
for overlap with the known motifs while ignoring signifi-
cance assessments. Our method still outperforms the oth-
ers, though not as significantly, with sSn and nPC values
of 0.565 and 0.414 for LP/DEE; 0.550 and 0.402 for
Gibbs; 0.501 and 0.358 for MEME; 0.560 and 0.407 for
Projection.
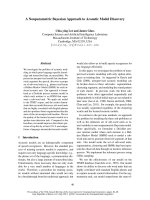
We also show sSn and nPC values while ignoring signifi-
cance for each of the three other methods compared to
LP/DEE in Figure 1, only displaying transcription factor
datasets for which a difference in performance is
observed. Each bar in the chart measures the difference in
sSn (Figures 1(a)–1(c)) or nPC (Figures 1(d)–1(f))
between our method and one of the other methods. Using
both the sSn and the nPC statistics, LP/DEE performs bet-
ter than any of the three other approaches in identifying
known binding sites. For example, for LP/DEE versus
MEME, very large differences are observed for three tran-
scription factors, with our method identifying narL, glpR,
and ntrC motifs almost completely, and MEME entirely
misidentifying them. Moreover, the LP/DEE method
exhibits better performance on more transcription factor
datasets than the other methods. For example, consider-
ing nPC, LP/DEE performs better than MEME on eleven
datasets, and worse than it on six datasets (Figure 1(e)).
Differences in performance with Gibbs Motif Sampler and
Projection are smaller; for instance, the LP/DEE method
exhibits better performance than Projection using the sSn
statistic on six datasets versus worse than it on two data-
sets (Figure 1(c)). We note that if significance assessments
are included and motifs with e-value greater than 1.0 are
discarded (see Additional Figures 1(a) and 1(b)), then LP/
DEE has better nPC than MEME on 16 datasets, and worse
nPC on three datasets, suggesting that MEME's signifi-
cance computation is unnecessarily conservative for our
dataset; the same applies to Gibbs Motif Sampler as well.
Our approach finds provably optimal solutions for 32 of
the 36 datasets. Notwithstanding, our method also exhib-
its excellent runtimes for most problems. Of the 36 tran-
scription factors we considered, 25 were solved in seconds
with the application of clique-bounds DEE, some using
tighter bounds constrained by three-way alignments.
Seven required the application of graph decomposition with
tighter clique-bounds DEE, and took a few minutes to three
hours to solve. For the remaining four datasets, we used
Algorithms for Molecular Biology 2006, 1:13 />Page 10 of 13
(page number not for citation purposes)
more computationally intensive speculative pruning.
Interestingly, we found highly significant solutions for
three of these datasets, albeit without the guarantee of
optimality, and no significant solution for one. For each
of them we provide a bound on the significance value of
a potential optimal solution according to the method
detailed in the section above. The e-values of the obtained
motif and the lower bound in parentheses are: crp, 3.08 ×
10
-9
(6.04 × 10
-33
); fis, 1.37 × 10
-6
(2.29 × 10
-7
); soxS, 1.26
× 10
-9
(5.25 × 10
-14
); and ihf, 2.26 × 10
+8
(3.98 × 10
-31
).
Finally, in the entire data collection, all but two of the
problems resulted in integral solutions to their LPs. The
remaining instances with fractional solutions were easily
solved by the ILP solver.
Simulated data
We also evaluate the effectiveness of our scoring scheme
in finding binding sites for five regulatory proteins when
they are embedded in simulated data. Our goals are two-
fold. First, since our underlying scoring measure is based
on counting matches between nucleotides, it is important
to see how well it performs in compositionally biased
backgrounds. In the E. coli dataset, even a simple scoring
scheme that assigns a score of 1 to matches and 0 to mis-
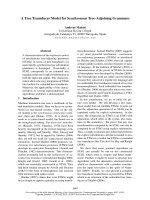
Performance comparison for the LP/DEE method with Gibbs Motif Sampler, MEME and ProjectionFigure 1
Performance comparison for the LP/DEE method with Gibbs Motif Sampler, MEME and Projection. Perform-
ance comparison of the LP/DEE method with Gibbs Motif Sampler, MEME, and Projection when identifying E. coli regulatory
sites. Performance is given in terms of the site level sensitivity 1(a)-1(c) and nucleotide performance coefficient 1(d)-1(f). Signif-
icance assessment is disregarded. For every transcription factor dataset, the height of the bar indicates the difference in the
metric, with bars above zero specifying better performance for LP/DEE and bars below zero otherwise. Plotted are only those
datasets for which there is a difference in performance between the pair of methods being compared.
sSn
−0.5
−0.4
−0.3
−0.2
−0.1
0
0.1
0.2
0.3
0.4
0.5
0.6
0.7
0.8
0.9
1
narL
glpR
ntrC
ada
phoB
soxS
purR
crp
ihf
lexA
fruR
araC
oxyR
(a)
Difference in sSn between LP/DEE
and MEME
−0.5
−0.4
−0.3
−0.2
−0.1
0
0.1
0.2
0.3
0.4
0.5
0.6
0.7
0.8
0.9
1
araC
ada
soxS
narL
purR
tyrR
crp
lexA
ihf
fis
(b)
Difference in sSn between
LP/DEE and Gibbs
−0.5
−0.4
−0.3
−0.2
−0.1
0
0.1
0.2
0.3
0.4
0.5
0.6
0.7
0.8
0.9
1
ada
cytR
soxS
narL
crp
purR
lexA
ihf
(c)
Difference in sSn between
LP/DEE and Projection
nPC
−0.3
−0.2
−0.1
0
0.1
0.2
0.3
0.4
0.5
0.6
0.7
0.8
0.9
1
narL
glpR
phoB
ntrC
ada
fis
arcA
soxS
purR
fnr
cytR
ihf
crp
lexA
araC
oxyR
fruR
(d)
Difference in nPC between LP/DEE
and MEME
−0.3
−0.2
−0.1
0
0.1
0.2
0.3
0.4
0.5
0.6
0.7
0.8
0.9
1
araC
narL
phoB
ada
purR
lrp
fur
soxS
oxyR
ihf
crp
arcA
cytR
lexA
fis
(e)
Difference in nPC between
LP/DEE and Gibbs
−0.3
−0.2
−0.1
0
0.1
0.2
0.3
0.4
0.5
0.6
0.7
0.8
0.9
1
narL
ada
crp
cytR
soxS
araC
purR
flhCD
oxyR
ihf
arcA
lexA
(f)
Difference in nPC between
LP/DEE and Projection
Algorithms for Molecular Biology 2006, 1:13 />Page 11 of 13
(page number not for citation purposes)
matches performs competitively (data not shown). How-
ever, since other genomes can have considerably more
biased nucleotide compositions, our scoring scheme
rewards matches between more rare nucleotides, and we
test here how it performs in different scenarios. Second,
while it is essential to test the performance of motif find-
ing algorithms on genomic data (as above), it is possible
that there are other conserved motifs in the data, besides
those with which we are evaluating performance, and
these conserved motifs lead to lower nPC and sSn meas-
urements. Simulated data is not expected to have other
conserved motifs, and thus provides a cleaner, though
perhaps optimistic, means for testing motif finding
approaches.
In our testing on simulated data, we use a selection of five
transcription factor datasets with motifs of varying levels
of conservation, as measured by their IC (Table 3). We
generate background sequences with uniform nucleotide
distributions, as well as those with increasingly biased
probability distributions. A background sequence for a
particular binding site is generated of length equal to that
of its upstream region (up to 600 bps). In particular, for
each position, a base is selected at random according to a
probability distribution in which base G is chosen with
some probability pr(G) and the other bases with probabil-
ity (1 - pr(G))/3 each.
Our nPC performance is summarized in Table 3 for vari-
ous background distributions. We find motifs of very high
nPC values in varying biased nucleotide composition,
attesting to the fact that our scoring scheme is successfully
able to correct for bias in sequence composition. Moreo-
ver, as expected, performance on simulated data is better
than that for actual genomic sequence. In the narP dataset,
for example, the motif is found perfectly in simulated data
and not at all in real genomic data. Additionally, an alter-
nate highly conserved site is found by all four methods in
genomic data (Table 2), suggesting that while the narP site
is well-conserved, the corresponding genomic sequences
contain another shared motif of higher conservation.
Phylogenetic footprinting
We also apply our approach to identify motifs among sets
of upstream regions of orthologous genes in a number of
genomes. Here, the relationships between genomes is
incorporated via weighting of the components of the SP-
score. The eight datasets come from [9]. All datasets con-
tain vertebrate sequences; some (Interleukin-3 and Insu-
lin datasets) consist of only mammalian genomes, while
others contain members from more diverse animal phyla.
The number of sequences in the datasets ranges between
4 and 16, and most sequences are shorter than 1000 resi-
dues in length.
We use the phylogenetic trees (topology and branch
lengths) given in [9] to derive the pairwise weights, and
use the motif lengths provided. For each of the eight data-
sets, our approach identifies the optimal motif using the
SP scoring measure (Table 4). The consensus sequences
for the discovered motifs are listed in Table 4 along with
the description of their DNA regions. (The motif reported
for the c-fos promoter dataset was discovered second, after
having discarded the poly-A repeat region.) All the motifs
we find have been documented in the TRANSFAC data-
base [45], and the majority of them correspond to those
that have been reported by [9]. Two motifs differ from
those of [9]: the first, a c-fos motif, shares its consensus
sequence with a known c-fos regulatory element, the bind-
ing site of the serum response factor (SRF) protein (acces-
sion number R02246). The second, a c-myc motif, also
corresponds to a known c-myc binding site in the P1 pro-
moter (accession number R04621). The e-values of the
found motifs range from 10
-18
to 10
-5
. We note that
though the notion of significance according to our
method merely rejects the hypothesis that all the motif
instances are unrelated, and a scheme that takes phylog-
eny into account such as [46] may be better suited for this
problem in general, our significance evaluation attests to
Table 3: Scoring method evaluation in terms of performance coefficient in biased-composition simulated data. Performance of LP/
DEE in biased-composition simulated data. The first column identifies the TF dataset. The second column measures the degree of
conservation of the known motif, as measured by average per-column information content [44]. The rest of the columns list the
nucleotide performance coefficient of the LP/DEE method with the probability of base G indicated in the column heading and the
frequencies of all other bases split equally.
TF IC Bias
0.25 0.5 0.75 0.9
araC 1.00041 0.8113 0.9592 0.9592 0.9592
cpxR 1.17034 1.0000 0.8261 0.9811 0.9811
dnaA 1.45351 1.0000 0.7647 0.7647 1.0000
galR 1.34756 0.8824 0.8824 1.0000 1.0000
narP 1.40273 1.0000 1.0000 1.0000 1.0000
Algorithms for Molecular Biology 2006, 1:13 />Page 12 of 13
(page number not for citation purposes)
the presence of a highly conserved motif instance in every
input sequence.
This dataset is also an excellent testing ground for finding
distinct multiple motifs using our method. We iteratively
identify motifs and remove their corresponding vertices
from the constructed graphs. As proof of principle, we
find multiple motifs for the insulin dataset. In this case,
we successfully identify all four motifs reported by [9].
Since our objective function differs from theirs and we
require motif occurrences in every input sequence, we
recover the motifs in a different order. Of course, we iden-
tify numerous shifts of these motifs in successive itera-
tions. In practice, therefore, it may be more beneficial to
remove a number of vertices corresponding to subse-
quences overlapping the optimal solution before attempt-
ing to find the next motif.
Conclusion
We have described a combined graph-theoretic and math-
ematical programming framework for the motif finding
problem that provides a flexible approach to tackle many
important issues in motif finding. We have successfully
applied it to a variety of problems, including discovering
statistically significant DNA and protein motifs, and have
been able to incorporate phylogenetic information in the
context of cross-species motif discovery. A major advan-
tage of our approach for motif finding is the ability to find
optimal solutions for many practical problems.
In related follow up work, we have shown how to improve
the ILP formulation in the case where there are only a
small number of distinct edge weights [47]; while this is
not the case with the similarity scores considered here, it
comes up in some applications (e.g., when considering
scores based on just the total number of exact base-pair or
amino acid matches). Further improvements and exten-
sions to the ILP formulation for motif finding may be pos-
sible – for example, by incorporating constraints that
model cooperative binding of transcription factors by
looking for motifs within some distance of one another.
While mathematical programming has not traditionally
been applied to the motif discovery problem, our work
demonstrates that it provides us a powerful alternative to
successfully tackle a diverse set of applications.
Additional material
Acknowledgements
The authors thank Stephen Altschul for help in assessing the statistical sig-
nificance of discovered motifs, and the anonymous referees for their helpful
suggestions. M.S. thanks the NSF for PECASE award MCB-0093399,
DARPA for award MDA972-00-1-0031 and NIH for award GM076275-01.
References
1. Tompa M, Li N, Bailey TL, Church G, De Moor B, Eskin E, Favorov
AV, Frith M, Fu Y, Kent WJ, Makeev VJ, Mironov AA, Noble WS,
Pavesi G, Pesole G, Regnier M, Simonis N, Sinha S, Thijs G, van Helden
J, Vandenbogaert M, Weng Z, Workman C, Ye C, Zhu Z: Assessing
computational tools for the discovery of transcription factor
binding sites. Nat Biotechnol 2005, 23(1):137-144.
2. Hu J, Li B, Kihara D: Limitations and potentials of current motif
discovery algorithms. Nucleic Acids Res 2005, 33(15):4899-4913.
Additional File 1
1. A table with the sequences for the human zinc metallopeptidase motif
as found by the LP/DEE method and [36]. 2. A figure describing perform-
ance comparison between the LP/DEE method and MEME when using a
significance threshold as reported by both methods.
Click here for file
[ />7188-1-13-S1.pdf]
Table 4: Motifs identified with use of phylogenetic information. Listing of motifs and details of their host sequences for phylogenetic
motif finding. All datasets tested are from [9]. DNA region details the DNA regions considered (PR signifies promoter region). # Seq.
gives the number of input sequences. Motif (id) identifies the consensus sequence of the discovered motif and its correspondence with
the motifs of [9] where applicable. All listed motifs have been documented as regulatory elements in TRANSFAC [45]. For datasets
other than the insulin dataset, only the best motif is reported and for the insulin dataset multiple motifs are reported in order of
discovery.
DNA region # Seq. Motif (id)
Growth-horm. 5' UTR + PR (380 bp) 16 TATAAAAA (7)
Histone H1 5' UTR + PR (650 bp) 4 AAACAAAAGT (2)
C-fos 5' UTR + PR (800 bp) 6 CCATATTAGG
C-fos first intron (376 to 758 bp) 7 AGGGATATTT (3)
Interleukin-3 5' UTR + PR (490 bp) 6 TGGAGGTTCC (3)
C-myc second intron (971 to 1376 bp) 6 TTTGCAGCTA (5)
C-myc 5' PR (1000 bp) 7 GCCCCTCCCG
Insulin family 5' PR (500 bp) 8 GCCATCTGCC (2)
TAAGACTCTA (1)
CTATAAAGCC (3)
CAGGGAAATG (4)
Algorithms for Molecular Biology 2006, 1:13 />Page 13 of 13
(page number not for citation purposes)
3. Tavazoie S, Hughes JD, Campbell MJ, Cho RJ, Church G: Systematic
determination of genetic network architecture. Nature Genet-
ics 1999, 22(3):281-285.
4. Lee T, Rinaldi N, Robert F, Odom D, Bar-Joseph Z, Gerber G, Han-
nett N, Harbison C, Thompson C, Simon I, Zeitlinger J, Jennings E,
Murray H, Gordon D, Ren B, Wyrick J, Tagne J, Volkert T, Fraenkel
E, Gifford D, Young R: Transcriptional regulatory networks in
Saccharomyces cerevisiae. Science 2002, 298(5594):799-804.
5. Mukherjee S, Berger M, Jona G, Wang X, Muzzey D, Snyder M, Young
R, Bulyk M: Rapid analysis of the DNA-binding specificities of
transcription factors with DNA microarrays. Nature Genetics
2004, 36(12):1331-1339.
6. McGuire A, Hughes J, Church G: Conservation of DNA regula-
tory motifs and discovery of new motifs in microbial
genomes. Genome Res 2000, 10(6):744-757.
7. Cliften P, Sundarsanam P, Desikan A, Fulton L, Fulton B, Majors J,
Waterston R, Cohen B, Johnston M: Finding functional features
in Saccharomyces genomes by phylogenetic footprinting.
Science 2003, 301(5629):71-76.
8. McCue L, Thompson W, Carmack C, Ryan M, Liu J, Derbyshire V,
Lawrence C: Phylogenetic footprinting of transcription factor
binding sites in proteobacterial genomes. Nucleic Acids Res
2001, 29(3):774-782.
9. Blanchette M, Tompa M: Discovery of regulatory elements by a
computational method for phylogenetic footprinting.
Genome Res 2002, 12:739-748.
10. Kellis M, Patterson N, Endrizzi M, Birren B, Lander E: Sequencing
and comparison of yeast species to identify genes and regu-
latory elements. Nature 2003, 423:241-254.
11. Dayhoff M, Schwartz R, Orcutt B: A model of evolutionary
change in proteins. In Atlas of Protein Sequence and Structure Volume
5. Issue 3 Edited by: Dayhoff M. Silver Spring, MD: National Biomedi-
cal Research Foundation; 1978:345-352.
12. Henikoff S, Henikoff J: Amino acid substitution matrices from
protein blocks. Proc Natl Acad Sci USA 1992, 89:10915-10919.
13. Hon LS, Jain AN:
A deterministic motif finding algorithm with
application to the human genome. Bioinformatics 2006,
22(9):1047-1054.
14. Lawrence C, Reilly A: An expectation maximization (EM) algo-
rithm for the identification and characterization of common
sites in unaligned biopolymer sequences. Proteins 1990,
7:41-51.
15. Lawrence C, Altschul S, Boguski M, Liu J, Neuwald A, Wootton J:
Detecting subtle sequence signals: a Gibbs sampling strategy
for multiple alignment. Science 1993, 262:208-214.
16. Liu X, Brutlag D, Liu J: BioProspector: discovering conserved
DNA motifs in upstream regulatory regions of co-expressed
genes. Pac Symp Biocomput 2001:127-138.
17. Pevzner P, Sze S: Combinatorial approaches to finding subtle
signals in DNA sequences. Proc Int Conf Intell Syst Mol Biol 2000,
8:269-278.
18. Bailey T, Elkan C: Unsupervised learning of multiple motifs in
biopolymers using expectation maximization. Machine Learn-
ing 1995, 21:51-80.
19. Hertz G, Stormo G: Identifying DNA and protein patterns with
statistically significant alignments of multiple sequences. Bio-
informatics 1999, 15:563-577.
20. Marsan L, Sagot MF: Algorithms for extracting structured
motifs using a suffix tree with an application to promoter
and regulatory site consensus identification. J Comput Biol
2000, 7:345-362.
21. Hughes J, Estep P, Tavazoie S, Church G: Computational identifi-
cation of cis-regulatory elements associated with groups of
functionally related genes in S. cerevisiae. J Mol Biol 2000,
296:1205-1214.
22. Buhler J, Tompa M: Finding motifs using random projections. J
Comput Biol 2002, 9(2):225-242.
23. Sinha S, Tompa M: A program for discovery of novel transcrip-
tion factor binding sites by statistical overrepresentation.
Nucleic Acids Res 2003,
31(13):3586-3588.
24. Pavesi G, Mereghetti P, Mauri G, Pesole G: Weeder Web: discov-
ery of transcription factor binding sites in a set of sequences
from co-regulated genes. Nucleic Acids Res 2004,
32:W199-W203.
25. Stormo GD: DNA binding sites: representation and discovery.
Bioinformatics 2000, 16:16-23.
26. Li N, Tompa M: Analysis of computational approaches for
motif discovery. Algorithms for Molecular Biology 2006, 1:8.
27. Akutsu T, Arimura H, Shimozono S: On approximation algo-
rithms for local multiple alignment. In Proceedings of the Fourth
Annual International Conference on Research in Computational Molecular
Biology ACM Press; 2000:1-7.
28. Robison K, McGuire AM, Church GM: A comprehensive library
of DNA-binding site matrices for 55 proteins applied to the
complete Escherichia coli K-12 Genome. J Mol Biol 1998,
284:241-254.
29. Boeckmann B, Bairoch A, Apweiler R, Blatter MC, Estreicher A,
Gasteiger E, Martin M, Michoud K, O'Donovan C, Phan I, Pilbout S,
Schneider M: The SWISS-PROT protein knowledgebase and
its supplement TrEMBL in 2003. Nucleic Acids Res 2003,
31:365-370.
30. Carillo H, Lipman D: The multiple sequence alignment prob-
lem in biology. SIAM Journal on Applied Math 1988, 48:1073-1082.
31. Schuler G, Altschul S, Lipman D: A workbench for multiple align-
ment construction and analysis. Proteins 1991, 9(3):180-190.
32. Osada R, Zaslavsky E, Singh M: Comparative analysis of methods
for representing and searching for transcription factor bind-
ing sites. Bioinformatics 2004, 20(18):3516-3525.
33. Man TK, Stormo GD: Non-independence of Mnt repressor-
operator interaction determined by a new quantitative mul-
tiple fluorescence relative affinity (QuMFRA) assay. Nucl Acids
Res 2001, 29:2471-2478.
34. Bulyk ML, Johnson PL, Church GM: Nucleotides of transcription
factor binding sites exert interdependent effects on the bind-
ing affinities of transcription factors.
Nucl Acids Res 2002,
30(5):1255-1261.
35. Gusfield D: Efficient methods for multiple sequence align-
ment with guaranteed error bounds. Bull Math Biol 1993,
55(1):141-154.
36. Lukashin A, Rosa J: Local multiple sequence alignment using
dead-end elimination. Bioinformatics 1999, 15:947-953.
37. Desmet J, De Maeyer M, Hazes B, Lasters I: The dead-end elimi-
nation theorem and its use in protein side-chain positioning.
Nature 1992, 356:539-542.
38. Tatusov R, Altschul S, Koonin E: Detection of Conserved Seg-
ments in Proteins: Iterative Scanning of Sequence Databases
With Alignment Blocks. Proc Natl Acad Sci USA 1994,
91:12091-12095.
39. Thompson W, Rouchka EC, Lawrence CE: Gibbs Recursive Sam-
pler: finding transcription factor binding sites. Nucleic Acids Res
2003, 31(13):3580-3585.
40. Vingron M, Pevzner P: Multiple sequence comparison and con-
sistency on multipartite graphs. Advances in Applied Mathematics
1995, 16:1-22.
41. Kingsford C, Chazelle B, Singh M: Solving and analyzing side-
chain positioning problems using linear and integer pro-
gramming. Bioinformatics 2005, 21(7):1028-1039.
42. Feng D, Doolittle RF: Progressive sequence alignment as a pre-
requisite to correct phylogenetic trees. J Mol Evol 1987,
25(4):351-360.
43. Neuwald A, Liu J, Lawrence C: Gibbs motif sampling: detection
of bacterial outer membrane protein repeats. Protein Sci 1995,
4(8):1618-32.
44. Schneider TD, Stormo CD, Gold L, Ehrenfeucht A: Information
content of binding sites on nucleotide sequences. J Mol Biol
1986, 188:415-431.
45. Wingender E, Dietze P, Karas H, Knüppel R: TRANSFAC: A data-
base on transcription factors and their DNA binding sites.
Nucleic Acids Res 1996, 24:238-241.
46. Prakash A, Tompa M: Statistics of local multiple alignments.
Bioinformatics 2005, 21:i344-i350.
47. Kingsford C, Zaslavsky E, Singh M: A compact mathematical pro-
gramming formulation for DNA motif finding. In Proceedings
of the Seventeenth Annual Symposium on Combinatorial Pattern Matching
(CPM), Barcelona, Spain Springer; 2006:233-245.