Báo cáo sinh học: "A scoring matrix approach to detecting miRNA target sites" ppt
Bạn đang xem bản rút gọn của tài liệu. Xem và tải ngay bản đầy đủ của tài liệu tại đây (290.91 KB, 9 trang )
BioMed Central
Page 1 of 9
(page number not for citation purposes)
Algorithms for Molecular Biology
Open Access
Research
A scoring matrix approach to detecting miRNA target sites
Simon Moxon, Vincent Moulton and Jan T Kim*
Address: School of Computing Sciences, University of East Anglia, Norwich, NR4 7TJ, UK
Email: Simon Moxon - ; Vincent Moulton - ; Jan T Kim* -
* Corresponding author
Abstract
Background: Experimental identification of microRNA (miRNA) targets is a difficult and time
consuming process. As a consequence several computational prediction methods have been
devised in order to predict targets for follow up experimental validation. Current computational
target prediction methods use only the miRNA sequence as input. With an increasing number of
experimentally validated targets becoming available, utilising this additional information in the
search for further targets may help to improve the specificity of computational methods for target
site prediction.
Results: We introduce a generic target prediction method, the Stacking Binding Matrix (SBM) that
uses both information about the miRNA as well as experimentally validated target sequences in the
search for candidate target sequences. We demonstrate the utility of our method by applying it to
both animal and plant data sets and compare it with miRanda, a commonly used target prediction
method.
Conclusion: We show that SBM can be applied to target prediction in both plants and animals and
performs well in terms of sensitivity and specificity. Open source code implementing the SBM
method, together with documentation and examples are freely available for download from the
address in the Availability and Requirements section.
Background
microRNAs (miRNAs) are small non-coding RNAs of
around 21 nt in length, which are currently receiving a
great deal of attention [1,2]. They are derived from a pre-
cursor RNA hairpin structure by RNAse III-like enzymes
[3], and are incorporated into the RNA induced silencing
complex (RISC). Via this complex, the microRNA guides
either the cleavage or translational repression of messen-
ger RNAs (mRNAs) by binding to a region of the mRNA
known as the target site [4]. In this way, miRNAs regulate
a variety of cellular and molecular functions [5,6], playing
important roles in, for example, organism growth and
development [7,8].
New miRNAs are being discovered at an increasingly rapid
rate [9]. Since they play an important role in eukaryotic
gene regulation, the problem of determining their func-
tion is thus of utmost importance. Accordingly, several
computational methods have been developed for miRNA
target prediction – see e.g. [10-13]. These methods usually
rely on finding target sequences based on a single miRNA
input, and employ nucleotide complementarity and min-
imum free energy (MFE) calculations to identify candi-
date miRNA/target duplexes. Although these methods
have been successfully used in target prediction e.g. [14],
their specificity can be limited, i.e. they may produce
many false positives [15].
Published: 31 March 2008
Algorithms for Molecular Biology 2008, 3:3 doi:10.1186/1748-7188-3-3
Received: 5 October 2007
Accepted: 31 March 2008
This article is available from: />© 2008 Moxon et al; licensee BioMed Central Ltd.
This is an Open Access article distributed under the terms of the Creative Commons Attribution License ( />),
which permits unrestricted use, distribution, and reproduction in any medium, provided the original work is properly cited.
Algorithms for Molecular Biology 2008, 3:3 />Page 2 of 9
(page number not for citation purposes)
Various methods have been proposed to improve the spe-
cificity of miRNA target prediction methods. For example,
comparative genomics has been used to focus on sites that
are conserved between species [14]. Here we concentrate
on an alternative approach, the Stacking Binding Matrix
(SBM), in which we can incorporate all of the known tar-
gets for a given miRNA (in general a miRNA may target
several sites) into a search for additional targets. The
number of experimentally validated miRNA targets is
steadily growing, and as this number increases so too
should the usefulness of the SBM method.
Our approach is an adaptation of the binding matrix (BM)
technique for transcription factor binding site classifica-
tion [16], a method that was designed to systematically
maximise specificity in searches for transcription factor
binding sites. In contrast to computation of the BM,
which uses single nucleotide information and results in a
4 × l matrix for scoring words of length l, the SBM is a 16
× (l - 1) matrix based on dinucleotides (i.e. consecutive
pairs of nucleotides). In this way, it is possible to incorpo-
rate the fundamental principle of RNA stacking energies
[17] which is commonly used in miRNA detection.
Methods
In brief, the SBM is computed from a multiple sequence
alignment consisting of the reverse complement of the
miRNA in question together with any known target
sequences. The resulting matrix (or set of matrices in case
the alignment contains gaps) is then used to scan and
score a set of potential target sequences. Sequences having
a score exceeding a user-defined threshold are returned as
potential targets.
Scoring matrices and the Binding Matrix
A scoring matrix for nucleotide words of length l is an {A,
C, G, U} × l matrix M = (m
bk
). Given a word w = w[1] w[2]
w[l] in the alphabet {A, C, G, U} its score S(w) is the
sum of the matrix elements "selected" by the symbols in
the word, that is,
Given a threshold S
min
, a word w is classified as a binding
word if S(w) ≥ S
min
and otherwise it is classified as a non-
binding word. Generally, the threshold can be used to
adjust sensitivity and specificity of classification: Assum-
ing a positive correlation between density of true positives
and score, lowering the threshold increases sensitivity and
decreases specificity. Also, notice that for any
λ
> 0, scor-
ing a word with the matrix
λ
M and using the threshold
λ
S
min
results in the same classification. A matrix classifier is
called consistent with a set B = {b
1
, , b
N
}, of known bind-
ing words if it classifies them all correctly [18], i.e. if S(b)
≥ S
min
for all b ∈ B. There are various ways of constructing
a scoring matrix from a set of binding words [19]. The
Binding Matrix (BM) is defined to be the matrix for which
the number of words classified as binding words is mini-
mal, under the condition that it is consistent. A method
for computing the BM and a discussion of its properties is
given in [16].
Incorporating stacking into binding matrix computations
A key feature in RNA structure prediction is the incorpora-
tion of stacking energies [17]. So as to capture informa-
tion from both nucleotide complementarity and base pair
stacking energies, in the computation of the SBM we score
dinucleotides. Formally, for nucleotide words of length l,
SBM is a {A, C, G, U}
2
× (l - 1) matrix. It is computed by
first converting each word w into the sequence w[1]w[2],
w[2]w[3], , w[l - 1]w[l] of dinucleotides in {A, C, G, U}
2
and then optimising as with the BM. For performance rea-
sons, to compute the SBM we use the optimisation
approach described in [20] rather than the quadratic pro-
gramming technique used in [16]. All SBMs are scaled so
that a threshold of 1 corresponds to the most specific con-
sistent classifier.
Note that in contrast to transcription factors, where only
binding site sequences (binding words) are available, the
reverse complement of the miRNA sequence itself pro-
vides information about the accepted target site
sequences. Thus we include the reverse complement of the
miRNA within the alignment of the known target sites.
Incorporating gaps
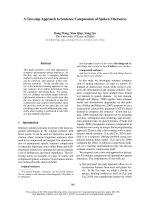
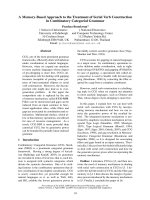
The complementarity of a miRNA binding to a target site
is usually imperfect and commonly involves bulges (see
Figure 1), which results in gapped alignments.
However, in common with scoring matrix-based classifi-
cation approaches, the SBM cannot accommodate gaps
directly. To address this, we employ a set of SBMs rather
than a single SBM.
For N = {A, C, G, U}, let A = {S
1
, S
2
, , S
n
} denote an
alignment consisting of (possibly) gapped sequences over
N of length l. Denote the gap character by -, and let s
i,j
be
the j-th symbol of S
i
. Suppose that D ⊆ {1, 2, , l}. Given
a sequence S
i
∈ A, let denote the
subsequence of S
i
with j
k
<j
k+1
and j
k
∈ {1, 2, , l} - D, and
define the subsequence alignment of A corresponding to D
to be (i.e. the alignment obtained
from A by removing the columns indexed by elements of
D). The gap pattern of a sequence S
i
∈ A, denoted G(S
i
), is
Sw m
wk k
k
l
() .
[],
=
=
∑
1
Ssss
i
D
ij ij ij
lD
=
−
,, ,
12
ASSS
DDD
n
D
= { , , , }
12
Algorithms for Molecular Biology 2008, 3:3 />Page 3 of 9
(page number not for citation purposes)
the set G(S
i
) = {j : s
i,j
= -}. In particular, for each S
i
∈ A the
ungapped sequence corresponding to S
i
equals .
Correspondingly, the gap pattern of A is defined as G(A) =
∪
i
G(S
i
), i.e. the set of indices of those columns in A that
contain at least one gap.
Now, let be a subset of 2
G(A)
(in practice we take either
= 2
G(A)
or = {G(S) : S ∈ A}). For each of the
alignments we calculate a SBM. In
case an alignment A' in contains some gaps, each
sequence S in A' that contains gaps is replaced by the set
of all sequences obtained by replacing the gaps in S with
all possible nucleotide symbol combinations (or the set of
nucleotides actually observed at the gap containing posi-
tion).
Once the set of SBMs has been computed for each align-
ment in , query sequences are then scanned with
each of the matrices, and the final score at a given base in
a query sequence is taken to be the largest of the scores
attained by the individual SBMs. As usual, a target site is
predicted in case the final score exceeds a user-defined
threshold. This extension to gapped alignments allows the
detection of target sites with varying lengths whilst pre-
serving specificity and consistency, both of which are key
features of the original BM approach. Note that consist-
ency is ensured since, for each sequence S
i
∈ A, we have
G(S
i
) ∈ as one alignment in must contain
. Computing SBMs based on makes most
use of the gap information contained in the alignment. As
an alternative, computing a (larger) SBM set based on
may allow detection of target sites that are recognised by
a pairing structure different from those formed by the tar-
get sites known so far, which may be used to improve sen-
sitivity.
Computational complexity
The number of alignments in the set used in the
calculation of SBM set is of order 2
|G(A)|
, and so grows
exponentially with the number of columns in A contain-
ing gaps. Hence, our approach will not scale to long align-
ments containing many gaps. Even so, in practice we have
found the approach to be applicable to miRNA target pre-
diction, since usually |G(A)| ≤ 6 (as miRNAs are about 21
nt in length), resulting in at most 2
6
= 64 alignments in
. Obviously, choosing rather than
can considerably reduce | |, particularly if
gaps occur in only a few distinct patterns. Likewise, the
number of alignments obtained after the gap filling proce-
dure is performed also grows exponentially, although the
approach is still feasible for miRNA targets, again due to
their short length.
Implementation
We have implemented our method in Python [22] and R
[23]. The code, together with documentation and exam-
ples, is freely available for download (see Availability and
Requirements).
Results
To demonstrate the utility of the SBM method, we present
an application to the problem of miRNA target detection
for nematode worm (Caenorhabditis elegans), fruit fly (Dro-
sophila melanogaster), mouse (Mus musculus), human
(Homo sapiens) and thale cress (Arabidopsis thaliana). We
also present a leave one out analysis, and a comparison
S
i
GS
i
()
all
observed
(){ : }=∈AD
D
()
()
S
i
GS
i
()
observed
all
()
()
=
observed
=
all
Alignment of the Drosophila melanogaster let-7 miRNA to a cognate target site in the 3' UTR of the ab gene adapted from [21, Fig. 1]Figure 1
Alignment of the Drosophila melanogaster let-7 miRNA to a cognate target site in the 3' UTR of the ab gene
adapted from [21, Fig. 1].
Algorithms for Molecular Biology 2008, 3:3 />Page 4 of 9
(page number not for citation purposes)
with miRanda [10], a commonly used miRNA target pre-
diction algorithm.
Data
We extracted C. elegans, D. melanogaster, M. musculus and
H. sapiens miRNA entries from the miRBase database,
release 9.1 [9] that had more than one unique, experimen-
tally validated target in the TarBase database [24]. The
reverse complement of each miRNA was then aligned
with its validated target regions using the ClustalW align-
ment package [25]. If local alignment algorithms are used,
terminal gaps carry much less significance than internal
gaps. Therefore, alignments were trimmed by removing
columns containing terminal gaps at the 5' or 3' end.
SBM sets were computed for these alignments as
described in the Methods section. The SBM sets were used
to search for potential new targets in the UTR sequence
sets obtained from BioMart [26] (see Table 1 for details).
To test the applicability of the method to plant target pre-
diction, we took a selection of A. thaliana miRNAs from
miRBase together with validated target regions from the
the Arabidopsis Small RNA Project Database (ASRP) [27],
aligned these sequences with ClustalW, and computed
SBMs.
Summary of SBM Scan
On the animal data sets, we determined for each of the
SBM sets the number of predicted targets obtained by
scanning the UTR data set, using a score threshold of 1
[see Additional file 3]. As in [16], we used the number of
predicted targets obtained with a consistent classifier as an
indicator of the classifier's specificity.
Plant miRNA targets usually occur in the protein coding
region of genes and therefore we searched the gene
sequence set TAIR6_cdna_20051108 obtained from The
Arabidopsis Information Resource (TAIR) [28] again using
a threshold of 1. A summary of these results can be seen
in Table 2 with full datasets available in the supplemen-
tary materials [see Additional file 1].
In accordance with the definition of the SBM method, in
Table 2 we see that all validated targets present in the
input alignment are recovered in the scan output using a
threshold of 1. In many cases no additional candidate tar-
gets are predicted using this stringent threshold, especially
when there are few sequences provided in the input SBM
set. Larger sets of validated targets tended to result in the
prediction of more new candidate target sites, as illus-
trated in Table 2 by the cases of dme-miR-4, dme-miR-7, cel-
let-7 and cel-miR-84. This reflects the consistency criterion
built into the binding matrix definition; a larger input set
of sequences generally tended to reduce the stringency of
the classifier.
cel-let-7 returned 1708 predicted targets at threshold 1
which appears to be relatively high compared with the
other results, but given the size the searched database
(2,274,326 nt) it is a small proportion of all possible tar-
get regions. A possible reason for the large number of pre-
dicted targets is that the input sequence set used to build
the SBM set was misaligned by ClustalW. The validated
targets used to create the alignment showed a greater
degree of heterogeneity that those in other alignments.
Another possible explanation is that cel-let-7 is known to
have several paralogs (cel-miR-84, cel-miR-48 and cel-miR-
241) [29] and therefore its targets are likely to overlap
with other members of this miRNA family. It has also
been suggested that some miRNAs may target thousands
of different genes [30] making it possible that many of the
targets predicted are in fact true positives.
Leave one out analysis
While the SBM method used with S
min
= 1 recovers all tar-
gets that are present in the input alignment, unknown tar-
gets that receive a score below 1 are likely to exist. It is
possible to detect such sequences using the SBM method
by lowering the threshold. This increases the classifier's
sensitivity at the expense of reducing its specificity. To
assess this effect quantitatively we conducted a leave one
out analysis. In particular we constructed leave one out
alignments by deleting one target site sequence from an
input alignment. Then, for each alignment in which the
target sequence w was left out, we computed a SBM set
and determined the score S(w) of the target site that was
left out. If S(w) < 1, the threshold needs to be adjusted to
S
min
= S(w) in order to detect w. We therefore scanned the
Table 1: Summary of UTR datasets
Organism No. Sequences Sequence type No. Nucleotides
C. elegans 12,172 UTR 2,724,326
D. melanogaster 11,277 UTR 4,612,168
M. musculus 20,271 UTR 20,009,781
H. sapiens 27,685 UTR 30,673,888
A. thaliana 31,527 cDNA 46,447,255
"No. sequences" gives total number of unique sequences in this dataset; "Sequence type" gives the sequence type used (UTR or cDNA); "No.
nucleotides" gives total number of nucleotides in the UTR set.
Algorithms for Molecular Biology 2008, 3:3 />Page 5 of 9
(page number not for citation purposes)
respective UTR set with S
min
= min {1, S(w)} and deter-
mined the number of predicted targets.
An input alignment of n sequences allows construction of
n - 1 leave one out alignments (we did not leave out the
reverse complement of the miRNA), so data sets contain-
ing more experimentally validated target sites clearly
result in more meaningful leave one out analyses. We
therefore chose the four miRNAs that had the greatest
number of known experimentally validated targets; D.
melanogaster miR-7 and C. elegans let-7, which both tar-
geted 15 unique UTR regions as well as D. melanogaster
miR-4 (8 unique targets) and C. elegans miR-84 (7 unique
targets). In total 2,484,850 UTR regions were scanned in
the C. elegans set compared with to 4,409,641 regions in
the D. melanogaster set. The score of each left out target
along with the number of regions with a score equal to or
greater than this value in the scan using the full alignment
are shown in Table 3.
The SBM method appears to show a greater degree of
accuracy in the D. melanogaster miR-7 results. Here the
mean score of the left out target is 0.9385 and the mean
number of target regions scoring greater than or equal to
the left out sequence is 273 (0.006% of the total UTR
regions scanned). The C. elegans let-7 scan indicates a
lower degree of specificity, with an average score of
0.9032, returning a mean of 14869 regions with a score
greater than or equal to the score of the left out validated
target sequence. This represents 0.598% of the sequence
database that was searched. For D. melanogaster miR-4 the
SBM method gave a mean score of 0.890 with an average
of 745 target regions scoring greater than or equal to the
left out sequence (0.017% of the total UTR regions
scanned), and for C. elegans miR-84 a mean score of 0.770
was obtained and an average of 26677 target regions scor-
ing greater than or equal to the left out sequence was
returned (1.074% of the total UTR regions scanned). The
decrease in specificity in the C. elegans miR-84 results is
largely due to a single leave one out test in which over
132626 sequences scored higher than the left out
sequence (which received a score of 0.552).
Overall, the lowering of the threshold required to detect a
word not in the input set results in a moderate increase in
the number of reported hits, which is indicative of a high
specificity even with the reduced threshold.
In order to assess the performance of the algorithm when
few known targets are provided in the input alignment
were-ran the C. elegans let-7 and D. melanogaster miR-7
scans but this time split each of the alignments of 15 val-
idated targets into two subalignments containing 8 and 7
sequences respectively. Table 4 shows that as the number
of sequences used to build the SBM decreases, so does the
mean score of the left out sequences. This indicates, as
might be expected that as the number of sequences left
out of the alignment increases the specificity decreases.
Comparison with miRanda
We also compared the performance of the SBM method
with miRanda v1.9, a commonly used target prediction
tool [10]. miRanda takes a single miRNA sequence as
input and searches a sequence dataset for potential target
regions. It uses two different criteria to detect potential tar
Table 2: SBM scan summary obtained using a score threshold of 1
Organism miRNA Validated targets Recovered targets Potential novel targets
C. elegans cel-miR-273 22 0
C. elegans cel-let-7 15 15 1708
C. elegans cel-miR-84 77 123
D. melanogaster dme-miR-11 44 0
D. melanogaster dme-miR-2 44 0
D. melanogaster dme-miR-4 88 23
D. melanogaster dme-miR-7 15 15 28
M. musculus mmu-miR-124 33 0
M. musculus mmu-miR-206 33 0
H. sapiens hsa-miR-1 44 0
H. sapiens hsa-miR-122 33 0
A. thaliana ath-miR-163 55 0
A. thaliana ath-miR-172 66 0
A. thaliana ath-miR-390 11 0
A. thaliana ath-miR-398 22 0
A. thaliana ath-miR-408 23 1
"miRNA" gives miRBase miRNA identifier; "Validated targets" gives number of unique validated targets present in the starting alignment;
"Recovered targets" gives number of validated targets in the input alignment that were recovered; "Predicted novel targets" gives number of
candidate target sequences (other than the validated targets) predicted by the SBM method.
Algorithms for Molecular Biology 2008, 3:3 />Page 6 of 9
(page number not for citation purposes)
Table 3: Leave one out analysis
Drosophila melanogaster, miR-7
Target LOO score LOO score
CG12487.3/223–241 0.946 94
CG5185.3/279–297 1.000 34
CG3096.3/152–170 1.000 34
CG12487.3/250–268 1.000 34
CG3166.3/1100–1118 0.951 76
CG6096.3/103–121 1.000 34
CG8346.3/78–96 0.966 58
CG5185.3/334–352 1.000 34
CG6494.3/447–465 0.919 155
CG6096.3/24–42 1.000 34
CG6096.3/68–86 0.961 65
CG8328.3/63–81 0.773 2015
CG3166.3/1586–1602 0.855 393
CG3166.3/29–46 0.845 513
CG3166.3/1294–1312 0.861 521
Caenorhabditis elegans, let-7
Target LOO score LOO score
ZK792.6/247–264 0.959 3561
F38A6.1a/271–288 1.000 1708
C18D1.1.1/526–542 0.906 10458
ZK792.6/666–683 0.959 3522
ZK792.6/458–475 0.929 7311
F38A6.1a/133–150 0.874 19177
C01G8.9a/21–38 0.850 23906
ZK792.6/132–148 0.859 20570
C01G8.9a/159–175 0.813 30895
ZK792.6/190–207 0.807 41812
C12C8.3a/693–709 0.791 39369
C12C8.3a/742–757 1.000 1499
ZK792.6/484–499 0.898 10232
F11A1.3a/1007–1021 0.948 4658
ZK792.6/343–361 0.955 4352
Drosophila melanogaster, miR-4
Target LOO score LOO score
CG6096.3/135–154 0.755 3118
CG8328.3/27–45 1.000 8
CG3096.3/33–52 0.929 161
CG3096.3/138–157 0.877 473
CG5185.3/46–65 0.960 64
CG12487.3/188–208 0.820 1298
CG12487.3/62–82 0.871 627
CG6096.3/210–230 0.908 207
Caenorhabditis elegans, miR-84
Target LOO score LOO score
ZK792.6/126–148 0.804 4970
ZK792.6/187–207 0.552 132626
ZK792.6/249–264 0.947 355
ZK792.6/342–361 0.761 12552
ZK792.6/460–475 0.858 2012
ZK792.6/479–499 0.739 18375
ZK792.6/665–683 0.726 15846
"target" gives validated target sequence accession/start-end; "miRNA" gives miRNA targeting that region; " LOO score" gives mean number of
regions scoring equal to or greater than the left out sequence.
Algorithms for Molecular Biology 2008, 3:3 />Page 7 of 9
(page number not for citation purposes)
get sites, the alignment score and the MFE of the miRNA
bound to the potential target sequence.
In order to obtain results with miRanda that could be
meaningfully compared with the SBM method, we used
miRanda to score every potential target site across each of
the UTR sequences. To do this we split each of the UTRs
into 30 nt sequence windows covering the entire length of
each UTR and used this as our sequence database for the
miRanda scan. Since the same target region may be scored
more than once using this approach, we removed any
duplicate regions from the results before the comparison.
By default miRanda uses relatively stringent threshold val-
ues which do not necessarily recover all known target
regions, i.e. classification is not consistent. For this reason
miRanda was run using a negative score threshold and a
positive energy threshold which allowed us to obtain a
wide distribution of scores and to ensure consistency.
Table 5 provides an overview of the miRanda comparison,
the full results can be found in the supplementary materi-
als [see Additional file 1]. In general the SBM method
compared favourably with miRanda. This is not unex-
pected as we incorporate additional information into our
searches. For example the cel-let7 results show that an
average of 14869 regions had a score that was at least as
high as the left out sequence using SBM whereas an aver-
age of 92332 regions scored at least as high as the vali-
dated target using miRanda. This difference was more
pronounced in the dme-miR-7 results where an average of
273 sequences scored equal to or better than the left out
sequences and an average of 8868 sequences scored at
least as high as the validated target using miRanda. The
SBM method returned an average of 745 sequences scor-
ing equal to or better than the left out sequence for dme-
miR-4 in comparison to an average of 11488 sequences
that scored at least as high as the validated target using
miRanda. An average of 26677 target regions were
returned using the SBM method for cel-miR-84 compared
with 190693 using miRanda.
We determined the maximal consistent threshold for
miRanda results by filtering out all candidates with an
alignment score lower than the lowest scoring validated
target. The remaining candidates are then filtered further
by removing any sequence with an MFE of greater than the
MFE of the highest (least stable) of the validated targets.
The number of regions returned using the maximal con-
sistent threshold in miRanda were 23992 for cel-let7 in
contrast to the 1708 returned using the SBM method with
maximal consistent threshold. 48538 regions were recov-
ered for cel-miR-84 compared with 123 using SBM, 2129
for dme-miR-4 in comparison to 23 with SBM and 5325
for dme-miR-7, with the SBM method returning 28.
Discussion
We have presented a new method, SBM, that allows the
use of miRNA target site sequences in addition to the
miRNA sequence itself to search for novel target sites. We
have demonstrated its application to target prediction for
a variety of miRNA examples from different organisms
and have shown that it performs well in comparison to
Table 5: Summary of results for the leave one out analysis
miRNA LOO score LOO score miRanda(s) miRanda(s) miRanda(e) miRanda(e) miRanda(se)
cel-let-7 0.903 14869 119 92332 -15.46 60266 23992
cel-miR-84 0.770 26677 106 190693 -10.19 150137 48538
dme-miR-7 0.938 273 159 8868 -21.69 7227 2129
dme-miR-4 0.890 745 131 11488 -8.51 184134 5325
"miRNA" gives miRBase accession of the miRNA sequence; "LOO score" gives mean score of the targets left out of the SBM; " LOO score" gives
mean number of regions scoring equal to or greater than the left out sequence; "miRanda(s)" gives raw score of the miRanda hit of lowest scoring
target region; " miRanda(s)" gives number of regions with returned using the maximal consistent score threshold; "miRanda(e)" gives minimum free
energy (MFE) of the miRanda hit of the least stable target region; " miRanda(e)" gives number of regions with returned using the maximal consistent
MFE threshold; " miRanda(se)" gives number of regions with returned using the maximal consistent combined score and MFE threshold.
Table 4: Leave several out analysis
15 targets 14 targets 8 targets 7 targets
Mean score C. elegans let-7 1.000 0.903 0.851 0.810
Mean number returned C. elegans let-7 1708 14869 18032 17225
Mean score D. melanogaster miR-7 1.000 0.938 0.908 0.890
Mean number returned D. melanogaster miR-7 28 273 509 138
Shows mean scores and mean number of regions scoring above maximal consistent threshold for alignments containing 15, 14, 8 and 7 validated
targets.
Algorithms for Molecular Biology 2008, 3:3 />Page 8 of 9
(page number not for citation purposes)
miRanda. Many computational methods for target predic-
tion tend to suffer from a lack of specificity [15]. The SBM
method allows the use of all known target sequences in
the search, and is designed to provide maximum specifi-
city whilst recovering all members present in the starting
alignment. Thus, as the number of experimentally vali-
dated miRNA targets grows, the SBM method should pro-
vide an attractive addition to the available miRNA target
site detection methods.
Many current target prediction techniques are based on
algorithms with fixed parameters (such as base pairing
rules or binding energies) that are used to assess potential
targets by matching them to the miRNA sequence. These
algorithms are designed to reflect molecular target recog-
nition mechanisms that are assumed to apply to miRNA
target recognition in general. Tailoring these algorithms to
reflect mechanisms that are specific to the miRNA is diffi-
cult or impossible. In contrast to this, the SBM method
can capture aspects of specific binding mechanisms by
extracting such specific information from the set of vali-
dated target site sequences. This also makes the method
generic in that it can be applied to any organism without
having to assume any prior knowledge of specific target
recognition mechanisms.
Due to the small number of validated targets for each
miRNA, the maximal consistent threshold used in the
SBM method is rather stringent. We chose this threshold
to facilitate comparison of the method to miRanda. For
many applications lowering thresholds to increase sensi-
tivity at the cost of losing some specificity may be advisa-
ble. The specificity advantage of the SBM method can be
expected to be partly independent of the threshold, since
moderate relaxation of the threshold for a classifier that
attains a high level of specificity with a given threshold
can be assumed to retain some of the specificity advan-
tage.
As with all scoring matrix approaches, the SBM method is
limited by the quality of the input data. Firstly if a false
positive target sequence is provided as input the method
will be adversely affected, therefore only experimentally
validated targets should generally be used as input. Sec-
ondly the quality of the input alignment is extremely
important and a poor quality alignment will lead to poor
performance. miRNAs are relatively short (~21 nt) which
means that in many cases they can be aligned quite accu-
rately using multiple alignment algorithms such as Clus-
talW [25] and MUSCLE [31]. In some cases however, the
conservation between sites targeted by the same miRNA is
very low, meaning that an accurate sequence alignment is
hard to produce using automated methods. In such cases
it may be favourable to hand curate alignments in order to
ensure quality and obtain optimal SBM results. Thirdly,
although the short length of miRNAs also allows for the
integration of gapped alignments in the SBM method, the
method will only search for the gap patterns contained in
the input alignment. Thus, if targets contain insertion/
deletion patterns which are not specified in this way, then
they may receive a lower score or even be missed com-
pletely depending on the threshold used in the search.
Several miRNA target prediction systems have imple-
mented post-processing steps in order to increase their
specificity. The most commonly used filtering approach is
to look for cross-species conservation of target sites. Here
target sites that appear not to be conserved between mul-
tiple species are filtered out from the search results,
removing false positives, and leading to increased specifi-
city. This type of approach could be applied to results
obtained with SBM to further increase the specificity of
target predictions. However, we note that this might also
lead to a reduction in sensitivity as it is now known that
miRNAs themselves are not always conserved between
related species (e.g. [32]). Another possibility is to post-
process based on target site accessibility. It has recently
been shown that taking into account target site accessibil-
ity in the 3' UTR can improve target prediction accuracy
[33]. For instance if a predicted target site is part of a stable
secondary structure (and is therefore already involved in
base-pairing) it is less likely that the miRNA will be able
to bind to the target causing the translational repression of
the mRNA. In conclusion, we have presented a promising
new method for miRNA target prediction, SBM, that
employs a generic scoring matrix approach and incorpo-
rates experimentally validated targets. Since the number
of validated targets is constantly growing, SBM should
provide a useful new addition to the current target predic-
tion toolbox.
Availability and Requirements
The code, together with documentation and examples, is
freely available for download from http://
www.cmp.uea.ac.uk/~jtk/stackbm/.
Additional material
Additional file 3
Raw result files. Raw SBM results files, alignments of miRNA targets used
in the analysis and a list of overlapping targets predicted by both SBM and
miRanda.
Click here for file
[ />7188-3-3-S3.zip]
Algorithms for Molecular Biology 2008, 3:3 />Page 9 of 9
(page number not for citation purposes)
Acknowledgements
We would like to thank the referees for their helpful comments. Vincent
Moulton thanks Biotechnology and Biological Sciences Research Council
(grant BB/E004091/1) for its support.
References
1. Carrington JC, Ambros V: Role of microRNAs in plant and ani-
mal development. Science 2003, 301(5631336-338 [http://
dx.doi.org/10.1126/science.1085242].
2. Calin GA, Croce CM: MicroRNA-cancer connection: the begin-
ning of a new tale. Cancer Res 2006, 66(157390-7394 [http://
dx.doi.org/10.1158/0008-5472.CAN-06-0800].
3. Reinhart BJ, Weinstein EG, Rhoades MW, Bartel B, Bartel DP: Micro-
RNAs in plants. Genes Dev 2002, 16(131616-1626 [http://
dx.doi.org/10.1101/gad.1004402].
4. Hammond SM, Bernstein E, Beach D, Hannon GJ: An RNA-directed
nuclease mediates post-transcriptional gene silencing in
Drosophila cells. Nature 2000, 404(6775293-296 [http://
dx.doi.org/10.1038/35005107].
5. Mallory AC, Vaucheret H: Functions of microRNAs and related
small RNAs in plants. Nat Genet 2006:S31-S36 [ />10.1038/ng1791].
6. Jovanovic M, Hengartner MO: miRNAs and apoptosis: RNAs to
die for. Oncogene 2006, 25(466176-6187 [ />sj.onc.1209912].
7. Válóczi A, Várallyay E, Kauppinen S, Burgyán J, Havelda Z: Spatio-
temporal accumulation of microRNAs is highly coordinated
in developing plant tissues. Plant J 2006, 47:140-151 [http://
dx.doi.org/10.1111/j.1365-313X.2006.02766.x].
8. Kloosterman WP, Plasterk RHA: The diverse functions of micro-
RNAs in animal development and disease. Dev Cell 2006,
11(4441-450 [ />].
9. Griffiths-Jones S, Grocock RJ, van Dongen S, Bateman A, Enright AJ:
miRBase: microRNA sequences, targets and gene nomencla-
ture. Nucleic Acids Res 2006:D140-D144 [ />nar/gkj112].
10. Enright AJ, John B, Gaul U, Tuschl T, Sander C, Marks DS: Micro-
RNA targets in Drosophila. Genome Biol 2003, 5:R1 [http://
dx.doi.org/10.1186/gb-2003-5-1-r1].
11. Zhang Y: miRU: an automated plant miRNA target prediction
server. Nucleic Acids Res 2005:W701-W704 [ />10.1093/nar/gki383].
12. Krüger J, Rehmsmeier M: RNAhybrid: microRNA target predic-
tion easy, fast and flexible. Nucleic Acids Res 2006:W451-W454
[ />].
13. Mazière P, Enright AJ: Prediction of microRNA targets. Drug Dis-
cov Today 2007, 12(11–12452-458 [ />j.drudis.2007.04.002].
14. John B, Enright AJ, Aravin A, Tuschl T, Sander C, Marks DS: Human
MicroRNA targets. PLoS Biol 2004, 2(11e363 [ />10.1371/journal.pbio.0020363].
15. Rajewsky N: microRNA target predictions in animals. Nat
Genet 2006:S8-13 [ />].
16. Kim JT, Gewehr JE, Martinetz T: Binding matrix: a novel
approach for binding site recognition. J Bioinform Comput Biol
2004, 2(2):289-307.
17. Turner DH, Sugimoto N, Jaeger JA, Longfellow CE, Freier SM,
Kierzek R: Improved parameters for prediction of RNA struc-
ture. Cold Spring Harb Symp Quant Biol 1987, 52:123-133.
18. Wolff H, Brack-Werner R, Neumann M, Werner T, Schneider R:
Integrated Functional and Bioinformatics Approach for the
Identification and Experimental Verification of RNA Signals:
Application to HIV-1 INS. Nucleic Acids Research 2003,
31:2839-2851.
19. Stormo GD: DNA Binding Sites: Representation and Discov-
ery. Bioinformatics 2000, 16:16-23.
20. Madany Mamlouk A, Kim JT, Barth E, Brauckmann M, Martinetz T:
One-Class Classification with Subgaussians. In DAGM Sympo-
sium Edited by: Michaelis B, Krell G. Berlin Heidelberg: Springer Ver-
lag; 2003:346-353.
21. Burgler C, Macdonald PM: Prediction and verification of micro-
RNA targets by MovingTargets, a highly adaptable predic-
tion method. BMC Genomics 2005, 6:88 [ />1471-2164-6-88].
22. The Python Programming Language [
]
23. R Development Core Team: R: A language and environment for statisti-
cal computing 2004 [
]. R Foundation for Sta-
tistical Computing, Vienna, Austria [ISBN 3-900051-07-0].
24. Sethupathy P, Corda B, Hatzigeorgiou AG: TarBase: A compre-
hensive database of experimentally supported animal micro-
RNA targets. RNA 2006, 12(2192-197 [ />rna.2239606].
25. Chenna R, Sugawara H, Koike T, Lopez R, Gibson TJ, Higgins DG,
Thompson JD: Multiple sequence alignment with the Clustal
series of programs. Nucleic Acids Res 2003, 31(13):3497-3500.
26. Kasprzyk A, Keefe D, Smedley D, London D, Spooner W, Melsopp C,
Hammond M, Rocca-Serra P, Cox T, Birney E: EnsMart: a generic
system for fast and flexible access to biological data. Genome
Res 2004, 14:160-169 [ />].
27. Gustafson AM, Allen E, Givan S, Smith D, Carrington JC, Kasschau
KD: ASRP: the Arabidopsis Small RNA Project Database.
Nucleic Acids Res 2005:D637-D640 [ />gki127].
28. Rhee SY, Beavis W, Berardini TZ, Chen G, Dixon D, Doyle A, Garcia-
Hernandez M, Huala E, Lander G, Montoya M, Miller N, Mueller LA,
Mundodi S, Reiser L, Tacklind J, Weems DC, Wu Y, Xu I, Yoo D,
Yoon J, Zhang P: The Arabidopsis Information Resource
(TAIR): a model organism database providing a centralized,
curated gateway to Arabidopsis biology, research materials
and community. Nucleic Acids Res 2003, 31:224-228.
29. Hayes GD, Frand AR, Ruvkun G: The mir-84 and let-7 paralo-
gous microRNA genes of Caenorhabditis elegans direct the
cessation of molting via the conserved nuclear hormone
receptors NHR-23 and NHR-25. Development 2006,
133(234631-4641 [ />].
30. Miranda KC, Huynh T, Tay Y, Ang YS, Tam WL, Thomson AM, Lim
B, Rigoutsos I: A pattern-based method for the identification
of MicroRNA binding sites and their corresponding heter-
oduplexes. Cell 2006, 126(61203-1217 [ />j.cell.2006.07.031].
31. Edgar RC: MUSCLE: a multiple sequence alignment method
with reduced time and space complexity. BMC Bioinformatics
2004, 5:113 [ />].
32. Fahlgren N, Howell MD, Kasschau KD, Chapman EJ, Sullivan CM,
Cumbie JS, Givan SA, Law TF, Grant SR, Dangl JL, Carrington JC:
High-Throughput Sequencing of Arabidopsis microRNAs:
Evidence for Frequent Birth and Death of MIRNA Genes.
PLoS ONE 2007, 2:e219 [ />nal.pone.0000219].
33. Kertesz M, Iovino N, Unnerstall U, Gaul U, Segal E: The role of site
accessibility in microRNA target recognition. Nat Genet 2007,
39(101278-1284 [ />].
Additional file 1
tableS1 – SBM comparison with miRanda. Full results of the SBM com-
parison with miRanda for each of the four miRNAs tested.
Click here for file
[ />7188-3-3-S1.pdf]
Additional file 2
tableS2 – Number of overlapping predictions. Summary table showing the
number of target regions predicted by SBM and miRanda using default
parameters and their overlap.
Click here for file
[ />7188-3-3-S2.pdf]