Báo cáo sinh học: "An experimental study of Quartets MaxCut and other supertree method" pot
Bạn đang xem bản rút gọn của tài liệu. Xem và tải ngay bản đầy đủ của tài liệu tại đây (585.01 KB, 11 trang )
RESEARCH Open Access
An experimental study of Quartets MaxCut and
other supertree methods
M Shel Swenson
1*
, Rahul Suri
1
, C Randal Linder
2
and Tandy Warnow
1
Abstract
Background: Supertree methods represent one of the major ways by which the Tree of Life can be estimated, but
despite many recent algorithmic innovations, matrix representation with parsimony (MRP) remains the main
algorithmic supertree method.
Results: We evaluated the performance of several supertree methods based upon the Quartets MaxCut (QMC)
method of Snir and Rao and showed that two of these methods usually outperform MRP and five other supertree
methods that we studied, under many realistic model conditions. However, the QMC-based metho ds have
scalability issues that may limit their utility on large datasets. We also observed that taxon sampling impacted
supertree accuracy, with poor results obtained when all of the source trees were only sparsely sampled. Finally, we
showed that the popular optimality criterion of minimizing the total topological distance of the supertree to the
source trees is only weakly correlated with supertree topological accuracy. Therefore evaluating supertree methods
on biological datasets is problematic .
Conclusions: Our results show that supertree methods that improve upon MRP are possible, and that an effort
should be made to produce scalable and robust implementations of the most accurate supertree methods. Also,
because topological accuracy depends upon taxon sampling strategies, attempts to construct very large
phylogenetic trees using supertree methods should consider the selection of source tree datasets, as well as
supertree methods. Finally, since supertree topological error is only weakly correlated with the supertree’s
topological distance to its source trees, development and testing of supertree methods presents methodological
challenges.
Background
Because of the computational difficulties in estimating
large phylogenies, many computational biologists think
that the only feasible s trategy to estimating the Tre e of
Life will involve a divide-and-conquer approach where
trees are estimated on subsets of taxa and a computa-
tional method is used to assemble a tree on the entire
taxon set from these smaller trees. These methods are
called supertree methods, the smaller trees are called
source trees and the set of these source trees is called a
profile of trees. While there are many supert ree meth-
ods, only matrix representation with parsimony (MRP)
[1,2] is used regularly in supertree constructions on bio-
logical datasets [3,4].
Quartet amalgamation methods (methods that con-
struct supertrees when all source trees are four-leaf
trees) can also be used as gen eric supertree methods, as
follows. First, each estimated source tree is replaced
with a subset of its induced quartet trees, and then the
sets of quartet trees are combined into a collection of
quartet trees (some from each source tree). This set is
then passed to the quartet amalgamation method to
estimate a supertree.
Constructing a tree from a set of quartet trees pre-
sents computational challenges. For example, the natural
optimization problem, Maximum Quartet Consistency
(MQC), in which the input is a set of quartet trees and
a supertree is sought that displays the maximum num-
ber of quartet trees, is NP-hard, and generally hard to
approximate except in special cases [5-8]. Theoretical
results and heuristics for the special case where the
* Correspondence:
1
Department of Computer Science, The University of Texas at Austin, Austin
TX, USA
Full list of author information is available at the end of the article
Swenson et al. Algorithms for Molecular Biology 2011, 6:7
/>© 2011 Swenson et al; licensee BioMed Central Ltd. This is an Open Access article distributed under the te rms of the Creative
Commons Attribution Li cense ( which permits unrest ricted use, distribution, and
reproduction in any medium, provided the original work is properly cited.
input set contains a tree on every quartet appear in
[9-13].
In a recent paper [14], Snir and Rao presented Quar-
tets MaxCut (QMC), a heuristic for MQC that can be
applied to arbitrary sets of quartet trees (i.e., ones that
may not contain a tree on every quartet). Snir and Rao
showed that by encoding the source trees as quartet
trees, QMC could be used as a supertree method for
arbitrary inputs. Their study evaluated this QMC-based
supertree method for a number of biological supertree
profiles; however, since the true supertree was not
known, they could not evaluate the topological accuracy
of the supertrees they constructed. Instead, they com-
puted the average similarity of the QMC and MRP
supertrees to the source trees, using two different sim i-
larity measures. This comparison showed that QMC had
higher average similarity to the source trees unde r one
criterion, and lower average similarity with respect to
another; thus, Snir and Rao failed to establish that QMC
produced “better” trees than MRP.
QMC’s failure to outperform MRP as a supertree
method with respect to the supertrees’ average similarity
to the source trees sho uld notbeconsideredaserious
problem for the QMC method for two reasons. First,
average similarit y to the source trees is not the same as
accuracy with respect to the true tree (a question we
investigate directly in this paper). Second, QMC
depends critically upon the specific technique used to
encode each source tree as a set of quartet trees. There-
fore, QMC might be producing highly accurate super-
trees even though their average similarity to their source
trees is lower than MRP supertrees, and it might be cap-
able of producing more accurate supertrees if other
encodings of the source trees were used. In this paper,
we report results from a study in which we explored
several encodings of the source trees by quartet trees
and applied QMC to the resultant sets of qu artet trees.
We compared these different QMC-based supertree
methods t o MRP and five oth er supertree methods:
Robinson-Foulds Supertrees (RFS) [15], Q-imputation
(Q-Imp) [16], MinFlip [17-19], SFIT [20] , and PhySIC
[21]. We find:
• The topological accuracy of QMC supertrees com-
puted from different encodings varied substantially.
• Two QMC-based supertree methods, QMC(All)
andQMC(Exp+TSQ)(differingonlyinhowthe
source trees are encoded) produced more accurate
supertrees than all the other supertree methods
under many r ealistic model conditions, and had
comparable accuracy under most others. However,
both of these QMC-based supertree methods had
problems with profiles containing larg e source trees.
For such profiles, QMC(All) often failed to run, and
QMC(Exp+TSQ) pe rformed less well than MRP.
Finally, when both QMC methods could be run
their results were comparable.
• Supertrees estimated on profiles in which all the
source trees were based upon sparsely sampled taxa
tended to have poor accuracy by comparison to
supertrees estimated on profiles in which most
source trees were clade-focused. Therefore, the
taxon sampling strategies used to define the source
tree datasets impacts supertree accuracy, and needs
to be considered in the design of supertree studies.
• Topologi cal similarity of supertrees to their source
trees is not strongly correlated with t opological
accuracy of supertrees. Thus, evaluating supertree
methods on biological datasets is problematic, and
supertree methods that seek to minimize topological
dis tance to their source trees may no t have the best
accuracy.
Methods
Basics
Supertree datasets
Because of the taxon sampling strategies used by biolo-
gists, source trees tend to be focused either on inten-
sively sampled, smaller subgroups, like big cats, or on
larger, sparsely sampled groups, like all vertebrates. We
refer to the first type as a clade-based source tree, and
the second type as a scaffold. Supertree profiles include
scaffolds to ensure sufficient overlap with the c lade-
based trees.
Matrix representation with parsimony
MRP encodes source trees as a matrix of partial binary
characters: all e ntries in the matrix are 0, 1, or ?, with
each column in the matrix defined by a single edge in a
source tree. The matrix is then analyzed using a heuris-
tic for the NP-hard maximum parsimony problem [22].
Quartets MaxCut (QMC)
QMC is a quartet amalgamation method, operating in
polynomial time and providing no guarantees with
respect to its optimizationproblem,MQC.Thesource
trees are encoded by sets of quartet trees, and QMC is
applied to the union of these sets.
Quartet encodings of source trees
The work presented here explored several techniques
for representing source trees by sets of quartet trees.
Two of these techniques use random sampling strategies
[14], which are based upon computation of the topologi-
cal distance between leaves in the source tree. The topo-
logical diameter of a quartet tree q with respect to a
source tree t (denoted diam
t
(q)) is the maximum of its
leaf-to-leaf topological distances within t.Thequartet
encoding strategies used in [14] also included calcula-
tion of the Topologically-Short Quartet (TSQ) trees,
defined as follows. For each edge in a source tree, pick
Swenson et al. Algorithms for Molecular Biology 2011, 6:7
/>Page 2 of 11
the topologically neare st leaves in each of the subtrees
around the edge. If two or more leaves within a subtree
have the same topological distance to the edge, pick all
such leaves. The set of quartet trees formed by picking
one such leaf from each subtree forms the TSQs around
that edge. The union of all these is the set of TSQ trees.
We tested three strategies for encoding a source tree t
by a set of quartet trees:
All quartets: include all induced four-taxon trees.
Geo+TSQ:includeaquartetq with probability d
-
3
where d = diam
t
(q), and add the TSQ trees (this
method was studied in [14]).
Exp+TSQ: compute the topological distance
between every pair of leaves, include a quartet with
probability 1.5
-d
where d = diam
t
(q), and add the
TSQ trees (this method was also studied in [14]).
Performance study design
Our simulation study used datasets that have properties
typical of biological supertree datasets, and that were
used in a previous study [23] to compare supertree
methods to combined analysis using maximum likeli-
hood. These datasets had 100, 500 and 1000 taxa, and
came in two types: (1) mixed source trees, cons isting of
one scaffold dataset (produced by a rando m selection of
taxa from the entire d ataset) and many clade-based
datasets (focused dense taxon sampling within a rooted
subtree), and (2) all-scaffold source trees, in which all
source tree datasets were obtained by sampling ran-
domly within the full dataset. Here we describe the
simulation methodology in brief, for details see [23].
Step 1: Generate model trees
We generated trees with 100, 500 and 1000 leaves (taxa)
under a pure birth process, deviating these from ultra-
metricity (the molecular clock hypothesis). We gener-
ated 30 datasets for each 100- and 500-taxon model
condition, and 10 datasets for each 1000-taxon model
condition.
Step 2: Evolve gene sequences down the model tree
We first determined the subtree within the model tree
for which each gene would be present, using a gene
“birth-death” process (gene gain and loss); this produced
missing data patterns that reflect biological processes.
Each gene was then evolved down its subtree under a
General Time Reversible process with rates for sites
drawn from a Gamma plus Invariable distribution (GTR
+Gamma+I) [24]), using a variety of GTR matrices esti-
mated for different biological datasets (see Appendix
[Additional file 1]).
Step 3: Dataset production
We selected (1) datasets of genes to estimate trees on
specific clades (rooted subtrees) within the tree and (2)
datasets of genes to form the scaffold tree. We selected
three genes for each clade dataset, and four genes for
each scaffold dataset. Each model condition is indi-
cated by the number of taxa in the model tree and by
the density of the scaffold dataset, which is the percen-
tage of the entire taxon set in the scaffold dataset, with
scaffold densities ranging from 20% to 100%. We gen-
erated two types of source tree dataset profiles: those
containing only scaffolds, and t hose containing one
scaffold and several clade-based datasets (as described
earlier).
Step 4: Estimation of source trees
We used RAxML [25], one of the most accurate ML
phylogeny estimation methods.
Step 5: Estimation of the supertrees
We used MRP, using a very effective heuristic search
technique called the Ratchet [2 6] (see Appendix [Addi-
tional file 1] for commands used). This returns a set of
trees, each of which has the best (found) score; we then
compute the greedy consensus (gMRP) tree for this set.
Thegreedyconsensusisarefinementofthemajority
consensus, and thus contains all the bipartitions present
in more than half the input trees; it is a common con-
sensus method, and in our experiments produces the
most accurate supertrees when applied to results pro-
duced by the Ratchet. We also computed supertrees
based upon three ways of encoding the source trees as
sets of quartet trees and then applying Q MC, as
described above. Finally, we computed supertrees using
fiveothermethods:Q-Imp,RFS,MinFlip,SFIT,and
PhySIC (See Appendix [Additional file 1] for details on
software and commands used).
Because MinFlip, RFS, and PhySIC require that the
source trees be rooted, we rooted each source tree at
the midpoint of the longest leaf-to-leaf path (a standard
method for rooting trees when there is no outgroup
available) before passing the source trees to these three
methods.
Step 6: Performance evaluation
Topological error for each estimated supertree was mea-
sured as follows. We represented each tree T on leaf set
S by the set ∑(T) of bipartitions induced on the leaf set,
one bipartition for each internal edge in the tree. If T is
an estimated supertree and T
0
is the true (model) tree,
then the false positive rate is
|
(
T
)
−
(
T
0
)
|
|
(
T
)
|
,andthe
false negative rate is
|
(
T
0
)
−
(
T
)
|
|
(
T
0
)
|
.
We also computed the total topological distance of
each supertree to its source trees. To do this, we
restricted the supertree to the subset of taxa for each
source tree, and then computed the topological dis-
tances between the two trees. We computed the
Swenson et al. Algorithms for Molecular Biology 2011, 6:7
/>Page 3 of 11
following three distance measures for each supertree T
to its source tree profile
T
.
Sum-FN, defined as follows: Sum-
FN
(
T, T
)
=
t∈T
(
FN
(
T, t
))
M
,whereFN(T, t)isthe
number of edges in t that do not appear in T,and
M =
t∈
T
m
t
,wherem
t
is the number of internal
edges in t.
Sum-FP and Sum-RF, defined similarly, with FP(T,
t )andRF(T, t)replacingFN(T. t), respectively. FP
denotes the false positive distance and RF denotes
the Robinson-Foulds ("bipartition”)distance.The
false positive distance between a supertree T and a
source tree t in the profile
T
is the number of edges
in T that do not appear in t. The Robinson-Foulds
error rate is the average of the FP and FN error
rates.
Each distance measure was normalized by the number
of edges (bipartitions) in the relevant tree (the model
tree for false negatives, and the estimated tree for false
positives), to produce error rates between 0 and 1. Note
that if the supertree and all source trees are binary, then
RF(T, t)=2FN(T, t)=2FP(T, t), and after normalization
all three distances are equal. When the estimated trees
are not binary, the RF distance is biased in favor o f
unresolved trees [27]. Our source trees were generally
fully binary or nearly fully binary. With the exception of
PhySIC, the supertree methods we studied produced
either fully resolv ed, or almo st fully resolved supertrees.
PhySIC is highly conservative and therefore tended to
produce highly unresolved trees. Consequently, PhySIC
tended to have very low false positive rates at the
expense of hav ing very high false negative rates. In our
results, we, therefore, show false negative error rates,
since except for PhySIC, the relative performance of the
different supertree methods does not depend upon the
error metric used. This allows us to provide a more
nuanced evaluation than would be possible with RF. We
calculated average error rates and standard error for
each model condition. However, because QMC failed to
return trees on some inputs, we restricted our results to
datasets for which all the reported methods returned
trees. This reduced the number of replicates for some
model conditions. We also recorded the running time
and space usage of each method on each dataset.
Because the analyses were run under Condor (a distrib-
uted software environment [28]), running times are
approximate (particularly for the larger datasets) and are
larger than if they had been run on a dedicated
processor.
Results
Exploring QMC under various quartet encodings
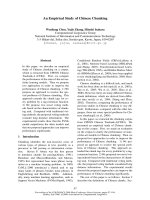
We show FN rates of QMC variants and gMRP on
mixed datasets in Figure 1. On the mixed 100-taxon
datasets, QMC(All) and QMC(Exp+TSQ) were essen-
tially tied as the best methods, followed by gMRP. QMC
(Geo+TSQ) had worse accuracy. Furthermore, QMC
(All) and QMC(Exp+TSQ) had the greatest advantage
over gMRP for the sparse scaffold cases. On a large
number of the 500- and 1000-taxon datasets, many of
the QMC variants failed to complete, indicating that
computational issues can limit QMC’s utility. On the
500-taxon datasets for which QMC(Exp+TSQ) coul d be
run, it produced topologically more accurate trees than
gMRP, providing the biggest advantage on the sparse
scaffold datasets. For the 1000-taxon datasets, gMRP
outperformed all the QMC variants that completed.
However, most QMC variants failed to return trees on
most inputs.
Comparing QMC(Exp+TSQ) to other supertree methods
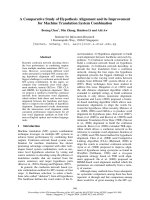
We report FN rates in Figure 2 (all methods) and Figure
3 (omitting PhySIC and SFIT). All six non-QMC-based
supertr ee methods could be r un on the 100-taxon data-
sets, but some failed to run on the larger datasets. We,
therefore, show results for all seven methods on the
100-taxon datasets, but only five methods on the 500-
taxon datasets (where SFIT and Q-Imp failed to run,
due to computational limitations), and only four meth-
ods on the 1000-taxon datasets (where we did not try to
run PhySIC, since it had poor topological accuracy and
was computationally intensive for the 500-taxon data-
sets). As noted above, QMC(Exp+TSQ) failed to run on
some datasets, so w e again only report results for those
datasets on which all reported methods were able to
run.
On the 1 00-taxon datasets, QMC(Exp+TSQ) and Q-
Imp both had higher accuracy than gMRP, except on
the 100% scaffold datasets, where they were equal. On
the 500-taxon datasets, QMC(Exp+TSQ) had a slight
advantage over gMRP on the sparse scaffold datasets,
but essentially the same accuracy on datasets with the
two densest scaffolds. On the 1000-taxon datasets,
gMRP had an advantag e over QMC(Exp+TSQ), and
QMC(Exp+TSQ) failed to run on the denser scaffold
datasets (large source trees caused QMC to fail due to
computational reasons). On all these model conditions,
gMRP had higher accuracy than the remaining methods.
PhySIC gave by far the worst results, producing comple-
tely unresolved trees exce pt when the sc affold density
was 100%, a t which point it produced results that were
still worse than the other methods.
Swenson et al. Algorithms for Molecular Biology 2011, 6:7
/>Page 4 of 11
Evaluating the impact of taxon sampling strategies
Supertree studies differ not only in the methods used to
combine source trees into a t ree on the full set of taxa,
but also in how the source tree datasets are produced,
and in particular how densely sampled these source
trees are. On d atasets that have only one scaffold, the
accuracy of all supertree methods suffer as the density
of the scaffold decreases, a trend that was also observed
by Swenson et al. [23] (see Figures 1, 2, 3). Figure 4
shows the results of an experiment in which we sought
to evaluate the impact of the density of taxon sampling
within source trees on the accuracy of the produced
supertree for 100- and 500-taxon all-scaffold datasets;
we did not generate 1000-taxon all-scaffold datasets,
and therefore did not analyze such datasets using any
supertree methods, due to the running time required to
estimate dense scaffolds for such datasets. We compared
the topological accuracy of supertrees estimated on all-
scaffold datasets with those from mixed-datasets (data-
sets having one scaffold source tree with the remaining
source trees being clade-based).
We found that the density of taxon sampling in the
source trees in all-scaffold datasets has a strong effect
on supertree accuracy, particularly at low scaffold densi-
ties. When the source trees were all based upon sparsely
sampled scaffold da tasets, the FN error rates were high
for both gMRP and QMC(Exp+TSQ) , and m uch higher
than when most of the source trees were clade-based. In
addition, there was only a slight advantage obtained by
using gMRP over QMC(Exp+TSQ). We a lso examined
the performance of QMC(All) on these all-scaffold data-
sets (data not shown), and saw that it performed poorly,
failing to return trees on most of the datasets. For
example, on the 100-taxon all-scaffold datasets, QMC
(All) returned a tree on none of the 20% scaffold data-
sets, two of the 50% scaffold datasets, on eleven of the
75% scaffold datasets and on four of the 100% scaffold
datasets. However for those datasets for which it did
return trees, they were less accurate than QMC(Exp
+TSQ). Because QMC(All) returned trees for very few
datasets, we did not include data for it in Figure 4.
We also analyzed all-scaffold datasets with 500 taxa
and observed the same trends: gMRP and QMC(Exp
+TSQ) both had poor accuracy on the sparse scaffold
model conditions, and-when bo th could be run-had
comparable accuracy. In addition, we note that QMC
(Exp+TSQ) could not be run on the dense 500-taxon
scaffold conditions, and QMC(All) successfully com-
pleted on only two of the 20% scaffold datasets and
none for denser scaffolds.
scaffold densit
y
FN
rate
0.1
0.2
0.3
0.4
0.5
number of taxa: 100
20 50 75 100
number of taxa: 500
20 50 75 100
number of taxa: 1000
20 50 75 100
QMC(Geo+TSQ)
gMRP
QMC(Exp+TSQ)
QMC(All)
Figure 1 Scaffold density vs. QMC-based and MRP FN r ate. False Negative (FN) error rates and error bars of QMC variants and gMRP on
mixed source tree datasets with 100, 500, and 1000 taxa, as a function of the scaffold density. Points are graphed for a method if it had at least
ten datasets (or four datasets, for the 1000-taxon model conditions) that completed in common with all other methods.
Swenson et al. Algorithms for Molecular Biology 2011, 6:7
/>Page 5 of 11
scaffold densit
y
FN
R
ate
0.2
0.4
0.6
0.8
1.0
number of taxa: 100
●
●
●
●
●
●
●
●
●
●
●
●
●
●
●
●
●
●
●
●
●
●
●
●
●
●
●
●
●
●
●
●
●
●
●
●
●
●
●
●
●
●
●
●
●
●
●
20 50 75 100
number of taxa: 500
●
●
●
●
●
●
●
●
●
●
●
●
●
●
●
●
●
●
●
●
●
●
●
●
●
●
●
●
●
●
●
●
●
●
●
●
●
●
●
●
●
●
●
●
●
●
●
●
●
●
●
●
●
●
●
●
●
●
●
●
●
●
●
●
●
●
●
●
●
●
●
●
●
●
20 50 75 100
number of taxa: 1000
●
●
●
●
●
●
●
●
●
●
●
●
●
●
●
●
●
●
●
●
●
●
●
●
●
●
●
●
●
●
●
●
●
●
●
●
●
●
●
●
●
●
●
●
●
●
●
●
●
●
●
●
●
●
●
●
●
●
●
●
●
●
●
●
●
●
●
●
●
●
●
●
●
●
●
●
●
●
●
●
●
●
●
●
●
●
●
●
●
●
●
●
●
●
●
●
●
●
●
●
●
●
●
●
●
20 50 75 100
PhySIC
SFIT
MinFlip
●
●
RFS
gMRP
Q−Imp
QMC(Exp+TSQ)
Figure 2 Scaffold density vs. supertree method FN rate. False Negative (FN) err or rates and error bars of gMRP, SFIT, MinFlip, RFS, PhySIC, Q-
Imp, and QMC(Exp+TSQ) on mixed source tree datasets with 100, 500, and 1000 taxa, as a function of the scaffold density. Points are graphed for a
method if it had at least ten datasets (or four datasets, for the 1000-taxon model conditions) that completed in common with all other methods.
scaffold densit
y
FN
rate
0.1
0.2
0.3
0.4
number of taxa: 100
●
●
●
●
●
●
●
●
●
●
●
●
●
●
●
●
●
●
●
●
●
●
●
●
●
●
20 50 75 100
number of taxa: 500
●
●
●
●
●
●
●
●
●
●
●
●
●
●
●
●
●
●
●
●
●
●
●
●
●
●
●
●
●
●
●
●
●
●
●
●
●
●
●
●
20 50 75 100
number of taxa: 1000
●
●
●
●
●
●
●
●
●
●
●
●
●
●
●
●
●
●
●
●
●
●
●
●
●
●
●
●
●
●
●
●
●
●
●
●
●
●
●
●
●
●
20 50 75 100
MinFlip
●
●
RFS
gMRP
Q−Imp
QMC(Exp+TSQ)
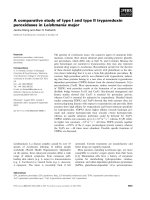
Figure 3 Scaffold density vs. 4 best supertree methods’ FN rate. Topological error rates on mixed datasets, without PhySIC and SFIT (which
had higher error rates). We report False Negative (FN) rates (means with standard error bars) for gMRP, MinFlip, RFS, Q-Imp, and QMC(Exp+TSQ),
as a function of the scaffold density, for 100-, 500-, and 1000-taxon model conditions.
Swenson et al. Algorithms for Molecular Biology 2011, 6:7
/>Page 6 of 11
In summary, the general performance on the all-scaf-
fold datasets showed that whenever the scaffold density
was low, the absolute topological error rates were very
high. Furthermore, on these all-scaffold datasets, QMC
variants rarely returned trees. On datasets for which
they did return trees, the best QMC analyses were quite
close to those of MRP.
Using topological distances to source trees as a proxy for
topological accuracy
For biological datasets, the true tree is not available, so
evaluations of supertree accuracy have tended to use
average or total topological distance to the source trees
(see, for example, [14,15]). Is this a good proxy f or the
quality of the supertree?
To address this question, we examined how closely
Sum-FN, Sum-FP, and Sum-RF were correlated with the
FN, FP and RF rates, respectively. We calculated Spear-
man rank-correlations for each of the 100-taxon simu-
lated datasets for the six supertree methods that
consistently performed reasonably well (MinFlip, MRP,
Q-Imp, QMC(All), QMC(Exp+TSQ), and RFS). Table 1
gives the correlations for the 100-taxon model condi-
tions. The statistics were calculated this way to test
whether the rank-order of the topological distances to
source trees correlated strongly with the true rank-order
of the supertrees, in terms of topological accuracy with
respect to the true tree. We found the degree of correla-
tion was largely independent of the choice of topological
distance to the source trees and absolute supertree error
because the true supertrees were fully resolved and all
the estimated supertrees were either fully resolved or
nearly fully resolved. We, therefore, focus on the corre-
lation between SumFN (topological distance to the
source trees) and FN (topological distance to the true
tree).
The results show that using the distance of a supertree
from its source trees is not a reliable optimality criterion
for assessing the topological accuracy of the supertree.
In no case was the correlation with true accuracy for a
given scaffold density greater than 60%. Furthermore,
some datasets had a strong negative correlation between
SumFN and the true quality of the supertrees, making
the optimality criterion positively misleading in those
cases.
Scalability
We compared the running time of all supertree methods
on simulated data. Figure 5 gives the results for the
QMC variants and gMRP, and Figure 6 gives results for
gMRP, QMC(Exp+TSQ), and the other (non-QMC-
based) supertree methods.
scaffold densit
y
FN
rate
0.2
0.4
0.6
0.8
number of taxa: 100
20 50 75 100
number of taxa: 500
20 50 75 100
QMC(Exp+TSQ)
gMRP
Figure 4 Scaffold density vs. supertree method FN rate on all-scaffold data. Topological er ror rates on 100- a nd 500-taxon all-scaffold
datasets. We report False Negative (FN) rates (means with standard error bars) for QMC(Exp+TSQ) and gMRP as a function of the scaffold density.
Swenson et al. Algorithms for Molecular Biology 2011, 6:7
/>Page 7 of 11
Supertree methods on the simulated datasets showed
some differences in running times. First, gMRP was fas-
ter than the accurate QMC variants for most of the
model conditions, and the degree of improvement ran-
ged from very small (a few seconds) to se veral hours. In
general, we saw that profiles with large source trees
were particularly computationally intensive for QMC
(Exp+TSQ) and QMC(All), and that for such datasets,
gMRP had a running time advantage.
We note that the running times o f QMC(All), QMC
(Geo+TSQ), and QMC(Exp+TSQ), were strongly
impacted by the size of the source trees, since each
four-tuple of taxa must be examined to produce the
quartet trees. Thus, for large source trees, we expect
these three QMC methods to suffer computationally,
just because of the number of quartets that are exam-
ined. In addition, needing to store a large set of quartet s
also impacts the memory requirements of the method.
Table 1 Correlation between topological distance to source trees and topological error rates
Scaffold Density Optimality Criterion FN FP RF
Mean Range Mean Range Mean Range
SumFN 0.401 -0.890, 0.939 0.376 -0.890, 0.926 0.391 -0.890, 0.926
25% SumFP 0.421 -0.890, 0.939 0.421 -0.890, 0.926 0.426 -0.890, 0.926
SumRF 0.406 -0.890, 0.939 0.395 -0.890, 0.926 0.406 -0.890, 0.926
SumFN 0.544 -0.203, 1.000 0.536 -0.348, 0.971 0.541 -0.203, 0.971
50% SumFP 0.546 -0.143, 1.000 0.539 -0.257, 0.971 0.543 -0.143, 0.971
SumRF 0.546 -0.143, 1.000 0.539 -0.257, 0.971 0.543 -0.143, 0.971
SumFN 0.593 -1.000, 0.986 0.589 -1.000, 0.986 0.591 -1.000, 0.986
75% SumFP 0.593 -1.000, 0.986 0.589 -1.000, 0.986 0.591 -1.000, 0.986
SumRF 0.593 -1.000, 0.986 0.589 -1.000, 0.986 0.591 -1.000, 0.986
SumFN 0.447 -0.789, 1.000 0.447 -0.789, 1.000 0.447 -0.789, 1.000
100% SumFP 0.447 -0.789, 1.000 0.447 -0.789, 1.000 0.447 -0.789, 1.000
SumRF 0.447 -0.789, 1.000 0.447 -0.789, 1.000 0.447 -0.789, 1.000
Results of Spearman rank-order correlations of SumFN, SumFP, and SumRF with the true FN, FP, and RF measures of supertrees estimated using six supertree
methods.
scaffold densit
y
Ti
me, secon
d
s
10
1
10
2
10
3
10
4
number of taxa: 100
20 50 75 100
number of taxa: 500
20 50 75 100
number of taxa: 1000
20 50 75 100
QMC(All)
QMC(Geo+TSQ)
QMC(Exp+TSQ)
gMRP
Figure 5 Scaffold density vs. QMC-based and MRP run ning times. Running times (in seconds) of QMC supertree methods and gMRP on
mixed datasets; the y-axis is given with a logarithmic scale.
Swenson et al. Algorithms for Molecular Biology 2011, 6:7
/>Page 8 of 11
Note that the number of quartets produced by each
encoding varied dramatically, w ith QMC(Geo+TSQ) by
far producing the fewes t, followed by, QMC(Exp+TSQ),
then with many more, and finally by QMC(All)
(Table 2). On the other hand, we also observed that
QMC(All) will not run on some datasets even though
QMC(Exp+TSQ) may run, and vice-versa. Thus, it is
possible that improved QMC software could increase
the scope of problems on which the method can be
used and increase the reliability of the method.
Conclusions
This study makes several important contributions. First,
and most importantly, we show that MRP is no longer
the sole “method to beat,” since b oth QMC(Exp+TSQ)
and Q-Imp produce more accurate supertrees than
MRP under many realistic conditions. On the other
hand, MRP does outperform all the other supertree
methods we tested and remains the most accurate
method that can be consistently run on profiles that
contain large source trees. Overall, we have shown that
improved supertree methods are possible and that an
effort should be made to produce scalable and robust
implementations of the most accurate supertree meth-
ods. The compu tational limitations of QMC(Exp +TSQ)
and Q-Imp result from the fact that each of these meth-
ods produces a quartet encoding of the source trees.
Scalable implementations of these methods will require
not using all the quartets in these encodings, as such
approaches simply will fail on large datasets.
The second important contribution of the study is the
finding that the total topological distance of a supertree
to its source trees can be a very poor optimality criterion,
and that these distance measures can only provide reli-
able comparisons between supertrees that have very dif-
ferent total topological distances. This observation has
scaffold densit
y
Ti
me, secon
d
s
10
1
10
2
10
3
10
4
number of taxa: 100
●
●
●
●
●
●
●
●
●
●
●
●
●
●
●
●
●
●
●
●
●
●
●
●
●
●
●
●
●
●
●
●
●
●
●
●
●
●
●
●
●
●
●
●
●
●
●
●
●
●
●
●
●
●
●
●
●
●
●
●
●
●
●
●
●
●
●
20 50 75 100
number of taxa: 500
●
●
●
●
●
●
●
●
●
●
●
●
●
●
●
●
●
●
●
●
●
●
●
●
●
●
●
●
●
●
●
●
●
●
●
●
●
●
●
●
●
●
●
●
●
●
●
●
20 50 75 100
number of taxa: 1000
●
●
●
●
●
●
●
●
●
●
●
●
●
●
●
●
●
●
●
●
●
●
●
●
●
●
●
●
●
●
●
●
●
20 50 75 100
SFIT
Q−Imp
MinFlip
●
●
RFS
QMC(Exp+TSQ)
gMRP
PhySIC
Figure 6 Scaffold density vs. supertree method running times. Running times (in seconds) of supertree methods on mixed datasets; the y-
axis is given with a logarithmic scale.
Table 2 Number of quartets
100 taxa 500 taxa
Methods (20%) (50%) (75%) (100%) (20%) (50%) (75%) (100%)
QMC(Geo+TSQ) 2,033 2,102 2,759 4,046 65,363 102,255 223,174 487,242
QMC(Exp+TSQ) 18,799 19,704 25,388 34,432 268,335 433,546 694,134 1,088,577
QMC(All) 2,738,798 2,652,543 3,712,832 6,362,857
Average number of quartets input to QMC on mixed datasets; scaffold densities are shown in parentheses.
Swenson et al. Algorithms for Molecular Biology 2011, 6:7
/>Page 9 of 11
several consequences for supertree analyses. First,
directly trying to optimize the total topological distance
of supertrees to their source trees is not likely to produce
the most accurate trees, since better trees are being pro-
duced through other means. Secondly, because the true
tree is not known for biological supertree datasets, it is
difficult to evaluate supertree methods using biological
datasets. Finally, previous studies that have explored per-
formance of supertree methods using total topological
distance to the source trees need to be revisited.
Our study also shows that supertree analyses are very
much impacted by the strategies used to define the
source tree datasets, with sparse “all-scaffold” datasets
resulting in generally much lower accuracy supertrees
than when the source trees are primarily based upon
dense sampling within clades. This final observation has
significant consequences for systematic studies, and for
attempts to assemble the Tree of Life.
Finally, our conclusions are clearly based upon the
conditions of this experiment, in which the source trees
were reasonably, but not extremely, accurate. (If all the
source trees had been accurate, then most supertree
methods would have performed well, provided that the
source trees had good overlap. In that case, supertrees
based upon either MRP or minim izing the topological
distance to the source trees would be guaranteed to
return the true tree as one of the solutions.) Most
source trees are likely to have some error when using
real biological datasets for at least two reasons. First,
alignmen ts must be estimated, and these can be difficult
for some datasets with many insertions and deletions.
(By contrast, in our simulation study, sequence evolu-
tion occurred without indels, and so the true alignment
was known). Second, while maximum likelihood can be
a very accurate phylogeny estimator when the seque nces
evolve under the model assumed in the ML software,
true biological datasets do not evolve under the idea-
lized conditions reflectedineventhemostcomplex
DNA sequence evolution models used in this experi-
ment. Therefore, phylogenies estimated under ML for
real datasets are likely to have more error than we
observed in these simulations. How supertree methods
will respond to increased error in source trees is a sub-
ject for further study.
Additional material
Additional file 1: Appendix. The appendix includes the commands
used to perform the simulation study.
Acknowledgements
This research was supported in part by the US National Science Foundation
under grants DEB 0733029, 0331453 (CIPRES), and DGE 0114387. We thank
Francois Barbancon for assistance early on in the project, Sagi Snir for
assistance with using the QMC code and for providing additional software
for generating quartet encodings, and the referees for their helpful and
detailed comments.
Author details
1
Department of Computer Science, The University of Texas at Austin, Austin
TX, USA.
2
Section of Integrative Biology, The University of Texas at Austin,
Austin TX, USA.
Authors’ contributions
MSS designed and performed the simulation study, and drafted the
manuscript. RS assisted in simulation study and data analyses and created
the figures. TW conceived the study, assisted in the design and analysis of
the simulation study, and helped draft the manuscript. CRL assisted in the
design and analysis of the simulation study, performed the statistical study
comparing topological distances to source trees to topological error, and
revised the manuscript. All authors read and approved the final manuscript.
Declaration of competing interests
The authors declare that they have no competing interests.
Received: 17 August 2010 Accepted: 19 April 2011
Published: 19 April 2011
References
1. Baum BR: Combining trees as a way of combining data sets for
phylogenetic inference, and the desirability of combining gene trees.
Taxon 1992, 41:3-10.
2. Ragan MA: Phylogenetic inference based on matrix representation of
trees. Mol Phylo Evol 1992, 1:53-58.
3. Bininda-Emonds ORP: The evolution of supertrees. Trends in Ecology and
Evolution 2004, 19:315-322.
4. Bininda-Emonds ORP: Phylogenetic Supertrees: Combining Information To
Reveal The Tree Of Life Computational Biology, Kluwer Academic, Dordrecht,
the Netherlands; 2004.
5. Ben-dor A, Chor B, Graur D, Ophir R, Pelleg D: Constructing phylogenies
from quartets: elucidation of eutherian superordinal relationships.
Journal of Computational Biology 1998, 5(3):377-390, [Earlier version
appeared in RECOMB 1998].
6. Jiang T, Kearney P, Li M: A polynomial-time approximation scheme for
inferring evolutionary trees from quartet topologies and its applications.
SIAM J Comput 2001, 30(6):1924-1961.
7. Bolaender H, Fellows M, Warnow T: Two strikes against perfect
phylogeny. Lecture Notes in Computer Science 1992, 623:273-283.
8. Dress A, Steel M: Convex tree realizations of partitions. Applied
Mathematics Letters 1992, 5(3):3-6.
9. Strimmer K, von Haeseler A: Quartet Puzzling: A quartet maximum-
likelihood method for reconstructing tree topologies. Molecular Biology
and Evolution 1996, 13(7):964-969.
10. Ranwez V, Gascuel O: Quartet-based phylogenetic inference:
improvements and limits. Mol Biol Evol 2001, 18(6):1103-1116.
11. Jiang T, Kearney P, Li M: Orchestrating quartets: approximation and data
correction. In Proceedings of the 39th IEEE Annual Symposium on
Foundations of Computer Science Edited by: Motwani R, Los Alamitos, CA
1998, 416-425.
12. John KS, Warnow T, Moret BME, Vawter L: Performance study of
phylogenetic methods: (unweighted) quartet methods and neighbor-
joining. Journal of Algorithms 2003, 48:173-193.
13. Snir S, Warnow T, Rao S: Short Quartet Puzzling: A New Quartet-Based
Phylogeny Reconstruction Algorithm. J Comput Biol 2008, 15:91-103.
14. Snir S, Rao S: Quartets MaxCut: A Divide and Conquer Quartets
Algorithm. IEEE/ACM Trans Comput Biol Bioinform 2010, 7(4):704-718.
15. Bansal M, Burleigh JG, Eulenstein O, Fernández-Baca D: Robinson-Foulds
Supertrees.
Algorithms for Molecular Biology 2010, 5:18.
16.
Holland
B, Conner G, Huber K, Moulton V: Imputing Supertrees and
Supernetworks from Quartets. Syst Biol 2007, 57:299-308.
17. Chen D, Diao L, Eulenstein O, Fernández-Baca D, Sanderson MJ: Flipping: a
supertree construction method. Bioconsensus, Volume 61 of DIMACS: Series
in Discrete Mathematics and Theoretical Computer Science American
Mathematical Society-DIMACS, Providence, Rhode Island; 2003, 135-160.
Swenson et al. Algorithms for Molecular Biology 2011, 6:7
/>Page 10 of 11
18. Burleigh JG, Eulenstein O, Fernández-Baca D, Sanderson MJ: MRF
supertrees. Phylogenetic Supertrees: Combining Information To Reveal The
Tree Of Life Bininda-Emonds ORP, Kluwer Academic, Dordrecht, the
Netherlands; 2004, 65-86.
19. Chen D, Eulenstein O, Fernández-Baca D, Burleigh JG: Improved heuristics
for minimum-flip supertree construction. Evol Bioinform 2006, 2:401-410.
20. Creevey CJ, McInerney JO: Clann: investigating phylogenetic information
through supertree analyses. Bioinformatics 2005, 21(3):390-392.
21. Ranwez V, Berry V, Criscuolo A, Fabre PH, Guillemot S, Scornavacca C,
Douzery EJP: PhySIC: a veto supertree method with desirable properties.
Syst Biol 2007, 56(5):798-817.
22. Foulds LR, Graham RL: The Steiner problem in phylogeny is NP-complete.
Adv in Appl Math 1982, 3(43-49):299.
23. Swenson MS, Barbançon F, Warnow T, Linder CR: A simulation study
comparing supertree and combined analysis methods using SMIDGen.
Algorithms for Molecular Biology 2010, 5:8.
24. Swofford DL, Olson GJ, Waddell PJ, Hillis DM: Phylogenetic Inference. 2
edition. Sinauer Associates, Sunderland, Massachusetts; 1996, 407-425.
25. Stamatakis A: RAxML-VI-HPC: Maximum likelihood-based phylogenetic
analyses with thousands of taxa and mixed models. Bioinformatics 2006,
22:2688-2690.
26. Nixon KC: The parsimony ratchet, a new method for rapid parsimony
analysis. Cladistics 1999, 15:407-414.
27. Rannala B, Huelsenbeck JP, Yang Z, Neilsen R: Taxon Sampling and the
Accuracy of Large Phylogenies. Syst Biol 1998, 47:702-710.
28. Thain D, Tannenbaum T, Livny M: Distributed computing in practice: the
Condor experience. Concurrency and Computation: Practice and Experience
2005, 17:323-356.
doi:10.1186/1748-7188-6-7
Cite this article as: Swenson et al.: An experimental study of Quartets
MaxCut and other supertree methods. Algorithms for Molecular Biology
2011 6:7.
Submit your next manuscript to BioMed Central
and take full advantage of:
• Convenient online submission
• Thorough peer review
• No space constraints or color figure charges
• Immediate publication on acceptance
• Inclusion in PubMed, CAS, Scopus and Google Scholar
• Research which is freely available for redistribution
Submit your manuscript at
www.biomedcentral.com/submit
Swenson et al. Algorithms for Molecular Biology 2011, 6:7
/>Page 11 of 11