Báo cáo sinh học: "Prediction of plant promoters based on hexamers and random triplet pair analysis" ppt
Bạn đang xem bản rút gọn của tài liệu. Xem và tải ngay bản đầy đủ của tài liệu tại đây (775.79 KB, 10 trang )
RESEARCH Open Access
Prediction of plant promoters based on
hexamers and random triplet pair analysis
A K M Azad
1
, Saima Shahid
2
, Nasimul Noman
3*
and Hyunju Lee
1*
Abstract
Background: With an increasing number of plant genome sequences, it has become important to develop a
robust computational method for detecting plant promoters. Although a wide variety of programs are currently
available, prediction accuracy of these still requires further improvement. The limitations of these methods can be
addressed by selecting appropriate features for distinguishing promoters and non-promoters.
Methods: In this study, we proposed two feature selection approaches based on hexamer sequences: the
Frequency Distribution Analyzed Feature Selection Algorithm (FDAFSA) and the Random Triplet Pair Feature
Selecting Genetic Algorithm (RTPFSGA). In FDAFSA, adjacent triplet-pairs (hexamer sequences) were selected based
on the difference in the frequency of hexamers between promoters and non-promoters. In RTPFSGA, random
triplet-pairs (RTPs) were selected by exploiting a genetic algorithm that distinguishes frequencies of non-adjacent
triplet pairs between promoters and non-promoters. Then, a support vector machine (SVM), a nonlinear machine-
learning algorithm, was used to classify promoters and non-promoters by combining these two feature selection
approaches. We referred to this novel algorithm as PromoBot.
Results: Promoter sequences were collected from the PlantProm database. Non-promoter sequences were
collected from plant mRNA, rRNA, and tRNA of PlantGDB and plant miRNA of miRBa se. Then, in order to validate
the proposed algorithm, we applied a 5-fold cross validation test. Training data sets were used to select features
based on FDAFSA and RTPFSGA, and these features were used to train the SVM. We achieved 89% sensitivity and
86% specificity.
Conclusions: We compared our PromoBot algorithm to five other algorithms. It was found that the sensitivity and
specificity of PromoBot performed well (or even better) with the algorithms tested. These results show that the
two proposed feature selection methods based on hexamer frequencies and random triplet-pair could be
successfully incorporated into a supervised machine learning method in promoter classification problem. As such,
we expect that PromoBot can be used to help identify new plant promoters. Source codes and analysis results of
this work could be provided upon request.
Background
Promoters are non-coding regions in genomic DNA that
contain information crucial to the activation or repres-
sion of downstream genes. Located upstream of the
transcription start site (TSS) of a gene, the promoter
region consists of certain short conserved DNA
sequences known as cis-elements or motifs, which are
recognized and bound by specif ic transcription factors
[1]. Transcriptional regulation of gene expression thus
depends on various interactions between these cis-ele-
ments and their respective transcription factors.
The accurate identification of promoters and TSS
localization remains a major challenge in bioinfo rmatics
due to the great degree of diversity observed in the gene
and species specific architectures of such regulatory
sequences. The first comprehensive review of publicly
available promoter prediction tools was made by Fickett
and Hatzigeorgiou [2]. However, this program demon-
strated a high rate of false positive prediction, mainly
because they relied on only one or two given sequence
* Correspondence: ;
1
Department of Information and Communications, Gwangju Institute of
Science and Technology, South Korea
3
Department of Electrical Engineering & Info Systems, Graduate School of
Engineering, University of Tokyo, Japan
Full list of author information is available at the end of the article
Azad et al. Algorithms for Molecular Biology 2011, 6:19
/>© 2011 Azad et al; licensee BioMed Central Ltd. This is an Open Access article distributed under the terms of the Creative Commons
Attribution License ( which permits unrestricted use, distri bution, and reproduction in
any medium, provided the original work is prop erly cited.
feature characteristics of the promoter region, such as
the presence of a TATA box or Initiator element. Ohler
[3] then integrated some physical properties of DNA,
such as DNA bendability and CpG content, along with
the sequence features in their propo sed method
(referred to as McPromoter), though their approach was
developed based on only a particular species, Droso-
phila. And Knudsen [4] developed Promoter 2.0 by
combining a neural network and a genetic algorithm
that recognized all five promoter sites on a positive
strandinacompleteAdenovirusgenome,butalso
included 30 false predictions. Another eukaryotic pro-
moter prediction algorithm, TSSW, had 42% accuracy
with one false positive per 789 bp [5]. It s hould also be
noted that most of these algorithms were trai ned exclu-
sively for a specific animal species, and as such their
prediction reliability further decreased when applied to
distant species, particularly plants.
The first promoter prediction tool trained and adapted
for plants was T SSP-TCM, created by Shahmuradov [6].
It used confi dence est imation along with a support vec-
tor machine (SVM) to predict plant pro moters. TSSP-
TCM correctly identified 35 out of 40 test TATA pro-
moters and 21 out of 25 TATA-less promoters; the pre-
dicted TSSs deviating 5-14 bp from their true positions
[6]. However, recent studies have sho wn that TATA
boxes and Initiators are not universal features for char-
acterizing plant promoters, and that other motifs such
as Y p atches may play a major role in the transcription
process in plants [7]. For example, around 50% of rice
genes contain Y patches in their promoter regions [8].
However, identification of the true promoter region in
long genomic sequences using known regulatory motifs,
such as TATA box or Y patch, is extremely difficult due
to the short length and degenerative nature of these ele-
ments. Hence, prediction methods based on a few
known elements may not provide the best results for
identifying promoters in plant genomes.
In order to devise a more effective approa ch for iden-
tifying plant promoters, several structural and sequence
dependent properties, such as curvature and periodicity
in experimentally validated promoters (both TATA-plus
and TATA-less types), were analyzed by Pandey [9].
The analysis revealed that the DNA curvature in promo-
ter regions was greater than that in gene containing
regions, indicating the possibility of distant sequences
being nearer to the core promoter elements and thus
affecting regulation of gene expression in the promoter
region. To improve the pro moter prediction, the use of
DNA structural properties such as bendability, B-DNA
twist, and duplex-free energy has been further explored
for several eukaryotic genomes, including plants [10,11].
And though each of these approaches has shown that a
distinct structural profile is associated with core
promoter regions, it is still unknown to what extent
such DNA-structural properties are relate d to the pre-
sence of known or novel regulatory elements in the
plant promoter. Hence, the possibility of distal elements
underlying such distinct structural patterns needs to be
further explored in order to more fully characterize the
actual promoter regions.
In most of the promoter prediction approaches cur-
rently available, only prot ein-coding sequ ences are used
as a non-promoter dataset for training. However, there
are other regions in genomic DNA that are neither cod-
ing regions nor promo ters. For example, miRNA, ribo-
somal RNA, a nd tRNA genes are not transla ted to
proteins but have their own promoters. These g enes
constitute a significant part of the genome that belongs
to non-promoter regions. Hence, building a non-promo-
ter dataset that consists of such RNA genes, along with
the protein-coding sequences, may improve program
efficiency in discriminati ng between promoter and non-
promoter sequences.
Recently, a novel a pproach (PromMachine) used a
characteristic tetramer frequency analysis along with
SVM to predict plant promoters [12]. In this approach,
all possible tetramer combinations for the nucleotides A,
T, G, and C (4
4
= 256) were gen erated. The most signifi -
cant tetramers (128 in total) were then taken as discrimi-
nating features between the promoters and non-
promoters. This approach was not dependent on the pre-
sence of TATA boxes or Initiator motifs, though it also
had several drawbacks. For example, the non-promoter
dataset used for trainin g was built only from the pro tein-
coding sequences, with no other non-promoter
sequences in cluded, such as non- coding RNA gene
sequences. Also, the program could not locate the TSS
position when the TATA box was not present [12]. This
limits the utility of PromMachine in detecting TSSs for a
huge number of plant promoters, as only ~19% of rice
genes and 29% of Arabidopsis genes contain TATA box
in their core promoters [8,13]. Since the prediction accu-
racy of PromMachine using 7-fold cross-validation was
~83.91%, the achievement of better accuracy still remains
a challenge. As such, the development of a standard vali-
dation protocol is important in order to determine the
best performing promoter prediction program. To this
end Abeel et al [14] proposed a set of validation proto-
cols for the fair evaluatio n of promoter prediction pro-
grams aiming to identify a gold standard. Among these
protocols, two were based on a binning approach (bins of
500 bp) in which each bin was checked to see whether it
overlapped with an experimentally known transcription
start region (TSR) or a known start position of a gene.
The remaining protocols were based on distance, in
which a prediction was considered to be correct if the
distance to the closest TSR was smaller than 500 bp.
Azad et al. Algorithms for Molecular Biology 2011, 6:19
/>Page 2 of 10
Based on their investigation they proposed a standard for
evaluating p romoter prediction software , and ide ntified
four highly performing software programs; although each
of these programs works on different principles and were
designed for different tasks [14].
In this study, we proposed two approaches for feature
selection that can improve prediction accuracies and ana-
lyze the concept of frequently occurring triplet pairs in
sequences. The first feature selection approach is the Fre-
quency Distribution Analyzed Feature Selection Algorithm
(FDAFSA), in which we counted the frequency of hexam-
ers (adjacent triplet pairs) in a d ataset. The second
approach is the Random Triplet Pair Feature Selecting
GeneticAlgorithm(RTPFSGA),whereweusedthe
genetic algorithm to find random triplet pairs (RTPs),
which randomly pairs two nonadjacent triplets. It should
be noted that the distribution of triplet frequencies has
been analyzed in many previous studies to identif y genes,
as the significance of nucleotide triplets that act as codons
in coding sequences is universally known. Recent studies
have also found that distant amino acids in protein
sequences may becom e adjacent in the tertiary structur e
and form l ocal spatial patte rns (LSP), which may play an
important role in the protein’s biological functionality
[15,16]. Hence, the distribution of triplet frequency may
also be useful for identifying promoter regions, as differen-
tial patterns of triplet over/under-representation have
been discovered in a large number of genomes from
diverse species over the last few years [17-19].
These observations support the concept of using RTP
as a discriminative feature. In our proposed RTPFSGA,
the triplets in each pair are essentially non-adjacent to
facilitate the analysis of distant triplets that may become
adjacent and act as pairs in three dimensional struc-
tures, and to enable identification of significant RTP dis-
tributions in coding and non-coding promoter
sequences for classification purposes. By combining dis-
tinct features selected by FDAFSA and RTPFSGA, and
SVM for classification of promoter and non-promoter
sequences, we developed PromoBot, as an alternative
technique for promoter identification. PromoBot was
found to be comparab le to, and even outperform, other
existing algorithms in classifying plant promoters.
Methods
Datasets
Two datasets were used in selecting features and esti-
mating the performance of the promoter classification
algorithm: the plant promoter sequence dataset, and the
non-promoter sequence dataset.
Plant promoter sequence database
For this study, 305 experimentally validated plant pro-
moter sequences, collected from the PlantProm database
[20], were used as a positive dataset. PlantProm is an
annotated, non-redundant collection of proximal pro-
moter sequences for RNA polymerase II from different
plant species. In the PlantProm database, all promoter
sequences have experimentally verified TSSs [20] and
sequence segments are f rom -200 to +51 bp relative to
TSS.
Non-promoter sequence database
A set of non-redundan t pl ant mRNA, tRNA, and rRNA
sequences of various species extracted from PlantGDB
[21] as well as miRNA precursor sequen ces downloaded
from miRBase [22] were used to construct the negative
dataset. We collected 305 sequences having ≥ 251 bp in
length from a list of different plant species (Additional
File 1). We had chosen a random start position in each
non-promoter sequence and then extracted 251 bp, so
that all promoter and non-promoter sequences are of
the same length.
Support vector machine
Support vector machine (SVM) is a supervised machine-
learning algorithm that is used to solve classification
and regression problems. For binary classifications, can-
didate input datasets are assumed to be two sets of vec-
tors in an n- dimensional space. SVM generates a hyper-
plane in the space and uses the maximum margin
between these two sets of vectors. Then, two parallel
hyper-planes on each side of the separating hyper-plane
are constructed to calculate the margin. In this method,
a good classification depends on the good separation of
spaces, which is accomplished via a hyper plane that
ensures a maximum distance to the neighboring data
points of both classes [23]. In this study, we used
LIBSVM />Feature selection
Success of SVM classification largely depends on the
features chosen. In this study, two different approaches
were proposed for feature selection: FDAFSA and
RTPFSGA. The final version, PromoBot, was built after
being trained using the SVM-TRAIN tool of LIBSVM,
based on the extracted distinc t features from these two
feature-selection approaches. In order to use the 5-fold
cross validation test, both the promoter and non-promo-
ter datasets were partitioned into 5 groups of pro moters
and 5 groups of non-promoters; 4 groups were used for
selecting features and the remaining group was used for
testing. Each set of training data contained 244 promo-
ters and 244 non-promoters, and each test data had 61
promoters and 61 non-promoters.
FDAFSA
In PromMachine [12], tetrame rs were used for the ana-
lysis. Here, we used a similar concept in FDAFSA but
Azad et al. Algorithms for Molecular Biology 2011, 6:19
/>Page 3 of 10
with hexamers, because we had empirical results that
hexamers provided better accuracy than PromMachine’ s
use of tetramers (further discussed in the Results sec-
tion). In both cases, training_data
k
for the k
th
test in a
5-fold cross validation was used for feature selection
and training, and test_data
k
was then used for testing.
All possible combinations of ‘A’, ‘T’, ‘C’, and ‘G’ for hex-
amers were 4,096 (= 4
6
). In FDAFSA, f
i, j
and fn
i, j
were
calculated first where f
i, j
was the frequency of i
th
hex-
amer in j
th
known promoter sequence and fn
i, j
was the
frequency of i
th
hexamer in j
th
known non-promoter
sequence in training_data
k
. We considered both strands
of each sequence (plus and minus strands) for hexamer
frequency analysis, and then CP
i
and CNP
i
were calcu-
lated using Eq. 1 and Eq. 2 respectively.
CP
i
=
n
j
=1
f
ij
(1)
,whereCP
i
was the total frequency of the i
th
hexamer
in all promoter sequences, and n was the number of
promoters in training_data
k
. Next,
CNP
i
=
n
j
=1
fn
i
j
(2)
, where CNP
i
was the summation of counts in all non-
promoter sequences for the i
th
hexamer, and n was the
number of non-promoters in training_data
k
.Theabso-
lute difference between the counts of these 4096 possi-
ble hexamers in the known promoter and non-promoter
sequences was subsequently calculated for the i
th
hex-
amer as follows:
Diff
i
=
|
CP
i
− CNP
i
|
(3)
We next sorted hexamers based on Diff
i
, and finally
we had hexamer_set
k
, which was defined as a collection
of 4,096 features obtained from each training_data
k
.
RTPFSGA
The motivation to use a genetic algorithm for this
approach was to iteratively select distantly related triplet
(trimer) pairs. A total of 64 possible triplets were gener-
ated and randomly paired during the initialization phase
of the genetic algorithm. To build the initial population,
we considered a fixed number of random triplet pairs
(RTPs) as an individual set of the initial population. Fre-
quencies of each candidate triplet in RTP
i
were counted
in all promoters and non-promoters in training_data
k
;
their minimum frequency value was then considered a s
the frequency of the particular RTP
i
. Observing both
promoter and non-promoter sequences in each trai-
ning_data
k
, each RTP
i
had two frequency values, defined
as X
1
and X
2,
respectively. For a particular RTP
i,
these
two frequency values were analyzed by a fitness
function, which in turn provided a fitness value for that
RTP
i
. In the fitness function, a two-tailed student’s t-test
was applied on these two frequency datasets. For this
t-test we formulated our problem as follows:
• The null hypothesis, μ
0
:
¯
X
1
=
¯
X
2
• The research hypothesis, μ
a
:
¯
X
1
=
¯
X
2
From the t-test, a t-value (Eq. 4) was obtained for each
RTP
i
, which was then used to calculate the density func-
tion f(t) (Eq. 5), thereby generating the p-value (Eq. 6)
using the density function.
t value =
¯
X
1
−
¯
X
2
variance(
¯
X
1
−
¯
X
2
)
(4)
f (t)=
gamma(
n +1
2
)
√
nπ × gamma(
n
2
)
× (1 +
t
2
n
)
−(
n +1
2
)
(5)
p value =2×
1 −
abs(t)
−α
f (t)dt
(6)
,where
¯
X
1
was the mean of X
1
,
¯
X
2
was the mean of
X
2
, t was the t-value from Eq. 4, abs(t) was the absolute
value of t,andn was the degree of freedom, which was
defined as follows:
n = n
1
+ n
2
− 2
(7)
,wheren
1
was the number of elements in X
1
,andn
2
was the number of ele ments in X
2
.Thep-value was
then considered as the fitness value for a particular
RTP
i
. The assumption was that any RTP
i
having a smal-
ler p-value than the others has a greater discriminating
power. Thus, any RTP
i
having a smaller p-value was
considered as a better fit than the others for the next
generation of genetic algorithms, where “Tournament
Selection” was used for the survival selectio n. The best-
fit individual between two randomly taken individuals
was chosen as the first parent P
1
, and the second parent
P
2
was chosen in the same way.
Two types of reproduction operators were used in this
algorithm: crossover and mutation. The threshold for
crossover probability used here was 0.8 and the muta-
tion probability was 0.05. At each step of reproduction,
two parent RTPs were checked for crossover. If the
probability was less than the threshold, the triplets of
both RTPs were swapped with each other. After every
crossover action, the mutation probability was checked
for every offspring. If the probability was less than the
mutation probability, we mutated the offsp ring. The
mutation logic was ver y simple. First, the part to be
Azad et al. Algorithms for Molecular Biology 2011, 6:19
/>Page 4 of 10
mutated was randomly selected, and we then randomly
selected a triplet to replace the mutated part. However,
we were cautious about the distinct existence of
mutated RTPs in the current population. If a mutated
RTP was already in the current population, we discarded
the cho ice and search for new mutated part. We gener-
ated random double values to simulate these probabil-
ities in order to compare with the corresponding
threshold probabilities. The threshold for mutation
probability was intentionally set to a relatively smaller
value compared to that of crossover so that mutation
happens less frequently than crossover.
After the reproduction phase, a fitness value was
ass igned into each child using the same fitness func tion
(as described above), and two different populations were
created: a parent or curren t population (μ), and a child
population (Ω). For the selection of survivors, the (μ +
Ω)g® μ mapping approach was used instead of (μ, Ω)
® μ, which means that the best-fit individuals (RTPs) in
the current population among μ and Ω were selected for
the next generation - instead of considering o nly μ or
Ω. Other parameter values of genetic algorithms, except
for crossover and mutation probability, were used are as
follows: the maximum population size in one generation
was 1,000, the number of reproductions in one genera-
tion was 500, the maximum child limit in one genera-
tion was 500, and the maximum number of generations
was 1,000. After tuning several times, these parameter
values were fixed (data not shown).
Results
Selection of significant features from FDAFSA
The accuracy of SVM classification largely depends on
the selected features. To select significant features from
FDAFSA, we trained our model using a different frac-
tion of features than the hexamer_set
k
of training_data
k
and tested our model with test_data
k
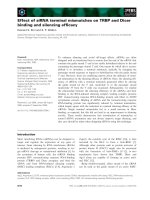
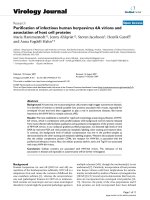
.Figure1shows
the average sensitivities and specificities of different
fractions of 4,096 features. As shown in the figure, the
top 25% and 35% feature selections from each hexam-
er_set
k
have the most significant average sensitivity and
selectivity at 0.84 and 0.86, respectively. Among these,
we selected the top 25% (1,024) features as hexamer_-
set’
k
from each hexamer_set
k
rather than the top 35%.
The reason for this is that we wanted to keep the size of
the feature set as small as possible thus avoiding overfit-
ting. Table 1 presents the top 10 ranked common hex-
amers from all 5 sets of hexamer_set’
k
.
We had chosen hexamers for our analysis because of
the empirical results indica ting hexamers performing
better than the tetramers used in PromMachine [12]
(Table 2). We used the same promoter and non-promo-
ter datasets for both methods. For FDAFSA, the average
sensitivity and specificity of the 5-fol d cross-validation
were measured using the top 25% features. We tested
the performance of PromMachine using our method.
The comparative study revealed that the average sensi-
tivities of these two algorithms were close, though the
average specificity of FDAFSA was higher than that of
PromMachine.
Selection of significant features from RTPFSGA
After several generations of RTPFSGA, the best-fit RTPs
having p-value <a-v alue (significanc e level) were
selected for RTP_set
k
for each training_data
k
. To select
the significance level, we trained our model wit h differ-
ent a-values (0.01, 0.001, 0.0001, 0.0 0001, and 0.000001)
from the RTP_set
k
of training_data
k
and then tested our
model with test_ data
k
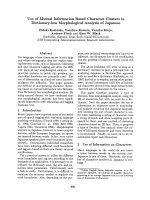
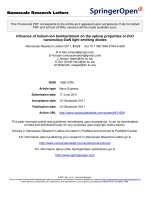
. Figure 2 shows the average
sensitivities and specificities for different a-values. The
maximum average specificity was 0.59 for a-value of
0.000001, while the average sensitivities for the other
Figure 1 Average sensitivities and specificities of the FDAFSA
method for the selection of a different fraction of features
from 4,096 features. The x-axis shows the fraction of selected
features from 4,096 features and the y-axis shows the average
sensitivity and specificity corresponding to the selected features.
Table 1 Top 10 common hexamers in a set of top 25%
features of FDAFSA from 5 data sets of 5-fold cross
validation.
Rank Common hexamers extracted from All 5 dataset (top 25%)
1 ATATAT
2 TATATA
3 ATATTT
4 TATAAA
5 AAAAAA
6 TTTTTT
7 AGAGAG
8 TCTCTC
9 CTCTCT
10 GAGAGA
Azad et al. Algorithms for Molecular Biology 2011, 6:19
/>Page 5 of 10
a-values were the same as 0.94. Therefore, we selected
the features having a p-value < 0.000001 and con-
structed RTP_set’
k
. Table 3 shows the 10 most common
RTPs for all RTP_set’
k
having a p-value < 0.000001
using RTPFSGA. The numbers of RTPs in RTP_set’
a
,
RTP_set’
b
, RTP_set’
c
, RTP_set’
d
,andRTP_set’
e
were 161,
200, 173, 167, and 180, respectively.
Combining features
The specificity of FDAFSA was significantly higher than
that of RTPFSGA. As shown in Figures 1 and 2, when
we chose the top 25% features from FDAFSA, the aver-
age specificity of the prediction was 0.86, and the aver-
age specificity for features selected by RTPFSGA using a
p -value < 0.000001 was 0.59. In contrast, the features
selected by RTPFSGA had a higher average sensitivity
when compared to the sensitivity from FDAFSA (0.94
and 0.84, respectively). Then, in an attempt to increase
both the sensitivity and specificity, we merged the two
feature sets in PromoBot. For each set of training_data
k
we had two feature sets: hexamer_set’
k
and RTP_set’
k
.
We selected only distinct features from these two
feature sets to build PromoBot. As RTPs were triplet
pairs, two hexamers could be formed from each RTP in
RTP_set’
k
. In order to construct a unique set of features,
the hexamer_set’
k
from FDAFSA was checked for the
presence of hexamers obtained from RTPs, and these
hexamers were subsequently excluded from hexamer_-
set’
k
. Finally, we made combined_feature_set
k
from each
training_data
k
, in which the numbers of features in five
combined sets were 1077, 1115, 1096, 1071, and 1097,
respectively.
Table 4 shows the prediction result using the combined
features. In the table, the averag e sen sitivity was 0.89 and
average specificity was 0.86 for promoter prediction
using combined features from FDAFSA and RTPSGA,
showing an overall enhancement in the classification
accuracy. Indeed, the promoter prediction accuracy was
signi ficantly increased when using combined_ feature_set
k
compared to that obtained using features selected by
only FDAFSA or RTPFSGA (Table 5).
Comparison with other methods
We compared PromoBot (FDAFSA and RTPFSGA) to
other available promoter prediction tools such as Neural
Network Promoter Prediction (NNPP) 2.2 [24], Promo-
ter 2.0 Prediction Server [4], TSSP-TCM [6], Promoter
Scan 1.7 [25], and PromMachine [12]. For this purpose,
the same training_data k was used for training Prom-
Machine and PromoBot since the 5-fold cross validation
was used for them. For the other tools, the training data
was not required. And the same test_data
k
was used for
testing all the tools. Then, using 5 test_data
k
datasets,
we measured the sensitivity and the specificity of all
tools and then too k average of these (Tabl e 6). The
comparative assessment showed that NNPP 2.2, TSSP-
TCM, and PromMachine had a notable accuracy level,
whereas Promoter Scan v1.7 and Promoter 2.0 demon-
strated poor predictability. In these tests, PromoBot was
Table 2 FDAFSA vs. PromMachine.
Methods (n-
mers used)
Average Sensitivity of 5-
fold cross validation (%)
Average Specificity of 5-
fold cross validation (%)
FDAFSA
(hexamers)
84* 86*
PromMachine
(tetramers)
86
+
81
+
*Accuracies are measured using the top 25% features from FDAFSA
sequences in 1-pass. The measurements are then averaged for 5-passes.
+
This result is generated by implementing the PromMachine algorithm by
ourselves using our dataset.
Figure 2 Average sensitivities and specificit ies of the RTPFSGA
method for different levels of significance (a-value). The x-axis
shows p-values less than the different a-values, and the y-axis
shows the average sensitivity and specificity corresponding to the
selected features.
Table 3 10 common RTPs in a set of RTPs having p-value
< 0.000001 of all 5 data sets using 5-fold cross
validation.
Rank Random Triplet Pair
(RTP)
1 AAA-AAA
2 AAA-AAT
3 AAA-AGA
4 AAA-ATC
5 AAA-ATT
6 AAA-CAT
7 AAA-TTT
8 AAC-ATA
9 AAC-CGA
10 AAC-CTG
Azad et al. Algorithms for Molecular Biology 2011, 6:19
/>Page 6 of 10
found to have a better average sensitivity and specificity
than that of NNPP 2.2 (threshold = 0.8). And though
there was only a slight improvement in PromoBot’s
average sensitivity over TSSP-TCM (~1%) and PromMa-
chine (~3%), the average specificity of PromoBot was
also marginally better than that of PromMachine (~5%)
and TSSP-TCM (2%).
Performance evaluation using experimentally validated
new promoters
In order to evaluate the performance of PromoBot
further, we applied the method to a new set of 271 pro-
moters with experimentally validated TSSs. This datase t
was downloaded from the recent release (2009.02) of
PlantProm database />phtml?topic=plantprom&group=data&subgroup=plant-
prom on January 2
nd
, 2011. Additional File 2 includes
information pertaining to gene ID, description, sequence
segment location, CDS location, and TSS location for
each of these promoters. All sequence segments were
from -200 to +51 bp relative to TSS. These new 271
promoters, used as test sequences, did not contain any
of the 305 promoter and 305 non-promoter sequences
which were used earlier for feature selection and train-
ing of PromoBot. We also compared our method with
TSSP-TCM. As shown in Table 7, PromoBot accurately
classified 235 sequences out o f 271 promoters as pro-
moter (86.72% success rate), whereas TSSP-TCM pre-
dicted 210 promoter sequences (77.49% success rate).
This result confirmed that PromoBot could perform bet-
ter than TSSP-TCM in detecting promoters.
Comparison of promoter prediction performance using
different negative datasets
We also evaluated the effect of using different types of
negative datas ets on promoter prediction. For this com-
parison, we collected plant miRNA seque nces from
miRBase [22] and took 305 sequences having a length
greater or equal to 240 bp. Similarly, we collected
mRNA and rRNA sequences from PlantGDB[21], select-
ing 305 sequences from each. In the case of rRNA, we
removed sequences having 80% redundancy using Jal-
view version 2[26] and considered sequences having a
length greater or equal to 140 bps.
Using a different type o f negative dataset in conjunc-
tionwiththesamepositivedataset(thepreviouslyused
305 promoters), we extracted features, trained our
method, and performed a 5-fold cross validation test in
the same way as discussed in the Methods section.
Table 8 shows the result of comparative performance
analysis between PromoBot and TSSP-TCM when dif-
ferent types of sequences were used as the negative
datasets. It should be noted that since TSSP-TCM did
not require training data set in order to test whether or
not the test sequence is a promoter, TSSP-TCM has
same sensitivity value (88%) for all the cases when we
tested 305 promoter sequences. But the sensitivities of
PromoBot varied because the same positive dataset in
combination with different negative dataset were used
for feature selection and the 5-fold cross-validation test
for each case. The overall performance using rRNA was
the best for both algorithms among the sampled ones.
The reason for such high performance using rRNA might
be due to the presence of redundant information in these
sequences. Even though we removed sequences having
80% redundancies, the high degree of conservation of
rRNA genes made it impossible to avoid overfitting.
Hence, we posit here that it may not be appropriate only
to use rRNA as the negative dataset.
In PromoBot–which used a combined negative dataset
in which only 40 non-redundant rRNA sequences are
included–the overall performance was higher than the
case of using only mRNA or miRNA as negative set.
The results show effectivity of combining mRNA, rRNA,
and miRNA, and tRNA in the construction of the nega-
tive set. When only miRNA was used as the negative
dataset, the specificities of both programs decreased,
though the specificity of TSSP-TCM was significantly
better than PromoBot (Table 8). Since discriminating
mRNA promoters from miRNA is not an easy task, but
an important c hallenge; further extensive investigations
are required for this task. We did not include tRNA
sequences for this analysis because there were very few
non-redundant tRNA sequences in PlantGDB[21], with
considerable variances in sequence length.
Table 4 Results of prediction test with combined features
from FDAFSA and RTPFSGA.
Test Dataset TP FN TN FP Sensitivity (%) Specificity (%)
test_data
a
56 5 52 9 92 85
test_data
b
54 7 52 9 89 85
test_data
c
54 7 55 6 89 90
test_data
d
52 9 51 10 85 84
test_data
e
55 6 51 10 90 84
Average 89 86
Table 5 Comparative accuracy of PromoBot with FDAFSA
and RTPFSGA.
Algorithm for
feature
selection
Average sensitivity for
5-fold cross validation
(%)
Average specificity for
5-fold cross validation
(%)
FDAFSA 84 86
RTPFSGA 94 59
PromoBot
[FDAFSA +
RTPFSGA]
89 86
Azad et al. Algorithms for Molecular Biology 2011, 6:19
/>Page 7 of 10
Discussion and conclusions
The comparative improvement of the accuracy rate of
promoter predictions by PromoBot indicates that using
the frequency distribution of hexamer sequences in
combination with RTP analys is can be effective in iden-
tifying promoters in plant genomes. This method also
has the potential to achieve improved accuracy in pro-
moter identification if extended to genomes of other
eukaryotic species.
In PromoBot, prediction results based on combined
features from FDAFSA and RTPFSGA outperformed
that based on features extracted from FDAFSA or
RTPFSGA alone (Table 5). In order to exhibit how two
distantly located triplets in RTPs effectively complemen-
ted the hexamers in FDAFSA, we tested the discrim ina-
tion power of hexamers produced by the concatenation
of two triplets in RTPs. For this task, w e considered
candidate_hex amer
1
to be the concatenation of the first
triplet followed by the second triplet in RTP, and candi-
date_hexamer
2
to be the concatenation of the second
triplet followed by the first triplet in the RTP. The dis-
crimination power of the two candidate hexamers (can-
didate_hexamer
1
and candidate_hexamer
2
)couldthen
be measured by the difference of the frequency between
promoters and non-promoters. The diff_RTP_hexamer
in the following equation represents this difference:
di
ff
RTP hexamer = |FD
RTP
− FD
Hexamer1
| + |FD
RTP
− FD
Hexamer2
|
(8)
,whereFD
RTP
was the frequency difference between
the RTP in promoters and that in non-promoters, and
FD
Hexamer1
and FD
Hexamer2
were the frequency differ-
ences of two candidate hexamers in promoters and non-
promoters for the given RTP, respectively. We found
that the discrimination power of two candidate hexam-
ers were smaller, compared to that of RFPFSGA (Addi-
tional File 3). Next, diff_RTP_hexamer values for 220
RTPs having a p -value < 0.000001 from all 305 promo-
ters and non-promoters were calculated, with the aver-
age value of 220 RTPs being 464 (Additional File 4).
Here, as candidate hexamers, we used the top 1024 hex-
amers from FDAFSA based on the difference between
frequencies in promoters and non-pro moters after
observing all 305 promoters and non-promoters. In
order to show the statistical significance of the observed
value of diff_RTP_hexamer, we compared the average
value of our observed case with the averages of N ran-
dom cases (Additional File 5). For a random case i,we
randomly generated 220 pairs of triplets, and calculated
diff_RTP_hexamer. The null hypothesis was that the
averages of random cases were greater or equal to the
average of our observed case. The p-value was calcu-
lated using Eq. 9 which is as follows:
p − value =
N
i
I{average of random case i average of observed value}
N
(9)
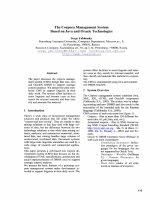
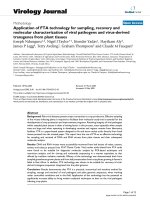
,whereN = 1,000. The average of the observed value
(464) had an empirical p-value of 0, as shown in Figure
3. Thus, the result confirmed that the RTPs had effec-
tively replaced the weak hexamers and demonstrated
their utility as strong features for prediction of plant
promoter regions.
Besides using two different algorithms for feature
selection, the prediction model in PromoBot has been
trained with experimentally identified promoter dataset
as well as negative dataset derived from four different
sources, i.e. miRNA, tRNA, rRNA and protein coding
mRNA genes. With the availability of a large number of
plant genome sequences, the accurate identification of
promoter regions from such non-coding RNA genes is
becoming important. Our analysis showed that the per-
formance of PromoBot varied depending on the negative
dataset and that the second highest sensitivity and speci-
ficity were achieved when the combination of mRNA,
miRNA, rRNA and tRNA gene sequences was used for
the negative set (Table 8). Although the use of rRNA
alone as the negative data yielded the highest sens itivity
and specificity, it might be du e to features selected from
highly conserved and redundant sequences of rRNA. In
the case of the negative dataset consisting of only
miRNA genes, the prediction performance was
decreased. One of the reasons for th is low performance
might be the length of miRNA precursor sequences.
Plant miRNA precursors are highly variable, with a
length ranging from 55-930 bp (average ~146 bp) [27].
Such variation limi ted our attempt to collect enough
miRNA precursor sequences having lengths equal to
Table 6 Comparison with other methods.
Statistical Measure (%) NNPP 2.2 (threshold = 0.8) TSSP-TCM Promoter Scan Version
1.7
Promoter
2.0
Prom-Machine PromoBot
Avg. Sensitivity 74 88 8 24 86 89
Avg. Specificity 70 84 4 34 81 86
Table 7 Performance evaluation using 271
experimentally validated promoters.
Algorithm No. of
sequences
No. of accurate
prediction
Percentage
(%)
TSSP-TCM 271 210 77.49
PromoBot 271 235 86.72
Azad et al. Algorithms for Molecular Biology 2011, 6:19
/>Page 8 of 10
that of the experimentally verified promoters. Features
collected from such sequences might be insufficient for
accurate discrimination of RNA pol II plant promoters
from miRNA genes. Also, miRNA genes may have other
strong features that are unrecognized by the FDAFSA
and RTPFSGA in PromoBot. In the future, statistical
and biological features of miRNA genes will be studied
in detail to fully utilize these features for improvement
of prediction algorithm.
Recently, a hierarchical stochastic language algorithm
that utilizes the analysis of hexamer occurrence frequen-
cies in DNA sequences has been shown to be successful
in accurately recognizing transcriptional regulatory
regions in several species including Arabidopsis and rice
[28]. This usefulness of hexamers in identifying promo-
ter sequences is also confirmed by our results (Table 5),
demonstrating high sensitivity and specificity (84% and
86%, respectively) in case of F DAFSA. Also, the utiliza-
tion of RTP alone in discriminating promoter and non-
promoter datasets resulted in highly improved sensitivity
(94%) in the test datasets. However, unlike hexamers,
use of RTP information did not yield high specificity.
This may be due to several reasons. First, the protein
coding sequences in the training dataset were obtained
from multiple species. While this approach is useful for
avoiding species specificity in the prediction method, it
also means that there was no specific codon usage bias
present in the collected protein sequences. Also, our
non-promoter dataset contained protein-coding
sequences and other non-coding gene sequences such as
tRNA and miRNA; such diversity may have caused
noise in the RTP analysis and it is quite possible that
the RTP analysis may have shown more specificity for
non-promoter sequences if the coding sequences were
taken from a single species. Nevertheless, we assumed
from the results that RTPs may also have some other
significance in the promoter regions of the genome, as it
was found that the DNA curvature of promoters is
higher than that of coding regions [9]. Thus, distal ele-
ments may become proximal to the core promoter ele-
ments and contribute to the regulation of gene
expression. However, a more detailed study is required
in order to explore and identify the significance of RTPs
in promoter regions in greater detail.
Additional material
Additional file 1: List of plant species. List of plant species from where
mRNA, tRNA, rRNA, and miRNA selected as non-promoter sequences. The
number of each type of RNA sequences is also included.
Additional file 2: New set of 271 experimentally validated
promoters. Sequence details of 271 experimentally validated promoters.
Information of gene ID, description, sequence segment location, CDS
location, and TSS location are included.
Additional file 3: Comparative performance analysis of RTPFSGA
with FDAFSA with respect to feature frequency. Frequency analysis of
220 RTP having a p-value < 0.000001 and a frequency analysis of
corresponding candidate hexamers found in 1,024 hexame rs (from
FDAFSA).
Additional file 4: Distribution of frequency for 1,000 random RTP
cases. Distribution of frequency for 1,000 random cases.
Additional file 5: Frequency analysis of the observed RTPs.
Frequency analysis that demonstrates the differential discr iminating
power between a particular RTPs and two corresponding candidate
hexamers.
Acknowledgements
This work was supported by the Basic Science Research Program through
the National Research Foundation (NRF) of Korea funded by the Ministry of
Education, Science and Technology (2010-0003597).
Table 8 Comparative assessment of performance using different negative datasets
Method Statistical Measure (%) miRNA only mRNA only rRNA only PromoBot
[miRNA + mRNA + rRNA + tRNA]
PromoBot Avg. Sensitivity 82.95 87.87 93.12 89
Avg. Specificity 59.67 84.26 95.08 86
TSSP-TCM Avg. Sensitivity 88 88 88 88
Avg. Specificity 75.41 80.98 96.06 84
Figure 3 The significance of RTPs compared to the hexamers
produced by two triplets in RTPs. Observed diff_RTP_hexamer
average value (464.49) was compared with 1000 random cases
where in each case, 220 random triplet pairs were generated and
the average of 220 diff_RTP_hexamer values was calculated.
Azad et al. Algorithms for Molecular Biology 2011, 6:19
/>Page 9 of 10
Author details
1
Department of Information and Communications, Gwangju Institute of
Science and Technology, South Korea.
2
Department of Biochemistry and
Molecular Biology, University of Dhaka, Bangladesh.
3
Department of Electrical
Engineering & Info Systems, Graduate School of Engineering, University of
Tokyo, Japan.
Authors’ contributions
AKMA developed and implemented a method to predict plant promoters
and wrote the manuscript. SS helped in collecting data sets and helped in
writing the manuscript. NN initiated and directed this research. HL directed
the research and helped in writing the manuscript. All authors read and
approved the final manuscript.
Competing interests
The authors declare that they have no competing interests.
Received: 20 January 2011 Accepted: 28 June 2011
Published: 28 June 2011
References
1. de Boer GJ, Testerink C, Pielage G, Nijkamp HJ, Stuitje AR: Sequences
surrounding the transcription initiation site of the Arabidopsis enoyl-acyl
carrier protein reductase gene control seed expression in transgenic
tobacco. Plant Mol Biol 1999, 39(6):1197-1207.
2. Fickett JW, Hatzigeorgiou AG: Eukaryotic promoter recognition. Genome
Res 1997, 7(9):861-878.
3. Ohler U, Niemann H, Liao G, Rubin GM: Joint modeling of DNA sequence
and physical properties to improve eukaryotic promoter recognition.
Bioinformatics 2001, 17(Suppl 1):S199-206.
4. Knudsen S: Promoter2.0: for the recognition of PolII promoter sequences.
Bioinformatics 1999, 15(5):356-361.
5. Solovyev V, Salamov A: The Gene-Finder computer tools for analysis of
human and model organisms genome sequences. Proc Int Conf Intell Syst
Mol Biol 1997, 5:294-302.
6. Shahmuradov IA, Solovyev VV, Gammerman AJ: Plant promoter prediction
with confidence estimation. Nucleic Acids Res 2005, 33(3):1069-1076.
7. Yamamoto YY, Ichida H, Abe T, Suzuki Y, Sugano S, Obokata J:
Differentiation of core promoter architecture between plants and
mammals revealed by LDSS analysis. Nucleic Acids Res 2007,
35(18):6219-6226.
8. Civan P, Svec M: Genome-wide analysis of rice (Oryza sativa L. subsp.
japonica) TATA box and Y Patch promoter elements. Genome 2009,
52(3):294-297.
9. Pandey SP, Krishnamachari A: Computational analysis of plant RNA Pol-II
promoters. Biosystems 2006, 83(1):38-50.
10. Abeel T, Saeys Y, Bonnet E, Rouze P, Van de Peer Y: Generic eukaryotic
core promoter prediction using structural features of DNA. Genome Res
2008, 18(2):310-323.
11. Gan Y, Guan J, Zhou S: A pattern-based nearest neighbor search
approach for promoter prediction using DNA structural profiles.
Bioinformatics 2009, 25(16):2006-2012.
12. Anwar F, Baker SM, Jabid T, Mehedi Hasan M, Shoyaib M, Khan H, Walshe R:
Pol II promoter prediction using characteristic 4-mer motifs: a machine
learning approach. BMC Bioinformatics 2008, 9:414.
13. Molina C, Grotewold E: Genome wide analysis of Arabidopsis core
promoters. BMC Genomics 2005, 6(1):25.
14. Abeel T, Van de Peer Y, Saeys Y: Toward a gold standard for promoter
prediction evaluation. Bioinformatics 2009, 25(12):i313-i320.
15. Kornev AP, Taylor SS, Ten Eyck LF: A helix scaffold for the assembly of
active protein kinases. Proc Natl Acad Sci USA
2008, 105(38):14377-14382.
16. Ten Eyck LF, Taylor SS, Kornev AP: Conserved spatial patterns across the
protein kinase family. Biochim Biophys Acta 2008, 1784(1):238-243.
17. Gorban AN, Zinovyev AY, Popova TG: Seven clusters in genomic triplet
distributions. In Silico Biol 2003, 3(4):471-482.
18. Majewski J, Ott J: Distribution and characterization of regulatory
elements in the human genome. Genome Res 2002, 12(12):1827-1836.
19. Albrecht-Buehler G: The three classes of triplet profiles of natural
genomes. Genomics 2007, 89(5):596-601.
20. Shahmuradov IA, Gammerman AJ, Hancock JM, Bramley PM, Solovyev VV:
PlantProm: a database of plant promoter sequences. Nucleic Acids Res
2003, 31(1):114-117.
21. Dong Q, Schlueter SD, Brendel V: PlantGDB, plant genome database and
analysis tools. Nucleic Acids Res 2004, 32(Database):D354-359.
22. Griffiths-Jones S, Saini HK, van Dongen S, Enright AJ: miRBase: tools for
microRNA genomics. Nucleic Acids Res 2008, 36(Database):D154-158.
23. Boser BE, Guyon IM, Vapnik VN: A Training Algorithm for Optimal Margin
Classifiers. Proceedings of the 5th Annual ACM Workshop on Computational
Learning Theory: 1992 Pittsburgh: ACM press; 1992, 144-152.
24. Reese MG: Application of a time-delay neural network to promoter
annotation in the Drosophila melanogaster genome. Comput Chem 2001,
26(1):51-56.
25. Prestridge DS: Predicting Pol II promoter sequences using transcription
factor binding sites. J Mol Biol 1995, 249(5):923-932.
26. Waterhouse AM, Procter JB, Martin DMA, Clamp Ml, Barton GJ: Jalview
Version 2 - a multiple sequence alignment editor and analysis
workbench. Bioinformatics 2009, 25(9):1189-1191.
27. Thakur V, Wanchana S, Xu M, Bruskiewich R, Quick W, Mosig A, Zhu XG:
Characterization of statistical features for plant microRNA prediction.
BMC Genomics 2011, 12(1):108.
28. Wang Q, Wan L, Li D, Zhu L, Qian M, Deng M: Searching for bidirectional
promoters in Arabidopsis thaliana. BMC Bioinformatics 2009, 10(Suppl):S29.
doi:10.1186/1748-7188-6-19
Cite this article as: Azad et al.: Prediction of plant promoters based on
hexamers and random triplet pair analysis. Algorithms for Molecular
Biology 2011 6:19.
Submit your next manuscript to BioMed Central
and take full advantage of:
• Convenient online submission
• Thorough peer review
• No space constraints or color figure charges
• Immediate publication on acceptance
• Inclusion in PubMed, CAS, Scopus and Google Scholar
• Research which is freely available for redistribution
Submit your manuscript at
www.biomedcentral.com/submit
Azad et al. Algorithms for Molecular Biology 2011, 6:19
/>Page 10 of 10