Báo cáo y học: " Persistence of lung inflammation and lung cytokines with high-resolution CT abnormalities during recovery from SARS" pot
Bạn đang xem bản rút gọn của tài liệu. Xem và tải ngay bản đầy đủ của tài liệu tại đây (2.3 MB, 12 trang )
BioMed Central
Page 1 of 12
(page number not for citation purposes)
Respiratory Research
Open Access
Research
Persistence of lung inflammation and lung cytokines with
high-resolution CT abnormalities during recovery from SARS
Chun-Hua Wang
†1
, Chien-Ying Liu
†1
, Yung-Liang Wan
2
, Chun-Liang Chou
1
,
Kuo-Hsiung Huang
1
, Horng-Chyuan Lin
1
, Shu-Min Lin
1
, Tzou-Yien Lin
3
,
Kian Fan Chung
4
and Han-Pin Kuo*
1
Address:
1
Department of Thoracic Medicine II, Chang Gung Memorial Hospital, Taipei, Taiwan,
2
Department of Diagnostic Radiology, Chang
Gung Memorial Hospital, Taipei, Taiwan,
3
Division of Pediatric Infectious Diseases, Chang Gung Children's Hospital, Taipei, Taiwan and
4
National Heart & Lung Institute, Imperial College & Royal Brompton Hospital, London, UK
Email: Chun-Hua Wang - ; Chien-Ying Liu - ; Yung-
Liang Wan - ; Chun-Liang Chou - ; Kuo-Hsiung Huang - ; Horng-
Chyuan Lin - ; Shu-Min Lin - ; Tzou-Yien Lin - ;
Kian Fan Chung - ; Han-Pin Kuo* -
* Corresponding author †Equal contributors
SARSalveolar macrophagesT lymphocytecoronaviruscytokinesbronchoalveolar lavage
Abstract
Background: During the acute phase of severe acute respiratory syndrome (SARS), mononuclear
cells infiltration, alveolar cell desquamation and hyaline membrane formation have been described,
together with dysregulation of plasma cytokine levels. Persistent high-resolution computed
tomography (HRCT) abnormalities occur in SARS patients up to 40 days after recovery.
Methods: To determine further the time course of recovery of lung inflammation, we investigated
the HRCT and inflammatory profiles, and coronavirus persistence in bronchoalveolar lavage fluid
(BALF) of 12 patients at recovery at 60 and 90 days.
Results: At 60 days, compared to normal controls, SARS patients had increased cellularity of BALF
with increased alveolar macrophages (AM) and CD8 cells. HRCT scores were increased and
correlated with T-cell numbers and their subpopulations, and inversely with CD4/CD8 ratio. TNF-
α, IL-6, IL-8, RANTES and MCP-1 levels were increased. Viral particles in AM were detected by
electron microscopy in 7 of 12 SARS patients with high HRCT score. On day 90, HRCT scores
improved significantly in 10 of 12 patients, with normalization of BALF cell counts in 6 of 12 patients
with repeat bronchoscopy. Pulse steroid therapy and prolonged fever were two independent
factors associated with delayed resolution of pneumonitis, in this non-randomized, retrospective
analysis.
Conclusion: Resolution of pneumonitis is delayed in some patients during SARS recovery and may
be associated with delayed clearance of coronavirus, Complete resolution may occur by 90 days
or later.
Published: 11 May 2005
Respiratory Research 2005, 6:42 doi:10.1186/1465-9921-6-42
Received: 09 March 2005
Accepted: 11 May 2005
This article is available from: />© 2005 Wang et al; licensee BioMed Central Ltd.
This is an Open Access article distributed under the terms of the Creative Commons Attribution License ( />),
which permits unrestricted use, distribution, and reproduction in any medium, provided the original work is properly cited.
Respiratory Research 2005, 6:42 />Page 2 of 12
(page number not for citation purposes)
Introduction
Severe acute respiratory syndrome (SARS) has affected
more than 8 thousand patients in 22 countries causing
774 deaths between July 2002 and September 2003 [1].
SARS-associated Coronavirus (SARS-CoV) has been iden-
tified as the causative agent [2]. Typical clinical manifesta-
tions include fever, cough, dyspnea and rapid progression
of pulmonary infiltration or consolidation [3]. The mean
mortality rate is 9.6% [1], mostly attributed to hypoxemic
respiratory failure. In the acute phase, typical pathological
findings in the lungs include mononuclear cells infiltra-
tion, alveolar cell desquamation and hyaline membrane
formation [4]. Those mononuclear cells may develop into
multinucleated giant cells [4]. Proinflammatory cytokines
released by alveolar macrophages may play a prominent
role in the pathogenesis in SARS [5]. Marked elevation of
inflammatory cytokines such as IL-1, IL-6 and IL-12, of
the Th1 cytokine, IFN-γ, and of chemokines IL-8, mono-
cyte chemoattractant protein-1 (MCP-1), and IFN-α-
induced protein-10 (IP-10) have been reported [6]. High
resolution Computed tomography (HRCT) findings at
presentation include as unilateral or bilateral ground-
glass opacities or focal unilateral or bilateral areas of con-
solidation [7-9]. Such residual abnormalities have been
described also after discharge from hospital at 36.5 days
and at 6-months [10,11]. However, limited information is
available on recovery of inflammatory abnormalities dur-
ing recovery from SARS, particularly at 60 days and
beyond
In the current study, we conducted a study to examine
HRCT changes in patients who recovered from the acute
phase of SARS at days 60 and 90, and measured the asso-
ciated inflammatory profiles directly by examining bron-
choalveolar lavage fluid (BALF). We also examined the
presence of coronavirus in BALF. We found persistence of
HRCT abnormalities and of lung inflammation at day 60,
and determined retrospectively the potential influence of
pulse corticosteroid therapy in this process.
Methods
Study subjects
Twelve (9 women and 3 men, aged 18 to 51 years) of 28
confirmed SARS patients who were treated in Chang Gung
Memorial Hospital in Taiwan between April and May
2003 during the last epidemic of SARS in Taiwan, agreed
to participate in this study. All the patients met the modi-
fied Centers for Disease Control and Prevention (CDC)
case definition of SARS [12]. SARS was confirmed by
either positive real-time polymerase chain reaction (PCR)
assays or elevated serum anti-coronavirus antibody by
ELISA or both. Nasopharyngeal-aspirate samples were
obtained from all study patients to exclude common
viruses including influenza viruses A and B, respiratory
syncytial (RSV) virus, adenovirus, and parainfluenzavirus
types 1, 2, and 3, using commercially-available immun-
ofluorescence assays (IFA). Sputum and blood cultures
were performed on all the cases to exclude bacterial or
fungal infections. At 90 days, all the close contact relatives
of the study SARS patients had their serum anti-coronavi-
rus antibody measured by ELISA.
Nine non-smoking healthy volunteers (5 women and 4
men, aged 18 to 40 years) without evident current or past
history of pulmonary diseases based on history as well as
physical, chest radiographic and bronchoscopic examina-
tions were selected as controls for this study. None of
them had any upper respiratory tract infection within the
last 6 weeks or was on antibiotics or other medications at
the time of evaluation.
Study protocol
The study protocol was approved by Chang Gung Memo-
rial Hospital Ethical Committee. Informed consent was
obtained from all the subjects. Treatment of SARS patients
on admission to our unit included broad spectrum antibi-
otics to target common pathogens causing community-
acquired pneumonia, according to current recommenda-
tions [13,14]. These patients received variable therapy reg-
imens, including oral ribavirin (1 g twice a day for 5–7
days), or intravenous immunoglobulin (IVIG, 1 g/kg
body weight/day for 2 days), pulse steroid therapy (meth-
ylprednisolone 500 mg twice a day for 3 days and then
prednisolone 1 mg/kg body weight/day for 5 days), or
maintenance corticosteroid therapy (prednisolone 10 mg
twice a day for more than 3 weeks). Pulse steroid therapy
was administered within 3 days of the onset of fever in
some patients, depending on the attending physicians'
decision irrespective of severity of presentation. Some
patients who did not receive pulse steroid therapy were
given a short course of corticosteroid therapy (hydrocorti-
sone 100 mg 3 times/day for 3 days) if there was rapid
deterioration of pulmonary infiltration or hypoxemia.
Maintenance steroid therapy (prednisolone 10 mg per day
for one week) was given after pulse or short course corti-
costeroid therapy in all patients. Two patients were intu-
bated with ventilator support because of hypoxemic
respiratory failure.
Patients underwent HRCT and BAL on the 60
th
and 90
th
day after the onset of disease. HRCT was performed with
1- to 2-mm collimation sections reconstructed by the use
of a high spatial frequency algorithm using a (General
Electric Medical Systems, Milwaukee, WI). The HRCT pro-
tocol consisted of thin sections obtained at 10-mm
through the chest in a supine position without using
intravenous contrast medium.
Respiratory Research 2005, 6:42 />Page 3 of 12
(page number not for citation purposes)
Scoring of HRCT findings
The HRCT findings, as previously described [9], were cat-
egorized the predominant pattern as: normal attenuation;
ground glass opacification (hazy areas of increased atten-
uation without obscuration of the underlying vessels);
consolidation (homogeneous opacification of the paren-
chyma with obscuration of the underlying vessels); reticu-
lar pattern; mixed pattern (combination of consolidation,
ground glass opacities and reticular opacities in the pres-
ence of architectural distortion); ground-glass attenuation
with traction bronchiolectasis or bronchiectasis; and hon-
eycomb pattern. The extent of involvement of each abnor-
mality was assessed independently for each of three
zones: upper (above the carina), middle (below carina up
to the inferior pulmonary vein), and lower (below the
inferior pulmonary vein). Each lung zone (total of 6 lung
zones) was assigned a score, modified from previously
described [9], based on the following: 0 when no involve-
ment, 1 when <25% involvement, 2 when 25 <50%
involvement; 3 when 50% <75% involvement and 4
when 75% involvement. Summation of scores provided
overall lung involvement (maximal CT score 24). The
grading of the patient's chest radiograph and HRCT was
the consensus of two observers who were blind to clinical
information of the patients.
Fibreoptic bronchoscopy and BAL
BAL was performed on all the study subjects using six aliq-
uots (50 ml each) of 0.9% saline solution as described
previously [15]. Briefly, sterile saline solution was intro-
duced into the subsegmental bronchus of the most
severely involved lobe. The BAL fluid was retrieved and
centrifuged. The supernatant was stored at -70°C until
analysis and the cell pellet was washed and resuspended
at 10
6
cells per ml. The cell viability and differential cell
counts were determined. Total RNA and DNA were
extracted from nasopharyngeal aspirates and cells
retrieved by BAL with the Viral RNA minikit and QIAmp
DNA minikit (QIAGEN, Hilden, Germany). Reverse-tran-
scriptase (RT) PCR was done for influenza A, adenovirus,
human metapneumovirus, and SARS-CoV as- described
previously [16].
Measurement of T cell subpopulations by flow cytometric
analysis
BAL cells were simultaneously stained with fluorescein
isothiocyanate or phycoerythrin-conjugated monoclonal
antibodies (anti-IgG1, -IgG2a, -CD3, -CD4, -CD8, -CD19,
-CD56) (Beckon Dickinson, Mountain View, CA) accord-
ing to the manufacturer's protocol to identify the propor-
tions of T lymphocytes, CD4, CD8 T cells, B cells and
natural killer (NK) cells subpopulations respectively. The
relative ratio of CD4 or CD8 in CD3-positive cells was
assayed by a dual-color analysis. Data were acquired and
analyzed using Becton Dickinson BD LYSYS II and Cyto-
metric Bead Array (CBA) software (San Jose, CA).
Levels of cytokine and chemokine in BAL fluid
The levels of cytokines and chemokines in BAL fluid were
assayed using Becton Dickinson (BD) Cytometric Bead
Array™ [17] (CBA; BD Biosciences, San Jose, CA) accord-
ing to manufacturer's instructions with an antibody
(PharMoingen, San Diego, CA) against one of five
cytokines (Human Chemokine Kit I: CXCL8/IL-8, CCL5/
RANTES, CXCL9/MIG, CCL2/MCP-1, CXCL10/IP-10, BD
Biosciences,) or of the six cytokines (Human Inflamma-
tion Kit: IL-8, IL-1β, IL-6, IL-10, TNF-α, IL-12, BD Bio-
sciences). Commercially available ELISA (R&D Systems,
Minneapolis) was used for measurement of the growth
factors, TGF-β, IGF-1 and EGF.
Electron microscopic (EM) examination
We used a previously-described method for virus detec-
tion by electron microscopy [18]. Cells retrieved by BAL
from SARS patients and normal subjects were centrifuged.
The cell pellets were fixed, embedded and stained with 4%
tannic acid and 0.5% uranyl acetate. The ultra-thin sec-
tions were cut from Epon-embedded blocks, stained with
uranyl acetate and lead citrate, and examined using a
transmission electron microscope (TEM) (H-500, Hitachi,
Tokyo, Japan).
Statistical analysis
Data are expressed as mean ± SEM. The baseline character-
istics, disease and laboratory variables between groups
were compared using the two-tailed Student t-test and chi-
square test, respectively. Spearman rank test was used to
determine correlations between HRCT scores and T cell
numbers, and their subpopulations, as well as CD4/CD8
ratio. Univariate analyses to determine the factors respon-
sible for persistence of HRCT abnormalities were prima-
rily used for selection of variables, based on a p value
<0.05. The significant variables were entered into a step-
wise logistic regression analysis to determine the net effect
for each predictor while controlling of the others. A p-
value <0.05 was considered as statistically significant.
Analysis was performed using SPSS software version 10.0
(Chicago, IL, USA).
Results
Study subjects
28 patients with confirmed diagnosis of SARS were admit-
ted during the study period. Sixteen patients received intu-
bation and ventilatory support for respiratory failure.
Three died of intractable hypoxemic respiratory failure.
Twenty-five patients recovered subsequently and were dis-
charged from the hospital. No patient relapsed with either
fever or new pulmonary infiltrates after discharge from
the hospital. Twenty of the 25 patients were randomly
Respiratory Research 2005, 6:42 />Page 4 of 12
(page number not for citation purposes)
selected into the protocol and twelve agreed to participate.
These patients complied with the protocol at 60 days but
at 90 days, only 10 of 12 patients agreed to have a repeat
HRCT, and 6 of 12 patients had a follow-up
bronchoscopy.
Clinical manifestations
At 60 days, the commonest symptoms in SARS patients
were general weakness (8 of 12 patients), exertional dysp-
nea (6 of 12 patients), joint pains (4 of 12 patients) and
partial hair loss (11 of 12 patients). At 90 days, all the 12
SARS patients were well without any of the above-
described symptoms. There was no detectable SARS-CoV
antibody in the sera of close contact relatives of the study
patients, even though SARS patients were not isolated
after discharge from hospital from their close relatives.
HRCT score
At 60 days, 5 SARS patients were found with an HRCT
abnormality of <10 % of the total lung field. In 3, the
score was zero, in one ground glass attenuation was found
in 7.5% of total lung field, and in another, there was con-
solidation in 1.7% of total lung field. The other 7 SARS
patients had HRCT abnormality > 10% of each lung field
(a mean of 37.5 ± 7.9% involvement of total lung field)
(Table 1). The most prominent HRCT findings in these
patients were ground-glass attenuation (80.8 ± 12.2% of
total abnormality on HRCT) and consolidation (13.6 ±
10.9% of total abnormality on HRCT). Honeycombing
and bronchiectatic changes were found in only 3 SARS
patients with high HRCT score (5.5 ± 2.7% of total abnor-
mality on HRCT). Seven of 11 patients were found normal
on their follow-up HRCT at 90 days (Table 2; Figure 1).
Two of the patients had persistently high HRCT scores
(Table 1). One with very high HRCT score at 60 days
refused a follow-up HRCT.
Factors associated with residual HRCT abnormalities at
day 60
The residual abnormality on HRCT at 60 days was related
to the clinical course. Univariate analysis identified 3 fac-
tors associated with the residual abnormality on HRCT.
There were a greater proportion of patients receiving pulse
steroid therapy (4 of 7) in patients with high HRCT score
(Table 2). In contrast, none of the patients with low HRCT
score received pulse steroid therapy (Table 2). There was
no significant difference in other therapy, including main-
tenance or short course corticosteroid therapy, IVIG or rib-
avirin, between patients with high HRCT score and those
with low HRCT score (Table 2). Patients with high HRCT
score had significantly longer course of fever and higher
serum SARS-CoV antibody titer when compared to those
in patients with low HRCT score (Table 2).
Inflammatory profiles of BAL fluid
At 60 days, compared to normal subjects, there was a sig-
nificant increase in total cell counts in BAL fluid from
SARS patients (Table 3) with a significant increase in alve-
olar macrophages (AM) and lymphocytes., The
proportion of CD8+ T cells was increased to a greater
extent than CD4+ T cells, leading to a significant decrease
in CD4/CD8 ratio (Table 4). There was also a significant
increase in the proportion of NK cells in SARS patients
(Table 4). There was no significant difference in B lym-
Table 1: Individual HRCT score at 60 and 90 days, and electron microscopic findings in patients with SARS
HRCT score Virus particle in AM by EM
60 days 90 days 60 days 90 days
Case 1 0 0 - N/D
Case 2 4 0 - -
Case 3 0 0 - N/D
Case 4 2 N/D - N/D
Case 5 3 0 - N/D
Case 6 9 0 + -
Case 7 12 3 + N/D
Case 8 11 0 + -
Case 9 12 7 + -
Case 10 13 2 + -
Case 11 15 12 + N/D
Case 12 24 N/D + -
Mean ± SE 8.8 ± 2.1 2.4 ± 1.3*
Abbreviation: HRCT, high resolution computed tomography; SARS, severe acute respiratory syndrome; AM, alveolar macrophage; EM, electron
microscopy; N/D, not done.
p < 0.01 indicates a comparison of HRCT score between 60 days and 90 days in corresponding group.
Respiratory Research 2005, 6:42 />Page 5 of 12
(page number not for citation purposes)
phocytes between SARS patients with low or high HRCT
scores and normal subjects. HRCT scores were highly cor-
related with the cell counts of total lymphocyte, CD4+
and CD8+ T cells, and inversely related to the CD4/CD8
ratio (Figure 2). At 90 days, the cellular profiles in BAL
fluid of 6 SARS patients were significantly improved com-
pared with those at 60 days, with near normalization
(Tables 3, 4).
Cytokine and chemokine level in BAL fluid
At 60 days, SARS patients had a significantly higher level
of chemokines, IL-8, MCP-1, and RANTES (Table 5), and
of pro-inflammatory cytokines, TNF-α and IL-6. However,
the growth factors, transforming growth factor-β (TGF-β),
epidermal growth factor (EGF), insulin-like growth factor-
1 (IGF-1), were not increased (Table 5).
Virus detection
The 12 enrolled patients had serological evidence of
recent infection with the SARS-CoV and in seven, viral
RNA was detected in samples taken from nasopharyngeal
aspirate or stool. However, viral RNA was not detectable
in the stool or nasopharyngeal aspirate of any of the SARS
patients at 60 days. Healthy controls had no evidence of
SARS-CoV antibody or RNA in the serum or the respira-
tory tract. There were no detectable common viruses
including influenza viruses A and B, RSV virus, adenovi-
rus, human metapneumovirus, and parainfluenzavirus
types 1, 2, and 3, using IFA for nasopharyngeal aspirates
or using RT-PCR assay for cells retrieved by BAL at 60 or
90 days. Serological studies for Clamydia, Mycoplasma or
Legionella were negative in all subjects.
At 60 days, EM examination of BAL fluid revealed many
coronavirus-infected alveolar macrophages with intracel-
lular viral particles in 7 of 12 patients (Figure 3; Table 1).
These patients had the high HRCT scan scores. Coronavi-
rus infected cells were not detected in any of SARS patients
with low HRCT score or in normal subjects (Table 1). RT-
PCR amplification of coronavirus nucleic acids was posi-
tive in 3 of 7 patients with high HRCT score, but in none
of patients with low HRCT score or normal subjects. At 90
days, EM examination did not detect any coronavirus-
infected cells in 6 SARS patients, in 5 of the 6, viral
inclusions were found in AM at day 60 (Table 1). One
patient with persistent high HRCT score (case 12) refused
follow-up BAL study at 90 days.
Discussion
This study was performed during the last epidemic of
SARS in Taiwan, and the number of patients recruited has
been limited. The epidemic did not recur during 2004,
and there have been no further cases of SARS in Taiwan,
such that we were not able to increase the number of
patients in this study. Despite the relatively low numbers,
our observations indicate that there are persistent impor-
tant inflammatory and radiological abnormalities in
some patients who have recovered from acute SARS at 60
Table 2: Univariate and multivariate analysis: predictors based on presence of virus particle and lung involvement in patients with
SARS.
Factor Low HRCT
score and
Absence of virus
particle
(n = 5)
no. (%)
High HRCT
score and
Presence of
virus particle
(n = 7)
no. (%)
Univariate analysis Multivariate
analysis
P value Odd ratio 95% confidence
interval
P value
Age, year 25.6 ± 4.2 34.9 ± 2.9 0.09 - - -
Female gender 5 (100%) 4 (57.1%) 0.09 1.75 0.92–3.32 -
Titer of Anti-CoV IgG (OD) * 0.8 ± 0.2 1.3 ± 0.1 0.04 - - 1.0
Days of fever 4.2 ± 0.5 11.0 ± 1.0 0.0003 - - 0.011
Positive PCR 2 (28.6%) 5 (71.4%) 0.276 3.75 0.33–42.47 -
Use of ribavirin 4 (57.1%) 6 (85.7%) 0.79 1.50 0.71–31.58 -
Use of IVIG 4 (57.1%) 6 (85.7%) 0.79 1.50 0.71–31.58 -
Pulse corticosteroid therapy 0 (0%) 4 (57.1%) 0.04 2.33 0.99–5.49 0.004
Maintenance corticosteroid therapy 0 (0%) 3 (42.9%) 0.09 1.75 0.92–3.32 -
Need for intubation 1 (14.3%) 1 (14.3%) 0.79 0.67 0.03–14.03 -
Abbreviation: HRCT, high resolution computed tomography; SARS, severe acute respiratory syndrome; IVIG, intravenous immunoglobulin; CoV,
coronavirus; OD, optical density; PCR, polymerase chain reaction. Data are shown as mean ± SEM.
*The cut value of positive SARS infection is 0.12 OD.
Respiratory Research 2005, 6:42 />Page 6 of 12
(page number not for citation purposes)
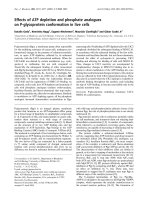
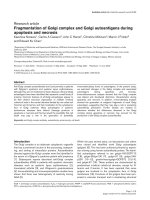
Residual abnormality on HRCT of a SARS patient with high HRCT score at 60 days (A)Figure 1
Residual abnormality on HRCT of a SARS patient with high HRCT score at 60 days (A). HRCT became almost normal at 90
days (B).
Respiratory Research 2005, 6:42 />Page 7 of 12
(page number not for citation purposes)
days after the illness. These changes were those of ground-
glass or/and consolidation abnormalities which may be
overlooked on examination of plain chest radiographs.
The BAL fluid examination performed for the first time in
recovering SARS patients confirmed the presence of an on-
going active inflammatory process in most patients with
increased macrophages, NK cells and T cells, and aug-
mented levels of chemokines and pro-inflammatory
cytokines. These inflammatory responses may be elicited
by the persistent presence of coronavirus in alveolar mac-
rophages, since the patients with the highest HRCT
changes had coronaviruses present and there was no evi-
dence of bacterial or other viral infection in these patients.
Most viral diseases are characterized by the development
of a specific infiltration consisting predominantly of
Table 3: Characteristics of bronchoalveolar lavage in normal subjects and patients with SARS
Normal subjects SARS patients
60 days 90 days
(n = 9) (n = 12) (n = 6)
Age (years) 24.1 ± 2.2 34.0 ± 2.7* 36.6 ± 3.9
Female gender 5 4 3
Cellularity (10
4
cells/ml) 9.6 ± 0.9 32.9 ± 9.0* 26.2 ± 9.1
Cell viability (%) 91.5 ± 4.3 90.4 ± 1.3 91.6 ± 1.8
AM (%) 93.2 ± 1.2 88.8 ± 1.2* 95.0 ± 0.6†
AM (10
4
cells/ml) 8.9 ± 0.8 29.0 ± 7.8* 25.1 ± 9.8
Lymphocytes (%) 5.9 ± 1.2 10.2 ± 1.2* 4.1 ± 0.5†
Lymphocytes (10
4
cells/ml) 0.6 ± 0.1 3.8 ± 1.2* 1.0 ± 0.2†
Neutrophils (%) 0.9 ± 0.2 0.7 ± 0.2 0.9 ± 0.6
Neutrophils (10
4
cells/ml) 0.1 ± 0.02 0.2 ± 0.1 0.2 ± 0.1
Eosinophils (%) 0.1 ± 0.1 0.3 ± 0.2 0.0 ± 0.0
Eosinophils (10
4
cells/ml) 0.01 ± 0.01 0.05 ± 0.04 0.0 ± 0.0
Abbreviation: AM, alveolar macrophages; HRCT, high resolution computed tomography; SARS, severe acute respiratory syndrome.
*p < 0.01 compared with normal subjects.
† p < 0.05 compared with SARS patients at 60 days.
Data are mean ± SEM.
Table 4: Lymphocyte subpopulations in bronchoalveolar lavage from normal subjects and patients with SARS
Normal subjects SARS patients
60 days 90 days
(n = 9) (n = 12) (n = 6)
Lymphocytes (10
3
cells/ml) 5.8 ± 1.4 39.2 ± 12.1* 9.7 ± 2.4
†
CD3 cells (%) 39.7 ± 6.4 33.1 ± 6.7 37.8 ± 6.1
CD3 cells (10
3
cells/ml) 2.4 ± 0.5 16.3 ± 6.4* 3.3 ± 0.7
CD4 cells (%) 9.2 ± 2.6 8.7 ± 2.2 10.4 ± 4.3
CD4 cells (10
3
cells/ml) 1.2 ± 0.3 4.4 ± 2.0* 0.8 ± 0.3
CD8 cells (%) 6.6 ± 2.6 20.1 ± 5.5* 13.2 ± 3.3
CD8 cells (10
3
cells/ml) 0.7 ± 0.1 11.8 ± 4.7* 1.1 ± 0.2
†
CD4/CD8 (ratio) 1.89 ± 0.22 0.62 ± 0.12* 0.73 ± 0.12
†
B cells (%) 6.7 ± 1.2 3.2 ± 0.8 2.8 ± 0.6
B cells (10
3
cells/ml) 0.4 ± 0.1 1.4 ± 0.7 0.3 ± 0.1
NK cells (%) 1.8 ± 0.2 8.8 ± 2.6* 5.8 ± 2.1
NK cells (10
3
cells/ml) 0.1 ± 0.03 4.0 ± 2.4** 0.3 ± 0.1
†
Abbreviation: HRCT, high resolution computed tomography; NK, natural killer.
*p < 0.05, ** p < 0.01 compared with normal subjects.
†p < 0.05 compared with SARS patients at 60 days.
Data are mean ± SEM.
Respiratory Research 2005, 6:42 />Page 8 of 12
(page number not for citation purposes)
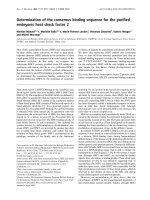
Correlation of the cell counts of (A) total lymphocytes, (B) CD4 and (C) CD8 T cells, or the (D) CD4/CD8 ratio with HRCT scores in SARS patientsFigure 2
Correlation of the cell counts of (A) total lymphocytes, (B) CD4 and (C) CD8 T cells, or the (D) CD4/CD8 ratio with HRCT
scores in SARS patients. The analysis is made by Spearman rank test and the number and significance are indicated.
0 5 10 15 20 25
0
25
50
75
100
125
150
r
s
=0.9 08, n=12, p<0.0001
High reso lution CT scores
Total lympho cytes (10
3
cells/ml)
0 5 10 15 20 25
0
5
10
15
20
25
r
s
=0.702, n=12, p=0.011
High resolution CT scores
CD4 T cells (10
3
cells/ml)
0 5 10 15 20 25
0
10
20
30
40
50
r
s
=0.870, n=12, p=0.0002
High resolution CT scores
CD8 T cells (10
3
cells/ml)
0 5 10 15 20 25
0.00
0.25
0.50
0.75
1.00
1.25
1.50
1.75
r
s
=-0.772, n=12, p =0.0033
High resolutio n CT scores
CD4/CD8 ratio
A
B
C
D
Respiratory Research 2005, 6:42 />Page 9 of 12
(page number not for citation purposes)
mononuclear leukocytes while neutrophils are absent
[19]. The most striking features of alveolar inflammation
in patients were increased numbers of alveolar macro-
phages, T lymphocytes and NK cells, with a striking
decrease in CD4/CD8 ratio. The HRCT score was highly
correlated with T lymphocyte numbers and their subpop-
ulations, and was inversely related to CD4/CD8 ratio.
CD8+ T cells may act as cytotoxic cells and are key effec-
tors of virus clearance [20]. The concurrent increase in
CD4+ T cells may promote the clonal expansion of virus-
specific CD8+ T cells and is essential for maintaining con-
tinued CD8+ T cells surveillance and effector capacity
[19].
Exposure of monocytes or macrophages to viruses causes
the release of proinflammatory cytokines, such as TNF-α,
IL-1, and IL-6, and chemokines [20-22] as well as mem-
bers of the CC-chemokine subfamily such as MIP-lα,
MCP-1, and RANTES which preferentially attract mono-
cytes and lymphocytes [22]. The CXC-chemokines, such
as IL-8 or GRO-α, are major neutrophil chemoattractants
[23]. MIG/CXC chemokine ligand (CXCL) 9 and IP-10/
CXCL10, both inducible by interferon-γ, are ELR-negative
CXC chemokines and are potent chemoattractants for
mononuclear cells, specifically activated T lymphocytes
and NK cells [24]. In this report, we demonstrated ele-
vated levels of TNF-α, IL-6, MCP-1, RANTES and IL-8 in
BAL fluid in SARS patients compared to those of normal
subjects. Increased secretion of TNF-α and IL-6 may be
derived from virus-infected macrophages or from CD4+
or CD8+ T cells, and these cytokines may promote T-lym-
phocyte extravasation and macrophage activation [19],
but such processes may not be sufficient on their own to
recruit and activate mononuclear cells in virus-infected
lungs. The increased levels of MCP-1 and RANTES in BAL
fluid of all SARS patients may be responsible for the gen-
eration of mononuclear infiltrates observed after
coronavirus infection. IP-10 and MIG, whose levels are
also increase in SARS patients, recruit monocytes and
macrophages, NK cells and activated, but not resting T
lymphocytes [25,26].
Although there were increased levels of IL-8 in BAL fluid
in SARS patients, the number of neutrophils in BALF were
sparse. The absence of neutrophil infiltration in influenza
A virus or respiratory syncytial viruses (RSV) infection is
attributed to the suppression of neutrophil attracting
CXC-chemokines or by induction of IL-10 [27]. However,
IL-8 production can be induced by measles virus infection
of fibroblasts [28] and by influenza A virus, RSV and rhi-
novirus in pulmonary epithelial cells or AM [28-31]. The
reasons for the lack of neutrophil recruitment in response
to elevated IL-8 levels in SARS patients are not known and
this deserves further investigation.
Despite the presence of virus in AM at 60 days when
patients had already been discharged from hospital, these
patients were not infectious, because none of their close
contact relatives developed any detectable SARS-CoV
antibody in their sera. The HRCT and the clinical course
until the 90th day of illness did not suggest any evidence
of pulmonary fibrosis in SARS patients. This was in accord
with the low level of cytokines and growth factors respon-
sible for tissue repairing and fibrosis [32], such as IL-1β,
TGF-β, IGF-1, and EGF detected in BAL fluid. However,
evidence of fibrosis on HRCT has been obtained on HRCT
scans particularly in patients with very severe disease dur-
ing the acute phase of SARS [33].
Table 5: Cytokine and chemokine levels in bronchoalveolar lavage from normal subjects and SARS patients
Normal subjects (n = 9) SARS patients (n = 12)
CXCL10/IP-10 (pg/ml) 95.8 ± 25.7 133.1 ± 37.5
CXCL9/MIG (pg/ml) 20.2 ± 6.5 53.1 ± 14.1*
IL-8 (pg/ml) 1.5 ± 0.2 6.3 ± 1.0**
CCL2/MCP-1 (pg/ml) 2.4 ± 0.8 9.0 ± 1.2**
CCL5/RANTES (pg/ml) 1.0 ± 0.4 34.6 ± 9.3**
TNF-α (pg/ml) 0.004 ± 0.002 1.1 ± 0.3*
IL-1β (pg/ml) 0.00 ± 0.00 2.5 ± 1.8
IL-6 (pg/ml) 0.001 ± 0.001 1.7 ± 0.5**
IFN-γ (pg/ml) 0.0 ± 0.0 0.4 ± 0.3
IL-2 (pg/ml) 0.00 ± 0.00 0.4 ± 0.2
TGF-β (pg/ml) 9.6 ± 2.9 15.4 ± 4.6
IGF-1 (ng/ml) 0.06 ± 0.03 0.07 ± 0.05
EGF (pg/ml) 0.0 ± 0.0 0.0 ± 0.0
* p < 0.05, ** p < 0.01 compared with normal subjects.
Data are shown as mean ± SEM.
Respiratory Research 2005, 6:42 />Page 10 of 12
(page number not for citation purposes)
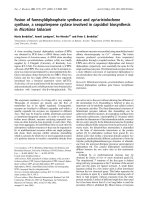
Ultrastructural characteristics of a coronavirus-infected cell in BAL fluid from a SARS patient at 60 days, with several intracel-lular particlesFigure 3
Ultrastructural characteristics of a Coronavirus-Infected cell in BAL fluid from a SARS patient at 60 days, with several intracel-
lular particles. The virions are indicated by the arrowheads in Panel A. Panel B shows the area indicated by the asterisk in Panel
A at higher magnification. The bar in Panel A (500 nm) and Panel B (100 nm) is indicated.
Respiratory Research 2005, 6:42 />Page 11 of 12
(page number not for citation purposes)
The use of corticosteroids together with ribavirin has been
reported to confer clinical benefit, although randomized
clinical trials to support its clinical efficacy are not availa-
ble. Pulse steroid therapy was reported to lead to less oxy-
gen requirement, better radiographic outcome, and less
likelihood to require rescue pulse steroid therapy than
their counterparts [34]. However, corticosteroids have
been shown to increase mortality of pneumovirus-
infected mice by accelerating replication of virus [35].
Pulse steroid therapy was also reported to be associated
with residual abnormality on HRCT in SARS patients after
discharge from hospital [10]. In the current retrospective,
non-randomized series, pulse steroid therapy appeared to
be associated with delayed resolution of pneumonitis. We
have planned a prospective future study on investigating
the effect of pulse steroid therapy in case of future
outbreaks of SARS. This is because this issue is extremely
important in outcome from SARS.
In conclusion, a proportion of recovered SARS patients
have delayed resolution of pneumonitis and delayed
clearance of coronavirus in the alveolar space at day 60.
This was associated with persistent inflammatory
response characterized by macrophages, T cells particu-
larly CD8+ T cells, and NK cells, and by increase in
cytokines and chemokines. This host inflammatory
response against SARS-CoV infection may contribute to
persistent HRCT abnormalities during recovery phase of
SARS. On the other hand, we found no evidence of pul-
monary fibrosis in SARS patients during recovery. At day
90, many of the abnormalities have disappeared. Patients
recovering from SARS need to be followed up for at least
3 months after the infection.
Acknowledgements
This project was supported by CMRP-32012S from Chang Gung Memorial
Hospital.
References
1. Cumulative number of reported probable cases of severe
acute respiratory syndrome (SARS) Geneva: World Health Organ-
ization 2003 [ />]. Accessed
September 26, 2003
2. Ksiazek TG, Erdman D, Goldsmith CS, Zaki SR, Peret T, Emery S,
Tong S, Urbani C, Comer JA, Lim W, Rollin PE, Dowell SF, Ling AE,
Humphrey CD, Shieh WJ, Guarner J, Paddock CD, Rota P, Fields B,
DeRisi J, Yang JY, Cox N, Hughes JM, LeDuc JW, Bellini WJ, Anderson
LJ, SARS Working Group: A Novel coronavirus associated with
severe acute respiratory syndrome. N Engl J Med 2003,
348:1953-1966.
3. Poutanen SM, Low DE, Henry B, Finkelstein S, Rose D, Green K, Tell-
ier R, Draker R, Adachi D, Ayers M, Chan AK, Skowronski DM, Salit
I, Simor AE, Slutsky AS, Doyle PW, Krajden M, Petric M, Brunham RC,
McGeer AJ, National Microbiology Laboratory, Canada; Canadian
Severe Acute Respiratory Syndrome Study Team: Identification of
severe acute respiratory syndrome in Canada. N Engl J Med
2003, 348:1993-2003.
4. Tse GMK, To KF, Chan PKS, Lo AWI, Ng KC, Wu A, Lee N, Wong
HC, Mak SM, Chan KF, Hui DSC, Sung JJY, Ng HK: Pulmonary
pathological features in coronavirus associated severe acute
respiratory syndrome (SARS). J Clin Pathol 2004, 57:260-265.
5. Nicholls JM, Poon LL, Lee KC, Ng WF, Lai ST, Leung CY, Chu CM,
Hui PK, Mak KL, Lim W, Yan KW, Chan KH, Tsang NC, Guan Y, Yuen
KY, Peiris JS: Lung pathology of fatal severe acute respiratory
syndrome. Lancet 2003, 361:1773-1778.
6. Wong CK, Lam CWK, Wu AKL, Ip WK, Lee NLS, Chan HIS, Lit
LCW, Hui DSC, Chan MHM, Chung SSC, Sung IJY: Plasma inflam-
matory cytokines and chemokines in severe acute respira-
tory syndrome. Clin Exp Immunol 2004, 136:95-103.
7. Tsang KW, Ho PL, Ooi GC, Yee WK, Wang T, Chan-Yeung , Lam
WK, Seto WH, Yam LY, Cheung TM, Wong PC, Lam B, Ip MS, Chan
J, Yuen KY, Lai KN: A cluster of cases of severe acute respira-
tory syndrome in Hong Kong. N Engl J Med 2003, 348:1977-1985.
8. Muller NL, Ooi GC, Khong PL, Zhou LJ, Tsang KWT, Nicolaou S:
High-resolution CT findings of severe acute respiratory syn-
drome at presentation and after admission. AJR 2004,
182:39-44.
9. Ooi GC, Khong PL, Muller NL, Yiu WC, Zhou LJ, Ho JCM, Lam B,
Nicolaou S, Tsang KW: Severe acute respiratory syndrome:
temporal lung changes at thin-section CT in 30 patients. Radi-
ology 2004, 230:839-844.
10. Antonio GE, Wong KT, Hui DS, Wu A, Lee N, Yuen EH, Leung CB,
Rainer TH, Cameron P, Chung SS, Sung JJ, Ahuja AT: Thin-section
CT in patients with severe acute respiratory syndrome fol-
lowing hospital discharge: preliminary experience. Radiology
2003, 228:810-815.
11. Ng CK, Chan JW, Kwan TL, To TS, Chan YH, Ng FY, Mok TY: Six
month radiological and physiological outcomes in severe
acute respiratory syndrome (SARS) survivors. Thorax 2004,
59:.
12. Centers for Disease Control and Prevention: Severe acute respi-
ratory syndrome (SARS) updated interim US case defini-
tion. 2003 [ />].
Accessed April 22, 2003
13. Bartlett JG, Dowell SF, Mandell LA, File TM Jr, Musher DM, Fine MJ:
Practice guidelines for the management of community-
acquired pneumonia in adults. Clin Infect Dis 2000, 31:347-382.
14. Guidelines for the management of adults with community-
acquired pneumonia: diagnosis, assessment of severity, anti-
microbial therapy, and prevention. Am J Respir Crit Care Med
2001, 163:1730-1754.
15. Wang CH, Liu CY, Lin HC, Yu CT, Chung KF, Kuo HP: Increased
exhaled nitric oxide in active pulmonary tuberculosis due to
inducible nitric oxide synthase upregulation in alveolar
macrophages. Eur Respir J 1998, 11:809-815.
16. Drosten C, Gottig S, Schilling S, Asper M, Panning M, Schmitz H,
Gunther S: Rapid detection and quantification of RNA of
Ebola and Marburg viruses, Lassa virus, Crimean-Congo
hemorrhagic fever virus, Rift Valley fever virus, dengue virus,
and yellow fever virus by real-time reverse transcription-
PCR. J Clin Microbiol 2002, 40:2323-2330.
17. Aoe K, Hiraki A, Murakami T, Murakami K, Makihata K, Takao K, Eda
R, Maeda T, Sugi K, Darzynkiewicz Z, Takeyama H: Relative abun-
dance and patterns of correlation among six cytokines in
pleural fluid measured by cytometric bead array. Int J Mol Med
2003, 12:193-198.
18. Wu S, Ko YS, Teng MS, Ko YL, Hsu LA, Hsueh C, Chou YY, Liew CC,
Lee YS: Adriamycin-induced cardiomyocyte and endothelial
cell apoptosis: in vitro and in vivo studies. J Mol Cell Cardiol 2002,
34:1595-1607.
19. Doherty PC, Topham DJ, Tripp RA, Cardin RD, Brooks JW, Steven-
son PG: Effector CD4+ and CD8+ T-cell mechanisms in the
control of respiratory virus infections. Immunol Rev 1997,
159:105-117.
20. Nain M, Hinder F, Gong JH, Schmidt A, Bender A, Sprenger H, Gemsa
D: Tumor necrosis factor-α production of influenza A virus-
infected macrophages and potentiating effect of
lipopolysaccharides. J Immunol 1990, 145:1921-1928.
21. Gong JH, Sprenger H, Hinder F, Bender A, Schmidt A, Horch S, Nain
M, Gemsa D: Influenza A virus infection of macrophages:
enhanced tumor necrosis factor-alpha (TNF-alpha) gene
expression and lipopolysaccharide-triggered TNF-alpha
release. J Immunol 1991, 147:3507-3513.
22. Henke A, Mohr C, Sprenger H, Graebner C, Stelzner A, Nain M,
Gemsa D: Coxsackievirus B3-induced production of tumor
necrosis factor-α, IL-1, and IL-6 in human monocytes. J
Immunol 1992, 148:2270-2277.
Publish with BioMed Central and every
scientist can read your work free of charge
"BioMed Central will be the most significant development for
disseminating the results of biomedical research in our lifetime."
Sir Paul Nurse, Cancer Research UK
Your research papers will be:
available free of charge to the entire biomedical community
peer reviewed and published immediately upon acceptance
cited in PubMed and archived on PubMed Central
yours — you keep the copyright
Submit your manuscript here:
/>BioMedcentral
Respiratory Research 2005, 6:42 />Page 12 of 12
(page number not for citation purposes)
23. Oppenheim JJ, Zachariae COC, Mukaida N, Matsushima K: Proper-
ties of the novel proinflammatory supergene "intercrine"
cytokine family. Annu Rev Immunol 1991, 9:617-648.
24. Baggiolini M, Dewald B, Moser B: Interleukin-8 and related
chemotactic cytokines – CXC and CC chemokines. Adv
lmmunol 1994, 55:97-179.
25. Loetscher M, Gerber B, Loetscher P, Jones SA, Piali L, Clark-Lewis I,
Baggiolini M, Moser B: Chemokine receptor specific for IP-10
and Mig: structure, function and expression in activated T
lymphocytes. J Exp Med 1996, 184:963-969.
26. Arai K, Liu ZX, Lane T, Dennert G: IP-10 and MIG facilitate accu-
mulation of T cells in the virus-infected liver. Cell Immunol 2002,
219:48-56.
27. Panuska JR, Merolla R, Rebert NA, Hoffmann SP, Tsivitse P, Cirino
NM, Silverman RH, Rankin JA: Respiratory syncytial virus
induces interleukin-10 by human alveolar macrophages.
Suppression of early cytokine production and implications
for incomplete immunity. J Clin Invest 1995, 96:2445-2453.
28. Van Damme J, Decock B, Conings R, Falkenburg JH, Opdenakker G,
Billiau A: The chemotactic activity for granulocytes produced
by virally infected fibroblasts is identical to monocyte-
derived interleukin 8. Eur J Immunol 1989, 19:1189-1194.
29. Choi AMK, Jacoby DB: Influenza virus A infection induces inter-
leukin-8 gene expression in human airway epithelial cells.
FEBS Lett 1992, 309:327-329.
30. Becker S, Quay J, Soukoup J: Cytokine (tumor necrosis factor,
IL-6, and IL-8) production by respiratory syncytial virus-
infected human alveolar macrophages. J Immunol 1991,
147:4307-4312.
31. Subauste MC, Jacoby DB, Richards SM, Proud D: Infection of a
human respiratory epithelial cell line with rhinovims. Induc-
tion of cytokine release and modulation of susceptibility to
infection by cytokine exposure. J Clin Invest 1995, 96:549-557.
32. Kelly M, Kolb M, Bonniaud P, Gauldie J: Re-evaluation of fibro-
genic cytokines in lung fibrosis. Curr Pharm Des 2003, 9:39-49.
33. Muller NL, Ooi GC, Khong PL, Zhou LJ, Tsang KW, Nicolaou S:
High-resolution CT findings of severe acute respiratory syn-
drome at presentation and after admission. Am J Roentgenol
2004, 182:39-44.
34. Ho JC, Ooi GC, Mok TY, Chan JW, Hung I, Lam B, Wong PC, Li PC,
Ho PL, Lam WK, Ng CK, Ip MS, Lai KN, Chan-Yeung M, Tsang KW:
High dose versus non-pulse corticosteroid regimens in
severe acute respiratory syndrome. Am J Respir Crit Care Med
2003, 168:1449-1456.
35. Domachowske JB, Bonville CA, Ali-Ahmad D, Rosenberg HF: Gluco-
corticoid administration accelerate mortality of pneumovi-
rus-infected mice. J Infect Dis 2001, 184:1518-1523.