Báo cáo khoa học: "Associations between the time of conception and the shape of the lactation curve in early lactation in Norwegian dairy cattle" pptx
Bạn đang xem bản rút gọn của tài liệu. Xem và tải ngay bản đầy đủ của tài liệu tại đây (299.03 KB, 8 trang )
RESEARCH Open Access
Associations between the time of conception and
the shape of the lactation curve in early lactation
in Norwegian dairy cattle
Fredrik Andersen
1*
, Olav Østerås
1†
, Olav Reksen
1†
, Nils Toft
2†
, Yrjo T Gröhn
3†
Abstract
Background: This study was carried out to determine if an association exists between the shape of the lactation
curve before it is influenced by the event of conception and the time from calving to conception in Norwegian
dairy cattle. Lactation curves of Norwegian Red cows during 5 to 42 days in milk (DIM) were compared between
cows conceiving between 43 and 93 DIM and cows conceiving after 93 DIM.
Methods: Data from 23,049 cows, represented by one lactation each, with 219,538 monthly test days were
extracted from the Norwegian Dairy Herd Recording System, which represents 97% of all Norwegian dairy cows.
Besides veterinary treatments, these records also included information on daily milk yield at monthly test days. The
data were stratified by parity groups (1, 2, and 3 and higher) and time to conception periods (43-93 DIM and
>93 DIM). The sample was selected using the following selection criteria: conception later than 42 DIM, calving
season July to September, no records of veterinary treatment and the level of energy fed as concentrates between
8.69 and 12.83 MJ. The shape of the lactation curves were parameterized using a modified Wilmink-model in a
mixed model analysis. Differences in the parameters of the lactation curves with different conception times were
evaluated using confidence intervals.
Results: Lactation curves characterized by a low intercept and a steep ascending slope and a steep descending
slope were associated with early conception across all pa rities. The peak milk yield was not associated with time of
conception.
Conclusions: A practical application of the study results is the use of the shape of the lactation curve in future
herd management. Groups of cows with impaired reproductive performance may be identified due to an
unfavorable shape of the lactation curve. Monitoring lactation curves and adjusting the feeding strategy to adjust
yield therefore may be useful for the improvement of reproductive performance at herd level.
Background
Good reproductive performance is a key element in t he
modern dairy industry. Norwe gian Red is the most com-
mon dairy breed in Norway, constituting 94% of the
Norwegian dairy cow population and is kept for both milk
and beef production [1]. A recent study using 829 animals
to investigate the reproductive performance of this breed,
reported the following fertility measures after the first arti-
ficial insemination. An overall 60-d nonreturn rate of
72.5%, an overall pregnancy incidenc e of 63.8% and an
overall calving rate of 57.2%. Even if these numbers indi-
cate good reproductive performance of the breed, there is
some variat ion in calving to first insemination, 85.3 days
(SD ± 41.9) [2]. Management, such as estrus detection and
feeding strategy, is of major importance for the reproduc-
tive performance in a dairy herd [3,4]. Management strate-
gies can be difficult to measure and compare in a large
scale epidemiological study. The shape of the lactation
curve, however, may reflect the feeding strategy in an
objective manner [5]. Feeding during the transition period
and the upscaling of concentrates fed after calving has
been shown to be of importance to the energy balance
[3,5,6]. Because cows do not conceive as long as their
* Correspondence:
† Contributed equally
1
Department of Production Animal Clinical Sciences, Norwegian School of
Veterinary Science, Oslo, Norway
Full list of author information is available at the end of the article
Andersen et al. Acta Veterinaria Scandinavica 2011, 53:5
/>© 2011 Andersen et al; licensee BioMed Central Ltd. This is an Open Access article distributed under the terms of the Creative
Commons Attribution License ( which permits unrestricted use, distribution, and
reproduction in any medium, provided the original work is properly cited.
energy balance is decreasing [7], the link between feeding,
energy balance and the shape of the lactation curve is also
expected to be associated with the time from calving to
conception [8].
The calving to conception period is commonly used as
a measure of reproductive performance. It consists of the
period from calving to first serviceandtheperiodfrom
first service to co nception in cows not conceivin g at first
servi ce. A prolonged calving to conception p eriod results
in an extended lactation period which has been shown to
give a higher total milk yield in the current lactation
[9,10]. Even if a long calving to conception period is ben-
eficial in terms of the magnit ude of the milk yield in the
current lactation, it is still regarded to be a measure of
impaired reproductive performance. In terms of milk
production, lifetime product ion is more important than
production in individual lactations [11].
The Norwegian cattle breeding organization, Geno,
recommends not to start breeding before six weeks aft er
calving. Further, the annual statistics from the Norwe-
gian Dairy Herd Recording System (NDHRS) gives a
mean calving to first artificial insemination (AI) time of
86.9 days. This database includes 97% of all Norwegian
dairy cows [1].
The lactation curve in dairy cattle describes the pat-
tern of milk yield throughout the lactation period. The
shape of this curve and the factors influencing it have
been investigated in several studies [12,13]. To find the
association between a reproductive trait and the shape
of the lactation curve, the latter needs to be parameter-
ized. Earlier studies have shown t hat there a re several
methods available to obtain an estimated lactation curve
with good fit to observ ed data using monthly milk yield
records [14-17].
Observing the shape of the lactation curve may be
helpful in differentiating factors related to feeding or
estrus detection, such as shiftin g the f ocus of manage-
ment interventions to e strus detection if the shape of
the lactation curve is considered optimal or vice versa.
The aim of this stud y was to determine whether an
association exists between the shape of the l actation
curve before it is influenced by the event of conception
and the time from calving to conception in Norwegian
dairy cattle. The rationale is that there is a relationship
between feeding and the shape of the lactation curve.
Adjusting the feeding strategy in the first part of lacta-
tion may thus optimize t he shape of the lactation curve
and thereby shorten the time to conception.
Methods
Material
Data used in this study were extracted from the
NDHRS, which is a single da tabase containi ng produc-
tion data, veterinary diagnoses, information on AI and
treatments [1]. Daily milk yield and daily amount of
concentrates fed are recorded on monthly test days and
the test day record also states if the cow was diseased
when daily milk yield was measured. The database pro-
vides yearly statistics of disease incidences, feeding and
production at herd level. The validity of this database is
considered high because Norwegian legislation prohibits
farmers from using veterinary drugs an d requires veteri-
narians to register all diagnoses and treatments [18].
Sampling from the database was conducted to extract
data on dairy cows starting their lactation on or after Jan-
uary 1
st
, 2005 and ending their lactation no later than
February 19
th
, 2007. Only the first complete lactation
from each cow in the period was used and all bree ds
other than Norwegian Red were excluded. All lactations
started and ended with a successful calving and the date
of the last AI was used to determine the day of concep-
tion. Lactations with a gestation length of less than
269 days or more than 289 days were considered false
recordings and deleted (5 .0%). Lactations with fewer than
4 monthly milk yield records were deleted (4.1%). If the
cow was reported as diseased on test day, if the test day
occurred before 5 DIM or if 0 kg milk was recorded on
test day, the daily milk yield record was deleted (4.7%).
A study population was selected from the extracted data,
including only lactations without records of veterinary
treatments (68.31%). From this study po pulation a st udy
sample was selected using the following criteria. Lactations
where the first date of AI occurred before the recom-
mended 42 DIM were deleted (4.28%). Lactations with cal-
ving recorded from July to September (35.78%), and a
mean level of daily energy fed as concentrates between
8.69-12.83 MJ, calculated f rom amount of concentrates
given at each test day (63.39%), were selected for the study.
The data were stratified into parity groups: 1 = first
parity, 2 = second parity and 3 = third o r later parit ies,
and early conceivers, TIME_CC = 1 (43-93 DIM) and
late conceivers, TIME_CC = 2 (> 93 DIM). The final
study sample used for the statistical analysis consisted of
219,538 test days in 23,049 lactations (Table 1).
Study Design and Method
The study was performed as a retrospective cohort study
with a closed population at lactation level. To minimize
the effect of year, calving season and breed differences
the described selection criteria were used to generate
the study sample. A modified Wilmink model [16] was
used to estimate the shape of the lactation curve
adjusted for the effects of time to conception and parity.
A mixed model was run using PROC MIXED (SAS
Institute Inc., 2003) with repeated measurements of test
day milk yields within lactation nested within herd to
account for the cluster eff ect. A spatial power correla-
tion matrix, SP(POW), with month as time scale was
Andersen et al. Acta Veterinaria Scandinavica 2011, 53:5
/>Page 2 of 8
chosen for the repeated state ment. The SP(POW) corre-
lation matrix allowed f or non-equidistant timepoints
and was chosen after evaluating different relevant
matrices using the Akaike Information Criterion.
Further, the model was run with random regression of
the variable describing the natural logarithm of DIM
(lnDIM) at herd level to account for herd level variation.
A backward selection process with inclusion criteria of P
< 0.05 based on the F-test was used to build the final
model. Significant two-way interaction terms were
included in the final model.
Equation I:
Y DIM DIM TIME_CC PAR DIM
ijk ijk ijk jk jk ijk
01 2 3 4 5
ln ln TTIME_CC
DIM PAR DIM TIME_CC DIM PAR
jk
ijk jk ijk jk ijk jk
67 8
ln
ijk
where subscript ijk identifies the i-th test day in the j-th
lactation in the k-th herd. Y is milk yield (kg), DIM is the
number of days from calving to the test-day, lnDIM is
the natural logarithm o f DIM, TIME_CC is the concep-
tion day group, PAR is the parity group and ε is the error
term. The b-values are associated with the starting level
of milk production (kg) (b
0
), the ascending slope of the
lactation curve (N(b
1
,s
2
b1
) i.e. mod eled as a random
slope), the descending slope of the lactation curve (b
2
),
the interaction effect of T IME_CC with the starti ng level
of milk production (b
3
), the interaction effect of PAR
with the starting level of milk production (b
4
), the inter-
action effect of TIME_CC with the ascending slope (b
5
),
the interaction effect of PAR with the ascending slope
(b
6
), the interaction effect of TIME_CC with the des-
cend ing slope (b
7
) and the interaction effect of PAR with
the descending slope (b
8
). Residuals (ε
ijk
) were modeled
using the SP(POW) structure as previously mentioned.
The underlying assumptions of the models were assessed
visually by QQ-plots testing the normality of the
residuals, and predicted values were plotted against resi-
duals to assess the homogeneity of variance of the resi-
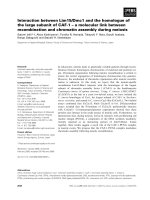
duals.Thefitoftheestimated lacta tion curves were
tested by plotti ng them against the raw milk records and
their 95% confidence interval (Figure 1).
The estimates from the models were used to generate
different lactation curves of early and late conceivers
(Figure 2). These values and their standard errors were
also used directly as parameters for the milk yield at the
onset of lactation (b
0
), th e ascending slope (b
1
) and des-
cending slope (b
2
), which were compared between
TIME_CC classes using confidence intervals (Table 2).
Finally the b-values were used for calculation of peak
milk yield (-b
1
/b
2
) and the day of peak milk yield (b
0
+
(b
1
×ln(peak milk yield))+ (b
2
×peak milk yield)).
Results
Descriptive statistics of the study sample, with calving sea-
son July to September and 305-d lactation mean level of
daily energy fed as concentrates between 8.69 MJ and
12.83 MJ, are given in Table 1. The herds in the study
population had an average size of 18.7 cow-years and an
average milk yield per lactation of 6,665 kg milk. Cow-
years were defined as the sum of the number of cows on
each day on a farm divided by 365 days, reflecting the
mean herd size during one year. Component feeding was
commonly used which on average at farm level consisted
of 42.0% conc entrates, 41.4% grass silage, 14.2% pasture
and 2.4% other feedstuffs. Differences in age at calving
within each parity were assumed to be influential a priori,
but were found to be non-significant. The lactations with
early conception were inseminated significantly earlier and
signi ficantly fewer times compared to the lactat ions con-
ceiving late, both in total and within parity groups
(Table 1). The fit of the lactation curve generated from the
Table 1 Descriptive statistics within parity and time to conception of study sample with calving season July to
September, average of 8.69 MJ to 12.83 MJ of daily energy from concentrates and no records of veterinary
treatments throughout lactation, of Norwegian dairy cattle during the period 2005 to 2007
N
lactations
Mean age at
calving in
months (95%CI)
Lactations with early conception (43 to 93
DIM)
Lactations with late conception (after 93 DIM)
N
lactations
Calving to first
insemination in
days (95%CI)
Number of
inseminations
N
lactations
Calving to first
insemination in
days (95%CI)
Number of
inseminations
First parity
lactations
12,758 25.48 (25.42-25.53) 6,883 69.84 (69.51-70.17) 1.27 (1.25-1.28) 5,875 97.21 (96.49-97.92) 2.12 (2.10-2.15)
Second
parity
lactations
5,651 37.63 (37.54-37.73) 3,131 70.23 (69.73-70.72) 1.25 (1.23-1.26) 2,520 98.01 (96.89-99.12) 2.02 (1.98-2.06)
Third or later
parity
lactations
4,640 58.40
1
2,574 70.99 (70.46-71.52) 1.25 (1.23-1.27) 2,066 97.94 (96.69-99.18) 2.00 (1.96-2.05)
All lactations 23,049 35.10
1
12,588 70.17 (69.93-70.42) 1.26 (1.25-1.27) 10,461 97.54 (97.00-98.09) 2.08 (2.05-2.10)
1
95%CI not applicable.
Andersen et al. Acta Veterinaria Scandinavica 2011, 53:5
/>Page 3 of 8
0
5
10
15
20
25
30
35
5 6 7 8 9 101112131415161718192021222324252627282930313233343536373839404142
DIM
Milk yield (kg)
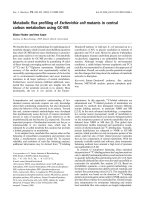
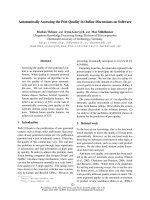
Figure 2 Lactation curves from 5 to 42 DIM of lactations with calving season July to September, average of 8.69 MJ to 12.53 MJ of
daily energy from concentrates and no records of veterinary treatments throughout lactation, of Norwegian dairy cattle during the
period 2005 to 2007. 6,883 first parity lactations with early conception (43 to 93 DIM) (▬▬), 5,875 first parity lactations with late conception
(after 93 DIM) (▬▬), 3,131 second parity lactations with early conception (43 to 93 DIM) (▬▬), 2,520 second parity lactations with late conception
(after 93 DIM) (▬▬), 2,574 third or later parity lactations with early conception (43 to 93 DIM) (▪▪▪) and 2,006 third or later parity lactations
with late conception (after 93 DIM) (▪▪▪).
0
5
10
15
20
25
30
35
6 7 8 9 10 11 12 13 14 15 16 17 18 19 20 21 22 23 24 25 26 27 28 29 30 31 32 33 34 35 36 37 38 39 40 41 42
DIM
Milk yield (kg)
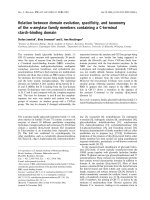
Figure 1 Estimated lactation curves from 5 to 42 D IM (▬▬) compared with 95% CI of raw data milk yields of 12,758 first parity
lactations (I) and estimated lactation curves (▬▬) compared with 95%CI of raw data milk yields of 5,651 second parity lactations (I)
with calving season July to September, average of 8.69 MJ to 12.83 MJ of daily energy from concentrates and no records of
veterinary treatments throughout lactation, of Norwegian dairy cattle during the period 2005 to 2007.
Andersen et al. Acta Veterinaria Scandinavica 2011, 53:5
/>Page 4 of 8
parameters estimated in the model was compared visually
with the 95%CI of raw data test day milk yields (Figure 1).
The parameters describing the lactation curve of early
conceivers (43-93 DIM) were significantly different com-
pared to the parameters describing the lactation curve of
late conceivers (after 93 DIM). Cow s conceiving early
had significant lower intercept, steeper ascending slope
and steeper descending slope c ompared to cows con-
ceiving late, p < 0.001 (Figure 2 and Table 2). These
results were the same across all parity groups. Peak
yield as well as peak day, did not differ significantly with
conception day groups for any parity group, except for
peak day in first parity (Table 2).
The covariance estimates were 0.99 for the correlation
matrix and 0.22 for the random regression of lnDIM,
which gave int raclass cor relation co efficients of
0.058 and 0.013 respectively. This means that repeated
measurements and parameter lnDIM contribute 5.8%
and 1.3% respectively, to the between herd variation of
the model parameters.
Discussion
In the current study a lactation curve described by a low
starting milk yield and a steep slope was associated with
early conception across all parities. This concurs with
an earlier investigation which found that high early mil k
yield was associated with a longer period of days open
[10]. The present s tudy indicate that this differe nce is
observable before 15 DIM (Figure 2). A too high starting
milk yield would presumably maintain the NEB and
thereby prolong the time to conception [7]. An
increased number of A.I. per conception indicate
impaired reproduction (Table 1). The material used,
however, could not answer if delayed breeding start is
voluntary or a result of silent heat.
The peak milk yield seemed to have no association
with the time of conception. Higher milk yield has been
associated with longer time to resumption of ovarian
activity in high yielding dairy cows in some report s
[8,19,20]. Other authors have found no [21,22] or
inverse associations between milk yield and recurrence
of ovarian activity [23,24].
In the current study a steep ascending slope early in
lactation is associated with early resumption of breeding
activity. The biological reason for this might be the found
in energy coverage. Earlier studies have found that the
change in body condition score and the magnitude of the
neg ativ e energy balance (NEB) in early lactation are cru-
cial to conception [25,26]. A steep ascending slope of the
lactation curve may be indicative of adequate energy
Table 2 Lactation curve parameters of lactations with calving season July to September, average of 8.69 MJ to 12.83
MJ of daily energy from concentrates and no records of veterinary treatments throughout lactation, of Norwegian
dairy cattle during the period 2005 to 2007
Early conception (from 43 to 93 DIM) Late conception (after 93 DIM)
Estimate SE
4
Estimate SE
4
First parity (12,758 lactations and 121,552 test days)
Intercept (kg) 12.83*** 0.11 13.94*** 0.11
Ascending slope (kg/days) 3.42*** 0.03 2.96*** 0.03
Descending slope (kg/days) -0.0643*** 0.0004 -0.0519*** 0.0004
Peak day
1
53.19 (51.57-54.85)
3
** 57.13 (55.05-59.27)
3
**
Peak yield
2
(kg) 23.01 (22.51-23.51)
3
22.96 (22.43-23.50)
3
Second parity (5,651 lactations and 53,779 test days)
Intercept (kg) 19.13*** 0.14 20.23*** 0.15
Ascending slope (kg/days) 3.17*** 0.04 2.71*** 0.04
Descending slope (kg/days) -0.0814*** 0.0005 -0.0689*** 0.0005
Peak day
1
38.95 (37.45-40.48)
3
39.33 (37.51-41.21)
3
Peak yield
2
(kg) 27.57 (26.95-28.19)
3
27.48 (26.83-28.13)
3
Third or later parity (4,640 lactations and 44,207 test days)
Intercept (kg) 19.81*** 0.15 20.91*** 0.16
Ascending slope (kg/days) 3.89*** 0.05 3.43*** 0.05
Descending slope (kg/days) -0.0984*** 0.0006 -0.0859*** 0.0006
Peak day
1
39.53 (38.18-40.90)
3
39.92 (38.35-41.54)
3
Peak yield
2
(kg) 30.22 (29.55-30.89)
3
30.13 (29.44-30.82)
3
** estimates within same row differ (p < 0.05) *** estimates within same row differ (p < 0.001).
1
- ascending slope/descending slope.
2
starting milk yield + (ascending slope×ln(peak day)) + (descending slope×peak day).
3
interval calculated from 95% lower and upper confidence limits of estimates.
4
Standard Error.
Andersen et al. Acta Veterinaria Scandinavica 2011, 53:5
/>Page 5 of 8
coverage during the early post partum period and thereby
early resumpti on of ovarian activity, found in the current
study. An earl ier Norwegian study found that co ws
experiencing early versus delayed resumption of ovarian
activity have lactation curves with different slopes as
energy balance approaches zero throughout the post par-
tum period [27]. A risk of choosing a feeding strategy
based on a high escalation rate of concentrates to ensure
adequate energy coverage is the increased risk of indiges-
tion because of too sudden changes in the ruminal envir-
onment. Cows of the current study that succeeded in
becoming pregnant appeared to have counteracted this
negative effect of concentrate as indigestion is likely to
lead to lower milk yield and impaired reproduction
[28,29].
A confounding variable not t aken into account in the
current study, because of the lack of data, is the volun-
tary waiting period (VWP), which is the time period
decided by the farmer before breeding starts. Although
the average 305 d yield in the current study was less
than 7000 kg, one cannot rule out that a high milk yield
early in lactation, might have lead farmers to prolong the
VWP to avoid the problems related to drying of in some
high yielding cows. On the other hand, a high yielding
cow might be looked upon by the farmer as hard to g et
pregnant and therefore started to be bred earlier i.e. a
shorter VWP, which is supported by a high number of A.
I in late conceiving cows (Table 1). In other words, man-
agement decisions based on high yield early in lactation,
consistent w ith a steep ascending slope, might influence
the calving to conception time in either way. However,
the principal aim of this study was to investigate whether
there is an association between the lactation curve and
time to conception in Norwegian dairy cows. The reason
for delayed conception may be biological, or managerial,
or as is more often the case, a combination of both.
Nevertheless, the alteration in the profile of the lactation
curve may pose an opportunity of early identification of a
herd reproductive problem that reaches beyond estrus
detection and A.I. management. When the problems are
to be ruled out at the herd level by trained personnel,
additional information on voluntary wait, culling policy
and feeding management will probably be readily obtain-
able from the herdsmen.
The current study identified an associa tion between a
steep descending slope of the lactation curve and early
conception. The reason behind this association might be
the ne gative effect pregnancy has on milk yield [30,31].
This effect and its magnitude on milk yield is beyond
the scope of this paper and we hope to be able to pur-
sue this question in future research programs.
Inthecurrentstudythelactationcurveswereesti-
mated by using a modified Wilmink model and the sta-
tistical setup of a mixed model using monthly test day
records of daily milk yield. A concern with the current
method may be that milk records obtained after concep-
tion might influence the estimated shape of the curve
before concepti on. The fit of the curves generated from
using a ll milk records to raw data proved to be satisfy-
ing (Figure 1). Potential confounding of correlation
between test-day milk yields and clus tering within lacta-
tion was taken care of by running the model with
repeated measurements of test day milk yield within lac-
tation nested within herd.
Another concern related to the association between con-
ception time and the shape of the lactation curve is culling
of animals because of reproductive f ailure. The farmer’s
decision whether to give up on getting a cow pregnant
may be influenced by the course of the lactation curve.
Cows with a less persistent lactation curve, i.e. a steep des-
cending slope of the lactation curve, may be given up ear-
lier than other cows. This would cause a problem if the
primary aim of the study was to assess reproductive per-
formance at herd level. The following reasoning applies to
the selection criteria used in the current study where non-
pregnant cows and culled cows, 30.2% of the observations,
were excluded. The most prevalent reasons for culling are
low milk yield, reproductive fail ure, disease and age [29].
Cows omitted from the study for non-pregnancy are likely
to have followed the lactation curve pattern of late concei-
vers with a high persistency of the lactation curve [30,31].
Including these cows would probably have emphasized the
difference in lactation curve traits between late and early
conceiving cows. There might be a risk however, that the
late conceivers are overrepresented among high perform-
ing cows. The reason for this being the increased likeli-
hood of culling a low performing cow compared to a high
performing cow. In the material used in the current study,
peak milk yield was virtually equal across calving to con-
ception intervals within each parity category (Table 2),
and therefore this bias of performance is believed to be
minimal.
Disease is known to have an effect on both milk pro-
duction [28] and reproductive performance [29]. To
avoid the in fluence of disease on the association, only
data from lactations with no records of vet erinary treat-
men ts (68.3%) were used in the current study. The data
used in the current study were obtained from the
NDHRS database, whic h has not been validated yet.
A major and currently ongoing Nordic r esearch project
will validate all the Nordic dairy health recording sys-
tems. There might be problems with non-directional
misclassification and measurement errors which weaken
the statistical power of the result using non-validated
sources. Research has shown, h owever, that adjusting
the sample size can account for this potential loss of
power [32] and this is well taken care of by the large
sample size used in the current study.
Andersen et al. Acta Veterinaria Scandinavica 2011, 53:5
/>Page 6 of 8
The strength of the current study, using a large
representative database and a large sample size, is that
the results can be implemented on the stu dy popula-
tion of Norwegian dairy cattle. One must consider,
however, that we have restricted our analysis to certain
calving season July to September. The reason for this
approach is that internal validity is more important
than external validity. We also, however, tested this for
different calving seasons and found the same associa-
tion. Therefore we ar e confident that an association
between the time of conception and the shape of the
lactation curve does indeed exist. Plotting daily milk
records obtained from the automatic m ilking system,
the shape of the lactation curve might be monitored,
adjusted by feeding and optimized for conception.
Together with heat detection and insemination techni-
que t his is yet another tool to manage the reproductive
performance in t he dairy herd.
Conclusions
An earlier Norwegian study indicates that there is a
dynamic relationship between NEB, milk yield and repro-
ductive performance in dairy cows [27]. The current
study results point to the same hypothesis. Starting the
lactation with high yield and slightly flatter slope is asso-
ciated with later conception, despite having the same
peak milk yield. A smaller scale controlled clinical trial is
required to evaluate possible causation of this association.
Acknowledgements
Access to the production and health data used in this study was granted by
the Norwegian Dairy Herd Recording System (NDHRS) and the Norwegian
Cattle Health Services (NCHS) in agreement number 003/2007. The study
was financially supported by grants from (Norges forskningsråd) the
Research Council of Norway (56%), (Forskningsmidler over jordbruksavtalen)
Agricultural Agreement Research Fund and (Fondet for forskningsavgift på
landbruksprodukter) Foundation for Research Levy on Agricultural Products
(together 44%).
Author details
1
Department of Production Animal Clinical Sciences, Norwegian School of
Veterinary Science, Oslo, Norway.
2
Department of Large Animal Sciences,
Faculty of Life Sciences, University of Copenhagen, Copenhagen, Denmark.
3
Department of Population Medicine and Diagnostic Sciences, College of
Veterinary Medicine, Cornell University, Ithaca, New York, USA.
Authors’ contributions
Study design: FA, OØ, OR and YTG. Data collection: FA and OØ. Data
analysis: FA and OØ. Statistical analysis: FA, OØ and NT. Writing paper: FA.
Critical review and approval of the final manuscript: all authors.
Competing interests
The authors declare that they have no competing interests.
Received: 23 August 2010 Accepted: 8 February 2011
Published: 8 February 2011
References
1. Østerås O, Solbu H, Refsdal AO, Roalkvam T, Filseth O, Minsaas A: Results
and evaluation of thirty years of health recordings in the Norwegian
dairy cattle population. J Dairy Sci 2007, 90:4483-4497.
2. Garmo RT, Refsdal AO, Kalberg K, Ropstad E, Waldmann A, Beckers JF,
Reksen O: Pregnancy incidence in Norwegian Red Cows using nonreturn
to estrus, rectal palpation, pregnancy associated glycoproteins and
progesterone. J Dairy Sci 2008, 91:3025-3033.
3. Spiekers H, Klunter AM, Potthast V, Pfeffer E: Effects of different
concentrate levels on milk yield, feed intake, live weight change, health
and reproduction in dairy cows. Livest Prod Sci 1991, 28:89-105.
4. Roche JR, Friggens NC, Kay JK, Fisher MW, Stafford JK, Berry PD: Invited
review: Body condition score and its association with dairy cow
productivity, health, and welfare. J Dairy Sci 2009, 92:5769-5801.
5. Yrjanen S, Kaustell K, Kangasniemi R, Sariola J, Khalili H: Effects of
concentrate feeding strategy on the performance of dairy cows housed
in a free stall barn. Livest Prod Sci 2003, 81:173-181.
6. Beever DE: The impact of controlled nutrition during dry period on dairy
cow health, fertility and performance. Anim Reprod Sci 2006, 96:212-226.
7. Ferreira AM, Sá WF, Viena JHM, Camargo LSA, Pereira PAC, Fernandes CAC:
Feed intake restriction, conception rate and parturition to conception
interval in crossbred Gir-Holstein cows. Anim Reprod 2005, 2:135-138.
8. Beam SW, Butler WR: Energy balance, metabolic hormones, and early
postpartum follicular development in dairy cows fed prilled lipid. J Dairy
Sci 1998, 81:121-131.
9. Oltenacu PA, Rounsaville TR, Milligan RA, Hintz RL: Relationship between
days open and cumulative milk yield at various intervals from
parturition for high and low producing cows. J Dairy Sci 1980,
63:1317-1327.
10. Lee JK, VanRaden PM, Norman HD, Wiggans GR, Meinert TR: Relationship
of yield during early lactation and days open during current lactation
with 305-day yield. J Dairy Sci 1997, 80:771-776.
11. Togashi K, Lin CY: Genetic improvement of total milk yield and total
lactation persistency of the first three lactations in dairy cattle. J Dairy
Sci 2008, 91:2836-2843.
12. Tekerli M, Akinci Z, Dogan I, Akcan A: Factors affecting the shape of
lactation curves of Holstein cows from the Baliksir province of Turkey.
J Dairy Sci 2000, 83:1381-1386.
13. Hansen JV, Friggens NC, Hojsgaard S: The influence of breed and parity on
milk yield, and milk yield acceleration curves. Livest Sci 2006, 104:53-62.
14. Wood PDP: A simple model of lactation curves for milk yield, food
requirement and body weight. Nature 1979,
28:55-63.
15.
Rowlands GJ, Lucey S, Russell AM: A comparison of different models of
the lactation curve in daily cattle. Anim Prod 1982, 35:135-144.
16. Wilmink JBM: Comparison of different methods of predicting 305-day
milk yield using means calculated from within-herd lactation curves.
Livest Prod Sci 1987, 17:1-17.
17. Macciotta NPP, Vicario D, Cappio-Borlino A: Detection of different shapes
of lactation curve for milk yield in dairy cattle by empirical
mathematical models. J Dairy Sci 2005, 88:1178-1191.
18. Ministry of Agriculture and Food: Regulations related to marking,
recording and reporting of animals. 2002 [ />ldles?doc=/sf/sf/sf-20020903-0970.html], full text of regulation is given in
Norwegian.
19. Stevenson JS, Britt JH: Relationships among luteinizing hormone,
estradiol, progesterone, glucocorticoids, milk yield, body weight and
postpartum ovarian activity in Holstein cows. J Anim Sci 1979, 48:570-577.
20. Nebel RL, McGillard ML: Interactions of high milk yield and reproductive
performance in dairy cattle. J Dairy Sci 1993, 76:3257-3268.
21. Villa-Godoy A, Hughes TL, Emery RS, Chapin LT, Fogwell RL: Association
between energy balance and luteal function in lactation dairy cows.
J Dairy Sci 1988, 71:1063-1072.
22. Harrison RO, Ford SP, Young JW, Conley AJ, Freeman AE: Physiology and
management: Increased milk production versus reproductive and
energy status of high yielding dairy cows. J Dairy Sci 1990, 73:2749-2758.
23. Staples CR, Thacher WW: Relationship between ovarian activity and
energy status during the early postpartum period of high producing
dairy cows. J Dairy Sci 1990, 73:938-947.
24. Lucy MC, Savio JD, Badinga L, De La Sota RL, Thacher WW: Factors that
affect ovarian follicular dynamics in cattle. J Anim Sci 1992, 70:3615-3626.
25. Shrestha HK, Nakao T, Suzuki T, Akita M, Higaki T: Relationships between
body condition score, body weight, and some nutritional parameters in
plasma and resumption of ovarian cyclicity postpartum during pre-
service period in high-producing dairy cows in a subtropical region in
Japan. Theriogenology 2005, 64:855-866.
Andersen et al. Acta Veterinaria Scandinavica 2011, 53:5
/>Page 7 of 8
26. Roche JF: The effect of nutritional management of the dairy cow on
reproductive efficiency. Anim Repro Sci 2006, 96:282-296.
27. Reksen O, Gröhn YT, Havrevoll OS, Bolstad T, Waldmann A, Ropstad E:
Influence of concentrate allocation and energy balance on postpartum
ovarian activity in Norwegian cattle. J Dairy Sci 2001, 84:1060-1068.
28. Fourichon C, Seegers H, Bareille N, Beaudeau F: Effects of disease on milk
production in the dairy cow: a review. Prev Vet Med 1999, 41:1-35.
29. Gröhn YT, Rajala-Schultz PJ: Epidemiology of reproductive performance in
dairy cows. Anim Repro Sci 2000, 60-61:605-614.
30. Olori VE, Brotherstone S, Hill WG, McGuirk BJ: Effect of gestation stage on
milk yield and composition in Holstein Friesian dairy cattle. Livest Prod
Sci 1997, 52:167-176.
31. Brotherstone S, Thompson R, White IMS: Effects of pregnancy on daily
milk yield of Holstein-Friesian dairy cattle. Livest Prod Sci 2004, 87:265-269.
32. Divine OJ, Smith JM: Estimating sample size for epidemiologic studies:
the impact of ignoring exposure measurement uncertainty. Statistics in
Medicine 1998, 17:1375-1389.
doi:10.1186/1751-0147-53-5
Cite this article as: Andersen et al.: Associations between the time of
conception and the shape of the lactation curve in early lactation in
Norwegian dairy cattle. Acta Veterinaria Scandinavica 2011 53:5.
Submit your next manuscript to BioMed Central
and take full advantage of:
• Convenient online submission
• Thorough peer review
• No space constraints or color figure charges
• Immediate publication on acceptance
• Inclusion in PubMed, CAS, Scopus and Google Scholar
• Research which is freely available for redistribution
Submit your manuscript at
www.biomedcentral.com/submit
Andersen et al. Acta Veterinaria Scandinavica 2011, 53:5
/>Page 8 of 8