Báo cáo khoa học: "Universal changes in biomarkers of coagulation and inflammation occur in patients with severe sepsis, regardless of causative micro-organism [ISRCTN74215569]" doc
Bạn đang xem bản rút gọn của tài liệu. Xem và tải ngay bản đầy đủ của tài liệu tại đây (219.92 KB, 9 trang )
R82
Critical Care April 2004 Vol 8 No 2 Kinasewitz et al.
Research
Universal changes in biomarkers of coagulation and
inflammation occur in patients with severe sepsis, regardless of
causative micro-organism [ISRCTN74215569]
Gary T Kinasewitz
1
, S Betty Yan
2
, Bruce Basson
2
, Philip Comp
1
, James A Russell
3
, Alain Cariou
4
,
Suzane L Um
2
, Barbara Utterback
2
, Pierre-Francois Laterre
5
and Jean-François Dhainaut
4
,
for the PROWESS Sepsis Study Group
1
Department of Medicine, Physiology and Biophysics, University of Oklahoma Health Science Center, and Cardiovascular Biology, Oklahoma Medical
Research Foundation, Oklahoma City, Oklahoma, USA
2
Lilly Research Laboratories, Eli Lilly and Company, Indianapolis, Indiana, USA
3
St Paul’s Hospital, Vancouver, British Columbia, Canada
4
Service de Réanimation Médicale, Centre Hospitalo-Universitaire Cochin Port-Royal, AP-HP, Paris V University, Paris, France
5
Cliniques Universitares St. Luc, Brussels, Belgium
Correspondence: S Betty Yan,
α
2
-AP = α
2
-antiplasmin; APACHE = Acute Physiology and Chronic Health Evaluation; APTT = activated partial thromboplastin time; F1.2 =
prothrombin fragment F1.2; IL = interleukin; PAI = plasminogen activator inhibitor; PROWESS = Recombinant Human Activated Protein C World-
wide Evaluation in Severe Sepsis; PT = prothrombin time; sTM = soluble thrombomodulin; TAFI = thrombin activatable fibrinolysis inhibitor; TAT =
thrombin–antithrombin complex; TNF = tumor necrosis factor.
Abstract
Introduction PROWESS (Recombinant Human Activated Protein C Worldwide Evaluation in Severe
Sepsis) was a phase III, randomized, double blind, placebo controlled, multicenter trial conducted in
patients with severe sepsis from 164 medical centers. Here we report data collected at study entry for
1690 patients and over the following 7 days for the 840 patients who received placebo (in addition to
usual standard of care).
Methods Nineteen biomarkers of coagulation activation, anticoagulation, fibrinolysis, endothelial injury,
and inflammation were analyzed to determine the relationships between baseline values and their
change over time, with 28-day survival, and type of infecting causative micro-organism.
Results Levels of 13 of the 19 biomarkers at baseline correlated with Acute Physiology and Chronic
Health Evaluation II scores, and nearly all patients exhibited coagulopathy, endothelial injury, and
inflammation at baseline. At study entry, elevated D-dimer, thrombin–antithrombin complexes, IL-6, and
prolonged prothrombin time were present in 99.7%, 95.5%, 98.5%, and 93.4% of patients,
respectively. Markers of endothelial injury (soluble thrombomodulin) and deficient protein C, protein S,
and antithrombin were apparent in 72%, 87.6%, 77.8%, and 81.7%, respectively. Impaired fibrinolysis
(elevated plasminogen activator inhibitor-1) was observed in 44% of patients. During the first 7 days,
increased prothrombin time (which is readily measurable in most clinical settings) was highly evident
among patients who were not alive at 28 days.
Conclusion Abnormalities in biomarkers of inflammation and coagulation were related to disease
severity and mortality outcome in patients with severe sepsis. Coagulopathy and inflammation were
universal host responses to infection in patients with severe sepsis, which were similar across
causative micro-organism groups.
Keywords activated protein C, coagulopathy, disseminated intravascular coagulation, drotrecogin alfa (activated),
inflammation, phase III clinical trial, severe sepsis
Received: 16 December 2003
Revisions requested: 22 December 2003
Accepted: 14 January 2004
Published: 10 February 2004
Critical Care 2004, 8:R82-R90 (DOI 10.1186/cc2459)
This article is online at />© 2004 Kinasewitz et al., licensee BioMed Central Ltd
(Print ISSN 1364-8535; Online ISSN 1466-609X). This is an Open
Access article: verbatim copying and redistribution of this article are
permitted in all media for any purpose, provided this notice is
preserved along with the article's original URL.
Open Access
R83
Available online />Introduction
Severe sepsis is a serious worldwide health problem that
affects approximately 750,000 people annually in the USA,
with a mortality rate of at least 30% and a health care cost of
$16.7 billion [1]. Severe sepsis is defined as a systemic
inflammatory response to infection associated with one acute
organ dysfunction or more [2]. The systemic host response to
infection, which has been examined in small studies since the
1960s [3], has been associated with coagulation activation,
consumption of anticoagulation factors, inhibited fibrinolysis,
endothelial injury, and inflammation [4]. Coagulopathy and
inflammation resulting from severe sepsis often lead to multi-
ple organ failure and death [5].
A recently completed, large, multicenter, randomized,
placebo-controlled, phase III clinical trial in severe sepsis
(Recombinant Human Activated Protein C Worldwide Evalua-
tion in Severe Sepsis [PROWESS]) provided a unique
opportunity to examine the systemic host response associ-
ated with severe sepsis. We identified 19 soluble biomarkers
(15 prospectively and four post hoc) that were indicators of
coagulation activation, anticoagulation, fibrinolysis, endothe-
lial injury, and inflammation in sepsis, and measured these
biomarker concentrations in patients entering PROWESS at
baseline. We also analyzed biomarker changes during the
study in patients who were randomly assigned to receive
placebo by 28-day survival and causative micro-organism.
Methods
This report utilized a portion of the data collected as part of a
randomized, double-blind, placebo-controlled trial (PROWESS)
that was conducted to evaluate the efficacy and safety of
drotrecogin alfa (activated; Xigris
®
; Eli Lilly and Company, Indi-
anapolis, IN, USA) in patients with severe sepsis, as described
in detail by Bernard and coworkers [6]. Patients were eligible for
the trial if they had a known or suspected infection based on
clinical assessment, three or more signs of systemic inflamma-
tion, and one or more sepsis-associated acute organ dysfunc-
tion. Patients at risk for life-threatening bleeding were excluded.
A total of 1690 patients were treated (850 in the drotrecogin
alfa [activated] group and 840 in the placebo group). Baseline
analyses were performed on data collected from all 1690
patients in the trial before administration of drotrecogin alfa (acti-
vated) or placebo. Here we report baseline biomarker concen-
trations for all 1690 patients enrolled and their evolution over
the first 7 days in the 840 patients who received placebo.
Laboratory methods
Serial blood samples were drawn before and on study days
1–7 after the start of placebo infusion. Prothrombin time (PT),
activated partial thromboplastin time (APTT), and D-dimer,
protein C, protein S, and antithrombin levels were obtained at
each time point. Platelet counts were determined from EDTA
anticoagulated blood samples obtained before study drug
infusion and on study days 4 and 6. Serum for IL-6 determina-
tions was obtained before infusion and daily through to study
day 7. Citrated plasma and serum samples were stored at
–70°C until analysis, which was done centrally. Following a
single PROWESS study amendment allowing the collection
of additional blood samples, the final 403 patients enrolled in
the trial were analyzed for the following seven additional bio-
markers: prothrombin fragment F1.2 (F1.2), thrombin–
antithrombin complex (TAT), plasminogen activator inhibitor
(PAI)-1, thrombin activatable fibrinolysis inhibitor (TAFI), α
2
-
antiplasmin (α
2
-AP), plasminogen, and soluble thrombo-
modulin (sTM). These biomarkers were measured in citrated
plasma samples collected before study drug infusion and on
study days 1, 2, 4, and 5. Post hoc measurements of the con-
centrations of four additional inflammatory cytokines, namely
tumor necrosis factor (TNF)-α, IL-1β, IL-8, and IL-10, were
also performed in the citrated plasma samples of the final
403 consecutive patients. The assay detection limit was
20 pg/ml for TNF-α, IL-1β and IL-10, and 100 pg/ml for IL-8.
The following assays were performed on either STA or STA
Compact coagulation analyzers (Diagnostica Stago Inc.,
Asnieres, France) using Diagnostica Stago test kits. APTT
(STA-APTT), PT (STA-Neoplastine CI plus), protein C
(Staclot Protein C), and free protein S (Staclot Protein S)
were all measured with coagulation based activity assays.
D-dimer levels were measured immuno-turbidimetrically with
the STA Liatest D-DI latex immunoassay. Antithrombin
(Stachrom ATIII), α
2
-AP (Stachrom Antiplasmin), plasminogen
(Stachrom Plasminogen), and PAI-1 (Stachrom PAI) levels
were quantified using chromogenic activity assays.
TAFI (ELISA; Enzyme Research Labs, South Bend, IN, USA),
sTM (Asserachrom Thrombomodulin; Diagnostica Stago
Inc.), F1.2 (Behring Diagnostics, Westwood, MA, USA), TAT
(Behring Diagnostics), and IL-6 (Quantikine Human IL-6 HS
kit; R&D Systems, Minneapolis, MN, USA) antigen levels
were measured using enzyme immunoassay. Platelet counts
were assessed using flow cytometric methodology. Antigenic
levels of TNF-α, IL-1β, IL-8, and IL-10 were measured simulta-
neously with validated multiplexed technique (FlowMetrix,
Dynamic System Solutions, Herndon, VA, USA) [7].
Causative micro-organism
An independent, blinded clinical evaluation committee
reviewed the clinical and laboratory data available and adjudi-
cated the causative micro-organism(s) responsible for sepsis
in each patient. Patients were grouped as follows: pure
Gram-positive (n = 426; 217 patients in the placebo group),
with only Gram-positive bacterial infections; pure Gram-nega-
tive (n = 402; 212 patients in the placebo group), with only
Gram-negative bacterial infections; mixed Gram-positive and
Gram-negative (n = 188; 96 patients in the placebo group),
with only Gram-positive and Gram-negative infections; fungal
(n = 62; 32 patients in the placebo group), with fungal infec-
tion with or without the presence of other causative micro-
organisms; unknown etiology (n = 581; 268 patients in the
placebo group), with clinical infection but without confirma-
R84
Critical Care April 2004 Vol 8 No 2 Kinasewitz et al.
tory culture, or those adjudicated as having no infection
(n = 63; 36 patients in the placebo group); and other micro-
organisms (n = 31; 15 patients in the placebo group), such
as pure viral, parasitic, or other nonfungal mixed organisms.
Statistical analysis
Summary statistics and the percentage of patients abnormal
(i.e. above or below the normal range, depending on the
marker) for each biomarker are presented before treatment for
all available patient samples. We compared biomarker mea-
surements between patient groups ranging from lowest to
highest severity of illness defined by quartiles of the Acute
Physiology and Chronic Health Evaluation (APACHE) II score
using the nonparametric Spearman correlation (ρ). The
APACHE II score is used to assess patients’ risk of dying in the
intensive care unit and is based on the most abnormal values
observed in the 24 hours immediately before randomization.
In patients who received placebo (n = 840), we used repeated
measures analysis of variance to compare biomarker levels
over time between 28-day survivor and nonsurvivor popula-
tions, and between patient groups defined by infecting
causative micro-organism. Time, survival status or causative
micro-organism class, and the interaction between time and
survival status or micro-organism class were included in the
modeling with an unstructured correlation matrix. One outlier
for α
2
-AP was detected after examining the residuals plot and
was excluded from the analysis (study day 1, concentration
1128%). Also based on residual plots, a natural log transfor-
mation was applied to D-dimer, IL-6, F1.2, and TAT because
of non-normality. Means with 95% confidence intervals were
plotted over time. If analysis of variance tests indicated signifi-
cance overall, then tests at each time point were performed to
determine when significant differences were observed. No
adjustments for multiple comparisons were made. Compar-
isons between survivor and nonsurvivor populations after
baseline are biased because the groups are defined based on
a postrandomization response. Two separate models based
on infection micro-organism were applied. The first model
included four class groupings: bacterial, composed of pure
Gram-positive, pure Gram-negative, and mixed bacterial infec-
tions; fungal; unknown or none; and none of these. The
second model included four different class groupings: pure
Gram-positive; pure Gram-negative; mixed Gram-positive and
Gram-negative; and none of these.
Two-sided P values with an α level of 0.05 were used
throughout, except for tests of model interaction terms, which
were tested at an α level of 0.10 to increase the power of the
test. All calculations were performed using SAS version 8.2
software for Windows (SAS Institute Inc., Cary, NC, USA).
Results
Biomarker levels upon entry into the PROWESS trial
Baseline demographics and disease severity characteristics
for all patients (n = 1690) are detailed elsewhere [6]. At
study entry, almost all patients with severe sepsis had a
generalized host response to infection that included
increased coagulation activation, reduced anticoagulation,
impaired fibrinolysis, endothelial injury, and inflammatory
activity (Table 1).
Baseline levels of 13 of the 19 biomarkers (D-dimer, PT,
APTT, PAI-1, sTM, IL-6, IL-10, IL-8, protein C, TAFI, protein
S, antithrombin, TNF-α) exhibited significant correlations rel-
ative to increasing disease severity (i.e. APACHE II score) at
study entry (P ≤ 0.03). Four variables (IL-6, PAI-1, sTM, and
IL-8) had correlations of |ρ| > 0.20 with APACHE II. The cor-
relations were nonsignificant if the fourth quartile of
APACHE II (the most severe) was deleted for four of the bio-
markers (D-dimer, protein C, protein S, TAFI), perhaps indi-
cating that the correlation is driven by a ‘threshold’ where
the levels of these biomarkers were the most abnormal
among the most severe patients. Coagulopathy was present
universally in patients with severe sepsis, as indicated by
elevated baseline D-dimer levels (99.7% of patients) and
prolonged PT (93.4% of patients). Coagulation activation
(elevated TAT and F1.2; decreased protein C, protein S, and
antithrombin) was more common (≥77.5%) than impaired
fibrinolysis (elevated PAI-1; 44%). Endothelial injury, as indi-
cated by increased sTM, was apparent in 72% of patients,
and virtually all patients had evidence of systemic inflamma-
tion (elevated IL-6; 98.5% of patients). Baseline D-dimer, PT,
APTT, PAI-1, sTM, and IL-6 were more elevated (positive
correlations), and baseline protein C, protein S, and
antithrombin were more reduced (negative correlations)
among patients in higher APACHE II quartiles (all P ≤ 0.006;
Table 2).
The baseline levels were below the detection limit in 91%,
47%, 60%, and 59% of the patients for IL-1β, TNF-α, IL-8,
and IL-10, respectively. The median levels of these four
cytokines remained below the baseline levels over the next 5
study days (data not shown).
Evolution of the host response by 28-day survival
Biomarker levels in placebo patients over time by 28-day sur-
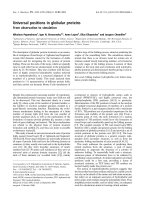
vival are shown in Figs 1–4. Nonsurvivors exhibited greater
coagulopathy and less normalization over the first week
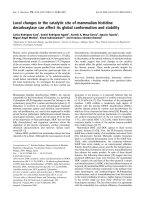
(Fig. 1). Nonsurvivors also showed more severe acquired
deficiency of anticoagulant factors at study entry and minimal
recovery over the first 7 study days as compared with sur-
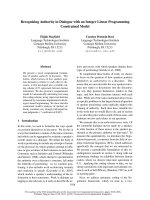
vivors (Fig. 2). With respect to thrombin generation, survivors
had significantly lower levels of TAT and F1.2 over study
days 1–5 than did nonsurvivors (Fig. 3). Survivors also had
significantly less consumption of fibrinolytic factors or impair-
ment of fibrinolysis (less consumption of plasminogen and α-
2
AP and less elevation in PAI-1) than did nonsurvivors over
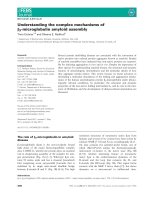
study days 1–5 (Fig. 3). Additionally, nonsurvivors exhibited
greater levels of sTM (marker of endothelial injury) and IL-6
(marker of inflammation) than did survivors throughout the
observation period (Fig. 4).
R85
Available online />Table 2
Median biomarker levels at baseline by quartile of Acute Physiology and Chronic Health Evaluation II score (
n
= 1690)
1st Quartile 2nd Quartile 3rd Quartile 4th Quartile
Biomarker (median [95% CI]) (median [95% CI]) (median [95% CI]) (median [95% CI]) ρ P
D-dimer (µg/ml) 3.84 (3.60–4.24) 3.93 (3.59–4.61) 4.11 (3.49–5.03) 5.03 (4.41–5.56) 0.10 <0.001
a
IL-6 (pg/ml) 289 (245–369) 384 (322–489) 623 (494–829) 1043 (809–1613) 0.23 <0.001
Protein C (%) 0.52 (0.49–0.55) 0.48 (0.45–0.51) 0.50 (0.44–0.53) 0.42 (0.40–0.45) –0.12 <0.001
a
AT (%) 0.62 (0.60–0.65) 0.59 (0.57–0.62) 0.60 (0.57–0.63) 0.55 (0.53–0.57) –0.11 <0.001
Protein S (%) 0.42 (0.36–0.47) 0.37 (0.33–0.41) 0.38 (0.33–0.46) 0.33 (0.30–0.35) –0.07 0.006
a
PT (seconds) 18.1 (17.6–18.4) 18.5 (18.0–19.0) 18.6 (18.2–19.0) 19.7 (19.1–20.1) 0.15 <0.001
APTT (seconds) 40.5 (39.9–42.3) 42.5 (40.9–43.9) 42.5 (40.3–43.6) 45.1 (43.4–46.4) 0.13 <0.001
Platelets (10
9
/l) 184 (173–192) 182 (167–191) 185 (174–199) 179 (167–192) –0.03 0.19
F1.2 (nmol/l) 1.65 (1.38–1.87) 1.83 (1.49–2.19) 2.09 (1.67–2.38) 1.60 (1.38–1.91) 0.04 0.49
b
TAT (µg/l) 10.7 (9.3–13.8) 10.8 (9.1–13.4) 11.7 (10.1–16.3) 12.3 (9.9–14.8) 0.06 0.27
PAI-1 (AU/ml) 25 (21.0–33.0) 33 (28–38) 34 (26–40) 40 (36–55) 0.24 <0.001
TAFI (µg/ml) 4.4 (3.7–4.9) 4.3 (3.7–4.8) 4.5 (4.1–5.3) 5.4 (4.5–6.1) 0.12 0.03
a
α
2
-AP (%) 103 (93–106) 93 (90–105) 96 (90–113) 95 (88–105) –0.04 0.43
Plasminogen (%) 62.0 (57–69) 59.5 (52–65) 60.5 (58–67) 60.0 (55–70) 0.004 0.94
sTM (ng/ml) 61 (56–71) 62 (52–75) 83 (73–109) 91 (74–117) 0.29 <0.001
IL-1β (pg/ml) ≤10 (10–10) ≤10 (10–10) ≤10 (10–10) ≤10 (10–10) 0.06 0.26
IL-10 (pg/ml) ≤10 (10–10) ≤10 (10–10) ≤10 (10–30) ≤10 (10–27) 0.16 0.001
IL-8 (pg/ml) 50 (50–50) 50 (50–50) 50 (50–144) 117 (50–177) 0.21 <0.001
TNF-α (pg/ml) ≤10 (10–21) 22 (10–27) 21 (10–41) 28 (21–33) 0.17 0.005
The quartiles of Acute Physiology and Chronic Health Evaluation (APACHE) II scores are as follows: 1st quartile, score 3–19; 2nd quartile, score
20–24; 3rd quartile, score 25–29; and 4th quartile, score 30–53. Spearman rank correlation (ρ) is between continuous values of APACHE with
each biomarker.
a
Nonsignificant correlation with APACHE if 4th quartile is deleted.
b
Significant correlation with APACHE if 4th quartile is deleted.
α
2
-AP, α
2
-antiplasmin; APTT, activated partial thromboplastin time; AT, antithrombin; CI, confidence interval; F1.2, prothrombin fragment 1.2;
IL, interleukin; PAI, plasminogen activator inhibitor; PT, prothrombin time; TAFI, thrombin-activatable fibrinolysis inhibitor; sTM, soluble
thrombomodulin; TAT, thrombin–antithrombin complex; TNF, tumor necrosis factor.
Table 1
Biomarkers of coagulation, fibrinolysis, endothelial injury, and inflammation in all patients upon entry into the PROWESS trial (
n
= 1690)
Biomarkers n Normal range Median level (25th–75th percentile) Abnormal patients (%)
Procoagulant activity
D-dimer (µg/ml) 1550 0–0.39 4.2 (2.2–8.3) 99.7
a
TAT (µg/l) 397 1–4.1 11 (7.4–19.7) 95.5
a
F1.2 (nmol/l) 396 0.44–1.1 1.8 (1.1–2.6) 77.5
a
Anticoagulant activity
Protein C (%) 1574 81–173 48 (31–65) 87.6
b
Protein S (%) 1541 60–155 36 (22–57) 77.8
b
AT (%) 1558 80–120 59 (44–75) 81.7
b
Global coagulation tests
Platelet counts (10
9
/l) 1419 140–400 182 (118–251) 32.7
b
PT (seconds) 1558 10.6–14.5 18.7 (16.5–22.0) 93.4
a
APTT (seconds) 1561 21–39 42.6 (36.3–50.4) 63.1
a
Fibrinolytic activity
PAI-1 (AU/ml) 298 4–37.8 34 (20–64) 44.0
a
TAFI (µg/ml) 319 2.8–9.2 4.6 (3.1–6.5) 17.6
b
α
2
-AP (%) 319 80–120 98 (81–115) 51.1
b
Plasminogen (%) 316 64–111 61 (48–75) 57.3
b
Endothelial injury
sTM (ng/ml) 314 18–53 73 (51–117) 72.0
a
Inflammatory marker
IL-6 (pg/ml) 1635 0.38–10.1 492 (144–2574) 98.5
a
a
Percentage of patients with values higher than the upper limit of normal.
b
Percentage of patients with values lower than the lower limit of normal.
α
2
-AP, α
2
-antiplasmin; APTT, activated partial thromboplastin time; AT, antithrombin; F1.2, prothrombin fragment 1.2; IL, interleukin; PAI,
plasminogen activator inhibitor; PT, prothrombin time; TAFI, thrombin-activatable fibrinolysis inhibitor; sTM, soluble thrombomodulin; TAT,
thrombin–antithrombin complex.
R86
Critical Care April 2004 Vol 8 No 2 Kinasewitz et al.
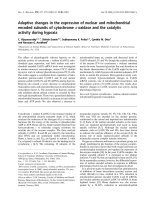
Figure 1
The time courses of biomarkers of coagulation in placebo-treated patients with severe sepsis in the PROWESS study are shown here as means
and 95% confidence intervals, using standard error of the mean and repeated measures analysis without imputing for missing data. The number of
observations for each time point appears below the x-axis for (᭹) survivors and (᭺) nonsurvivors. *P < 0.05 versus nonsurvivors. APTT, activated
partial thromboplastin time; PT, prothrombin time.
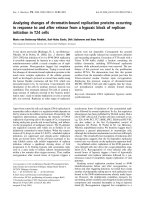
Figure 2
Time courses of biomarkers of anticoagulants in placebo-treated patients with severe sepsis in the PROWESS study are shown here as means
and 95% confidence intervals, using standard error of the mean and repeated measures analysis without imputing for missing data. The number of
observations for each time point appears below the x-axis for (᭹) survivors and (᭺) nonsurvivors. *P < 0.05 versus nonsurvivors.
R87
Host response by causative micro-organism
The evolution of the host response to infection over the first
7 study days was analyzed by causative micro-organism
classes in the placebo-treated patients. Data from a select
panel of biomarkers are shown in Fig. 5. In patients with pure
Gram-negative infections, the D-dimer level was significantly
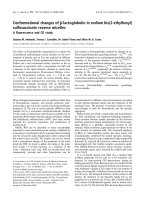
Available online />Figure 3
The time course of biomarkers of thrombin generation and fibrinolysis in placebo-treated patients with severe sepsis in the PROWESS study are
shown here as means and 95% confidence intervals, using standard error of the mean and repeated measures analysis without imputing for
missing data. The number of observations for each time point appears below the x-axis for (᭹) survivors and (᭺) nonsurvivors. *P < 0.05 versus
nonsurvivors. F1.2, prothrombin fragment 1.2; PAI, plasminogen activator inhibitor; TAFI, thrombin-activatable fibinolysis inhibitor; TAT,
thrombin–antithrombin complex.
Figure 4
Time courses of biomarkers of inflammation and endothelial damage in placebo-treated patients with severe sepsis in the PROWESS study are
shown here as means and 95% confidence intervals, using standard error of the mean and repeated measures analysis without imputing for
missing data. The number of observations for each time point appears below the x-axis for (᭹) survivors and (᭺) nonsurvivors. *P < 0.05 versus
nonsurvivors. sTM, soluble thrombomodulin.
R88
higher than in patients with pure Gram-positive infections only
at baseline. Levels of IL-6 (Fig. 5) and PT values (not shown)
were not different between patients with pure Gram-positive
and pure Gram-negative infections. Throughout the first
7 days, IL-6 levels were significantly greater in patients with
bacterial infections than in the group with infection of
unknown etiology (clinical infection but without confirmatory
culture). This latter group, compared with patients with bacte-
rial infection, had significantly less consumption of protein C
during study days 1–3 and of protein S during days 1 and 2.
Patients with fungal infection (data not shown) had higher
D-dimer levels than those with infections of bacterial or of
unknown etiology at study entry and on days 1, 2, and 7.
Similarly, fungal infection was also associated with more
inflammation (higher IL-6 concentrations) throughout the first
7 days. Patients with fungal infection had the greatest
increase in PT and lowest protein C levels, whereas patients
with infections of unknown etiology had the least derange-
ment in these biomarkers.
Discussion
The results of the present study describe the generalized
host response of coagulopathy, inflammation, and endothelial
injury in patients with severe sepsis. Differences in the magni-
tude of abnormality and in the rate of normalization of the
markers were clearly observed when parsed by 28-day sur-
vival of patients with severe sepsis. Nonsurvivors had greater
derangement and less normalization of hemostasis, endothe-
lial injury, and inflammation. These observations, drawn from a
large number of patients selected with consistent entry crite-
ria, support the hypothesis that an out-of-control host
response of coagulopathy and inflammation in severe sepsis
may lead to multiorgan failure syndrome and death. The uni-
versal presence of systemic coagulopathy and inflammation
in patients with severe sepsis, as observed in this large study,
further supports the hypothesis of a tight association
between these two host responses [8].
The universal coagulopathy observed in patients with severe
sepsis is more reflective of activation of coagulation and
thrombin generation than of impaired fibrinolysis. Thrombin
generation markers TAT and F1.2 were present at study entry
in 95.5% and 77.5% of patients, respectively. Elevated PAI-1
was present at study entry in fewer than half of the patients.
In spite of elevated thrombin generation in these patients,
TAFI levels were decreased in about 18% of patients at base-
line. This is consistent with our understanding that TAFI is an
acute phase reactant [9].
Although 98.5% of patients had detectable levels of IL-6 at
baseline, only 9% and 53% of patients had detectable levels
of IL-1β and TNF-α, respectively. This is consistent with our
Critical Care April 2004 Vol 8 No 2 Kinasewitz et al.
Figure 5
Time courses of biomarkers of coagulation and inflammation in placebo-treated patients with severe sepsis for selected causative micro-organisms
are shown here as mean and 95% confidence intervals, using standard error of the mean and repeated measures analysis without imputing for
missing data. The number of observations at each time point appears below the x-axis by causative micro-organism class. *P < 0.05 (based on
repeated measures analysis).
R89
understanding that both IL-1β and TNF-α are expressed
earlier and are more transient cytokine responses to infection,
as compared with IL-6 [10]. Of the patients in this study, 40%
had IL-8 and IL-10 levels above the detection limit at study
entry. IL-8 levels in patients with severe sepsis have previously
been reported to be mostly below 100 pg/ml, which is the
detection limit for the assay used in this study. IL-10 is thought
to have anti-inflammatory properties and acts as a temporal
regulator of the transition from early sepsis to severe sepsis
[11,12]. Data from the study suggest that a rise in IL-10 levels
is also transient and may rise either before IL-6 or decrease
faster than IL-6 levels in response to infection.
A global improvement in coagulation markers was observed in
survivors as compared with nonsurvivors. Markers of ongoing
thrombin generation, TAT, F1.2, and D-dimer, improved more
rapidly in survivors than in nonsurvivors over time. Lorente and
coworkers [13] previously showed a similar difference in TAT
trend in survivors compared with nonsurvivors at day 7. The
prothrombotic host response to outcome observed in this
study is consistent with data reported by Gando and cowork-
ers [14] indicating that tissue factor antigen levels positively
correlated with the number of dysfunctional organs. Higher
levels of the anticoagulant factors protein C, protein S, and
antithrombin in placebo survivors than in nonsurvivors at base-
line, and the statistically significantly higher levels over time
during the course of the disease, confirm previous observa-
tions from smaller studies [13,15]. Finally, survivors exhibited
greater normalization of fibrinolytic potential than did nonsur-
vivors, as indicated by lower levels of PAI-1 and greater
increases in plasminogen levels with time. Hesselvik and
coworkers [16] previously showed an association between
higher PAI-1 levels and mortality from sepsis, and Lorente and
coworkers [13] showed that sepsis survivors exhibited greater
improvements in plasminogen levels.
Of the 13 coagulation markers that correlated with disease
severity, PT may be the most clinically useful. Consumption
and depletion of endogenous hemostasis factors occurs
frequently in patients with severe sepsis, as shown in this and
other studies, and may occur before the clinical diagnosis of
the first sepsis-associated acute organ dysfunction [17,18].
Prolongation of PT was found in more than 90% of the
patients with severe sepsis at entry to this large trial. Non-
surviving patients had mean PT values that were significantly
greater (more than 2 seconds greater) for a more prolonged
period of time than did patients who survived, suggesting
reduced consumption of extrinsic coagulation factors, which
is also consistent with the decreased levels of markers of
thrombin generation observed in patients who survived. Pro-
longation of PT reflects the depletion of hemostatic factors in
patients with severe sepsis and may be an initial indicator of
disseminated intravascular coagulopathy [19]. Similar obser-
vations were also made for 12 other biomarkers, but unlike
the other biomarkers PT is readily measurable in most clinical
settings.
Even though some of the 19 biomarkers were universally
outside the normal ranges in patients with severe sepsis at
study entry, and the distributions of most of these biomarkers
over the next several days were significantly different
between survivors and nonsurvivors at 28 days, no biomarker
could clearly predict the mortality outcome or correlate with
disease severity (APACHE II score). This is probably because
of the large variability in the levels of biomarkers between
individual patients. The distributions of the levels of the bio-
markers in the patients were wide, as indicated by the large
interquartile ranges reported in Table 2 and the wide 95%
confidence intervals in the figures. Genetic polymorphisms
and underlying comorbidities are some of the factors that
contribute to the large variability in the distributions of the bio-
markers between patients. Age and chronic health points are
important contributors to APACHE II scoring, but they may
not have any bearing on the levels of these biomarkers. This
may explain the rather weak correlation between the baseline
levels of these biomarkers with the APACHE II score.
Despite some rather modest differences described in this
report, the initial host inflammatory and coagulopathic
response to severe sepsis was remarkably similar in Gram-
positive, Gram-negative, polymicrobial, and fungal sepsis. This
study demonstrates that the clinical syndrome of severe
sepsis is characterized by systemic inflammation and coagulo-
pathy that may not be unique to a particular class of microbe.
Competing interests
SBY, SLU, BU and BB are all employees and stock holders
of Eli Lilly and Company, who have sponsored this study. JAR
has served as a consultant to Eli Lilly and Company, and was
a site investigator of the PROWESS, ENHANCE and
ADDRESS clinical trials. P-FL and J-FD have served as con-
sultants to Eli Lilly and Company. GTK, PC and AC have
declared no interests.
Available online />Key messages
• The present study showed a general host response of
deranged coagulation, inflammation, and endothelial
injury in a large population of patients with severe
sepsis from a well controlled clinical trial
• Markers of inflammation and coagulopathy correlated
with acute disease severity, as measured by baseline
APACHE II scores, and no differential response was
observed across causative micro-organism groups
• Baseline levels and evolution over time of markers of
inflammation, endothelial injury, coagulation, and fibri-
nolysis indicate that 28-day survival in severe sepsis is
associated with decreased inflammation, endothelial
injury, and thrombin generation, and restoration of anti-
coagulant factors and endogenous fibrinolytic potential
R90
Acknowledgements
This study was supported by Eli Lilly and Company, Indianapolis, IN,
USA. We should like to thank Chad Ray for measuring TNF-α, IL-1β, IL-
8, and IL-10 levels, Alexander Derchak and Matthew Monberg for
writing and editorial support, and David Nelson and Samiha Sarwat for
statistical support.
References
1. Angus DC, Linde-Zwirble WT, Lidicker J, Clermont G, Carcillo J,
Pinsky MR: Epidemiology of severe sepsis in the United
States: analysis of incidence, outcome, and associated costs
of care. Crit Care Med 2001, 29:1303-1310.
2. Bone RC, Balk RA, Cerra FB, Dellinger RP, Fein AM, Knaus WA,
Schein RM, Sibbald WJ: Definitions for sepsis and organ
failure and guidelines for the use of innovative therapies in
sepsis. Chest 1992, 101:1644-1655.
3. Corrigan JJ, Ray WL, May N: Changes in the blood coagulation
system associated with septicemia. N Engl J Med 1968, 279:
851-856.
4. ten Cate H, Timmerman JJ, Levi M: The pathophysiology of dis-
seminated intravascular coagulation. Thromb Haemost 1999,
82:713-717.
5. Brun-Buisson C, Doyon F, Carlet J, Dellamonica P, Gouin F, Lep-
outre A, Mercier JC, Offenstadt G, Regnier B: Incidence, risk
factors and outcome of severe sepsis and septic shock in
adults. JAMA 1995, 274:968-974.
6. Bernard GR, Vincent JL, Laterre PF, Larosa SP, Dhainaut JF,
Lopez-Rodriguez AL, Steingrub JS, Garber GE, Helterbrand JD,
Ely EW: Efficacy and safety of recombinant human activated
protein C for treatment of patients with severe sepsis. N Engl
J Med 2001, 344:699-709.
7. Fulton R, McDade R, Smith P, Kieker L, Kettman J: Advanced
multiplexed analysis with the FlowMetrix system. Clin Chem
1997, 43:1749-1756.
8. Webster NR: Inflammation and the coagulation system. Br J
Anaesth 2002, 89:216-220.
9. Boffa MB, Hamill JD, Bastajian N, Dillon R, Nesheim ME, Koschin-
sky ML: A role for CCAAT/Enhancer-binding protein in hepatic
expression of thrombin-activable fibrinolysis inhibitor. J Biol
Chem 2002, 277:25329-25336.
10. van der Poll T, Lowry SF: Tumor necrosis factor in sepsis:
mediator of multiple organ failure or essential part of host
defense? Shock 1995, 3:1-12.
11. Oberholzer A, Oberholzer C, Moldawer LL: Interleukin-10: a
complex role in the pathogenesis of sepsis syndromes and
its potential as an anti-inflammatory drug. Crit Care Med
2002, Suppl:S58-S63.
12. Latifi SQ, O’Riordan MA, Lavine AD: Interleukin-10 controls the
onset of irreversible septic shock. Infect Immun 2002, 70:4441-
4446.
13. Lorente JA, Garcia-Frade LJ, Landin L, de Pablo R, Torrado C, Renes
E, Garcia-Avello A: Time course of hemostatic abnormalities in
sepsis and its relation to outcome. Chest 1993, 103:1536-1542.
14. Gando S, Nanzaki S, Sasaki S, Kenichiro A: Activation of the
extrinsic coagulation pathway in patients with severe sepsis
and septic shock. Crit Care Med 1998, 26:2005-2009.
15. Martinez MA, Pena JM, Fernandez A, Jimenez M, Juarez S, Madero
R, Vazquez JJ: Time course and prognostic significance of
hemostatic changes in sepsis: relation to tumor necrosis
factor-
αα
. Crit Care Med 1999, 27:1303-1308.
16. Hesselvik JF, Blomback M, Brodin B, Maller R: Coagulation, fibri-
nolysis, and kallikrein systems in sepsis: relation to outcome.
Crit Care Med 1989, 17:724-733.
17. Mesters RM, Mannucci PM, Coppola R, Keller T, Ostermann H,
Kienast J: Factor VIIa and antithrombin III activity during
severe sepsis and septic shock in neutropenic patients. Blood
1996, 88:881-886.
18. Mesters RM, Helterbrand J, Utterback BG, Yan SB, Chao B, Fer-
nandaz JA, Griffin JH, Hartman DL: Prognostic value of protein C
levels in neutropenic patients at high risk of severe septic
complications. Crit Care Med 2000, 28:2209-2216.
19. Taylor FB, Toh CH, Hoots WK, Wada H, Levi M: Towards defini-
tion, clinical and labortory criteria, and a scoring system for
disseminated intravascular coagulation (on behalf of the sci-
entific subcommittee on disseminated intravascular coagula-
tion (DIC) of the international society on thrombosis and
haemostasis (ISTH). Thromb Haemost 2001, 86:1327-1330.
Addendum
The role of each of the authors is as follows: GT Kinasewitz
participated in the collection of the data, data analysis, and
the writing of the manuscript; SB Yan was involved in the
conception, design, and execution of the biomarkers and the
writing of the manuscript; B Basson was the statistician
responsible for the data analyses in this manuscript; P Comp
was involved with the analysis of the data and the writing of
the manuscript; JA Russell and A Cariou were involved in the
writing of the manuscript; SL Um performed biomarker
assays and reviewed this manuscript; B Utterback was
involved in the conception, design, and execution of the bio-
markers in the study and participated in writing the manu-
script; P Laterre collected data and reviewed the manuscript;
and JF Dhainaut was involved in the design and execution of
the study.
Critical Care April 2004 Vol 8 No 2 Kinasewitz et al.