Báo cáo y học: "Increased blood flow prevents intramucosal acidosis in sheep endotoxemia: a controlled study" pptx
Bạn đang xem bản rút gọn của tài liệu. Xem và tải ngay bản đầy đủ của tài liệu tại đây (261.71 KB, 8 trang )
Open Access
Available online />R66
February 2005 Vol 9 No 2
Research
Increased blood flow prevents intramucosal acidosis in sheep
endotoxemia: a controlled study
Arnaldo Dubin
1
, Gastón Murias
2
, Bernardo Maskin
3
, Mario O Pozo
2
, Juan P Sottile
4
,
Marcelo Barán
5
, Vanina S Kanoore Edul
4
, Héctor S Canales
6
, Julio C Badie
4
, Graciela Etcheverry
7
and Elisa Estenssoro
8
1
Medical Director, Intensive Care Unit, Sanatorio Otamendi y Miroli, Buenos Aires Argentina
2
Staff Physician, Intensive Care Unit, Clinicas Bazterrica y Santa Isabel, Buenos Aires, Argentina
3
Medical Director, Intensive Care Unit, Hospital Posadas, Buenos Aires, Argentina
4
Research Fellow, Cátedra de Farmacología, Facultad de Ciencias Médicas, Universidad Nacional de La Plata, Argentina
5
Medical Director, Renal Transplantation Unit, CRAI Sur, CUCAIBA, Argentina
6
Staff Physician, Intensive Care Unit, Hospital San Martin de la Plata, Argentina
7
Staff Physician, Clinical Chemistry Laboratory, Hospital San Martin de La Plata, Argentina
8
Medical Director, Intensive Care Unit, Hospital San Martin de la Plata, Argentina
Corresponding author: Arnaldo Dubin,
Abstract
Introduction Increased intramucosal–arterial carbon dioxide tension (PCO
2
) difference (∆PCO
2
) is common in experimental
endotoxemia. However, its meaning remains controversial because it has been ascribed to hypoperfusion of intestinal villi or
to cytopathic hypoxia. Our hypothesis was that increased blood flow could prevent the increase in ∆PCO
2
.
Methods In 19 anesthetized and mechanically ventilated sheep, we measured cardiac output, superior mesenteric blood flow,
lactate, gases, hemoglobin and oxygen saturations in arterial, mixed venous and mesenteric venous blood, and ileal
intramucosal PCO
2
by saline tonometry. Intestinal oxygen transport and consumption were calculated. After basal
measurements, sheep were assigned to the following groups, for 120 min: (1) sham (n = 6), (2) normal blood flow (n = 7)
and (3) increased blood flow (n = 6). Escherichia coli lipopolysaccharide (5 µg/kg) was injected in the last two groups. Saline
solution was used to maintain blood flood at basal levels in the sham and normal blood flow groups, or to increase it to about
50% of basal in the increased blood flow group.
Results In the normal blood flow group, systemic and intestinal oxygen transport and consumption were preserved, but
∆PCO
2
increased (basal versus 120 min endotoxemia, 7 ± 4 versus 19 ± 4 mmHg; P < 0.001) and metabolic acidosis with
a high anion gap ensued (arterial pH 7.39 versus 7.35; anion gap 15 ± 3 versus 18 ± 2 mmol/l; P < 0.001 for both). Increased
blood flow prevented the elevation in ∆PCO
2
(5 ± 7 versus 9 ± 6 mmHg; P = not significant). However, anion-gap metabolic
acidosis was deeper (7.42 versus 7.25; 16 ± 3 versus 22 ± 3 mmol/l; P < 0.001 for both).
Conclusions In this model of endotoxemia, intramucosal acidosis was corrected by increased blood flow and so might follow
tissue hypoperfusion. In contrast, anion-gap metabolic acidosis was left uncorrected and even worsened with aggressive
volume expansion. These results point to different mechanisms generating both alterations.
Keywords: Carbon dioxide, oxygen consumption, blood flow, endotoxemia, metabolic acidosis
Received: 23 September 2004
Revisions requested: 13 October 2004
Revisions received: 21 November 2004
Accepted: 22 November 2004
Published: 11 January 2005
Critical Care 2005, 9:R66-R73 (DOI 10.1186/cc3021)
This article is online at: />© 2005 Dubin et al.; licensee BioMed Central Ltd.
This is an Open Access article distributed under the terms of the
Creative Commons Attribution License ( />licenses/by/2.0), which permits unrestricted use, distribution, and
reproduction in any medium, provided the original work is properly
cited.
C
a
O
2
= arterial oxygen content; CCO
2
= CO
2
content; C
vm
O
2
= mesenteric venous oxygen content; C
v
O
2
= mixed venous oxygen content; DO
2
=
systemic oxygen transport; DO
2i
= intestinal oxygen transport; ∆PCO
2
= intramucosal minus arterial PCO
2
gradient; F
I
O
2
= fraction of inspired oxygen;
PCO
2
= carbon dioxide tension; PO
2
= partial pressure of oxygen; Q = cardiac output; Q
intestinal
= intestinal blood flow; R
a-v
= global blood capacity
for transporting CO
2
; VCO
2
= systemic CO
2
production; VCO
2i
= intestinal CO
2
production; VO
2
= systemic oxygen consumption; VO
2i
= intestinal
oxygen consumption.
Critical Care February 2005 Vol 9 No 2 Dubin et al.
R67
Introduction
Rapid resolution of tissue hypoxia is the cornerstone of the
treatment of sepsis and septic shock [1]. Patients who spon-
taneously develop high oxygen transport have better out-
comes [2]. In experimental models of sepsis, animals with
spontaneous elevation of oxygen transport present improved
survival [3]. In addition, mortality from sepsis and septic shock
could be reduced by early goal-directed therapy [4].
The intramucosal minus arterial carbon dioxide tension (PCO
2
)
gradient (∆PCO
2
) is considered a sensitive marker of regional
gut perfusion [5] and is frequently found in human sepsis and
in experimental endotoxemia. Because intramucosal acidosis
can appear with normal or increased blood flow, it has been
ascribed to a defect in cellular metabolism, namely cytopathic
hypoxia [6]. It has also been related to decreased perfusion of
villi [7]. Vasodilators might correct these microcirculatory def-
icits [8-10], but volume expansion or inotropic drugs have
often failed to reverse intramucosal acidosis [11-14].
Our goal was to evaluate the effects of supranormal elevations
of blood flow on oxygen transport and tissue oxygenation in a
sheep model of endotoxemia. Our hypothesis was that
increased blood flow could prevent the increase in ∆PCO
2
and improve systemic metabolic acidosis.
Methods
Surgical preparation
Nineteen sheep were anesthetized with 30 mg/kg sodium
pentobarbital, then intubated and mechanically ventilated
(Dual Phase Control Respirator Pump Ventilator; Harvard
Apparatus, South Natick, MA, USA) with a tidal volume of 15
ml/kg, a fraction of inspired oxygen (F
I
O
2
) of 0.21 and positive
end-expiratory pressure adjusted to maintain O
2
arterial satu-
ration at more than 90%. The respiratory rate was set to keep
the end-tidal PCO
2
at 35 mmHg. Neuromuscular blockade
was performed with intravenous pancuronium bromide (0.06
mg/kg). Additional pentobarbital boluses (1 mg/kg per hour)
were administered as required.
Catheters were advanced through the left femoral vein to
administer fluids and drugs, and through the left femoral artery
to measure blood pressure and to obtain blood gases. A pul-
monary artery catheter was inserted through right external jug-
ular vein (Flow-directed thermodilution fiberoptic pulmonary
artery catheter; Abbott Critical Care Systems, Mountain View,
CA, USA).
An orogastric tube was inserted to allow drainage of gastric
contents. A midline laparotomy and splenectomy were then
performed. An electromagnetic flow probe was placed around
the superior mesenteric artery to measure intestinal blood
flow. A catheter was placed in the mesenteric vein through a
small vein proximal to the gut to draw blood gases. A tonome-
ter was inserted through a small ileotomy to measure intramu-
cosal PCO
2
. Lastly, after careful hemostasis, the abdominal
wall incision was closed.
Measurements and derived calculations
Arterial, systemic, pulmonary and central venous pressures
were measured with corresponding transducers (Statham
P23 AA; Statham, Halo Rey, Puerto Rico). Cardiac output was
measured by thermodilution with 5 ml of saline solution (HP
OmniCare Model 24 A 10; Hewlett Packard, Andover, MA,
USA) at 0°C. An average of three measurements taken ran-
domly during the respiratory cycle were considered and were
normalized to body weight to yield Q. Intestinal blood flow was
measured by the electromagnetic method (Spectramed Blood
Flowmeter model SP 2202 B; Spectramed Inc., Oxnard, CA,
USA) with in vitro calibrated transducers 5–7 mm in diameter
(Blood Flowmeter Transducer; Spectramed Inc.). Occlusive
zero was controlled before and after each experiment. Non-
occlusive zero was corrected before each measurement.
Superior mesenteric blood flow was normalized to gut weight
(Q
intestinal
).
Arterial, mixed venous and mesenteric venous partial pressure
of oxygen (PO
2
), PCO
2
and pH were measured with a blood
gas analyzer (ABL 5; Radiometer, Copenhagen, Denmark),
and hemoglobin and oxygen saturation were measured with a
co-oximeter calibrated for sheep blood (OSM 3; Radiometer).
Arterial, mixed venous and mesenteric venous contents (C
a
O
2
,
C
v
O
2
and C
vm
O
2
, respectively) were calculated as (Hb × 1.34
× O
2
saturation) + (PO
2
× 0.0031). Systemic and intestinal
oxygen transport and oxygen consumption (DO
2
, VO
2
, DO
2i
and VO
2i
, respectively) were calculated as DO
2
= Q × C
a
O
2
;
VO
2
= Q × (C
a
O
2
- C
v
O
2
); DO
2i
= Q
intestinal
× C
a
O
2
, and VO
2i
= Q
intestinal
× (C
a
O
2
- C
vm
O
2
).
Intramucosal PCO
2
was measured with a tonometer [15]
(TRIP Sigmoid Catheter; Tonometrics, Inc., Worcester, MA,
USA) filled with 2.5 ml of saline solution; 1.0 ml was discarded
after an equilibration period of 30 min and PCO
2
was meas-
ured in the remaining 1.5 ml. Its value was corrected to the cor-
responding equilibration period and was used to calculate
∆PCO
2
.
Mixed venous–arterial and mesenteric venous–arterial PCO
2
differences were also calculated. Arterial, mixed venous and
mesenteric venous CO
2
contents (CCO
2
) and their differ-
ences were calculated with Douglas's algorithm [16]. Sys-
temic and intestinal CO
2
production (VCO
2
and VCO
2i
,
respectively) were calculated as VCO
2
= Q × mixed venoarte-
rial CCO
2
, and VCO
2i
= Q
intestinal
× mesenteric venoarterial
CCO
2
. Global blood capacity for transporting CO
2
was evalu-
ated as the ratio between venoarterial CCO
2
and PCO
2
differ-
ences (R
a-v
). This index has been used to evaluate the amount
of CO
2
transported by the blood in relation to the venoarterial
gradient of PCO
2
[17].
Available online />R68
Lactate, sodium, potassium, chloride and serum total proteins
were measured with an automatic analyzer every 60 min (Auto-
matic Analyzer Hitachi 912; Boehringer Mannheim Corpora-
tion, Indianapolis, IN, USA). Anion gap was calculated as
([Na
+
] + [K
+
]) - ([Cl
-
] + [HCO
3
-
]). Anion gap was corrected for
changes in plasma protein concentration [18].
Experimental procedure
Basal measurements were taken after a stabilization period
longer than 30 min. Then animals were assigned to the follow-
ing groups: (1) sham group (n = 6), consisting of sheep receiv-
ing 100 ml of saline in 10 min, followed by an infusion
necessary to keep intestinal blood flow at basal levels; (2) nor-
mal blood flow group (n = 7), consisting of sheep receiving 5
µg/kg Escherichia coli lipopolysaccharide dissolved in 100 ml
of saline in 10 min, and then saline infusion so as to maintain
intestinal blood flow at basal levels; and (3) increased blood
flow group (n = 6), consisting of sheep receiving 5 µg/kg
Escherichia coli lipopolysaccharide dissolved in 100 ml of
saline in 10 min, followed by saline infusion so as to increase
intestinal blood flow by 50% from basal levels.
F
I
O
2
was increased to 0.50 in endotoxemic sheep to avoid
deep hypoxemia.
Measurements were performed at 30 min intervals for 120 min
from the start of endotoxin administration.
At the end of the experiment, the animals were killed with an
additional dose of pentobarbital and a KCl bolus. A catheter
was inserted in the superior mesenteric artery and Indian ink
was instilled through it. Dyed intestinal segments were dis-
sected, washed and weighed for the calculation of gut
indexes.
The local Animal Care Committee approved the study. Care of
animals was in accordance with National Institute of Health
guidelines.
Statistical analysis
Data were assessed for normality and expressed as means ±
SD. Differences within groups were analyzed with a repeated-
measures analysis of variance and Dunnett's multiple compar-
isons test to compare each time point with basal. One-time
comparisons between groups were tested with a one-way
analysis of variance and a Newman–Keuls multiple compari-
son test.
Results
Hemodynamic and oxygen transport effects
Sham, normal blood flow and increased blood flow groups
received 10 ± 6, 24 ± 9 and 91 ± 38 ml/kg per hour, respec-
tively, of normal saline solution (P < 0.05) to achieve resusci-
tation goals. Variations of intestinal blood flow from basal
values, at the end of the experiment, were 8 ± 5%, – 1 ± 22%
and 60 ± 22%, respectively (P < 0.05). As expected, the
increased blood flow group had higher central venous and pul-
monary wedge pressures, intestinal blood flow, cardiac output
and systemic oxygen transport than the normal blood flow
group. The increased blood flow group had also higher intes-
tinal oxygen consumption (Table 1).
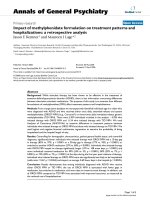
Metabolic effects
Metabolic acidosis developed in both groups with endotox-
emia, but was greater in the increased blood flow group
because of hyperchloremia and an increased anion gap (Table
2 and Fig. 1). These variables did not change in the sham
group. Lactate levels remained stable in the three groups
(Table 2).
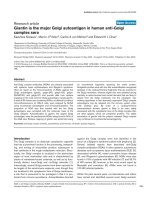
Effects on ∆PCO2 and its determinants
∆PCO
2
increased in the normal blood flow group and
remained unchanged in the increased blood flow and sham
groups (Fig. 2). Systemic and intestinal venoarterial PCO
2
dif-
ferences were also higher in the normal blood flow group than
in the others (Table 3). Systemic and intestinal R
a-v
were lower
in both endotoxemic groups.
Discussion
The main finding of this study was that increased blood flow
prevented the development of intramucosal acidosis. How-
ever, anion-gap metabolic acidosis was larger in hyperresusci-
tated animals. These results underscore the different
underlying mechanisms of each type of acidosis.
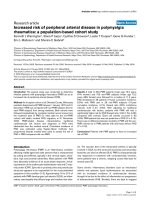
Figure 1
Behavior of the anion gap in the sham, normal and increased blood flow groupsBehavior of the anion gap in the sham, normal and increased blood flow
groups. A higher degree of anion-gap metabolic acidosis developed in
the increased blood flow group than in the normal blood flow group.
The anion gap was unchanged in the sham group. 60' and 120' refer to
60 and 120 min, respectively.
Critical Care February 2005 Vol 9 No 2 Dubin et al.
R69
The experimental model of endotoxemia
We used a short-term infusion of endotoxin followed by saline
expansion to induce a state of normodynamic shock, with
preserved cardiac output and intestinal blood flow [19,20]. A
state of normodynamic shock was chosen as a control group
to avoid CO
2
accumulation caused by macrovascular hypop-
erfusion. We found that intramucosal acidosis and systemic
metabolic acidosis occurred, in spite of stable systemic and
gut oxygen transports and consumptions.
The reason for increased intestinal ∆PCO
2
in sepsis remains
controversial [21]. It might reflect hypoperfusion, but has also
been found in normodynamic states [22]. Vallet and col-
leagues studied endotoxemic dogs with low blood flow, resus-
citated with dextran. Gut flow was increased and oxygen
transport normalized, but oxygen uptake and mucosal PO
2
and
pH remained low, results that were ascribed to flow redistribu-
tion from mucosal to serosal layers [13]. Conversely, Revelly
and colleagues described flow redistribution from serosa to
Table 1
Systemic and intestinal hemodynamic and oxygen transport parameters in sham, normal and increased blood flow groups
Parameter Group Basal Endotoxemia
30 min 60 min 90 min 120 min
Mean arterial pressure (mmHg) Sham 81 ± 10 85 ± 15 88 ± 15 91 ± 16 92 ± 19
Normal 93 ± 19 89 ± 25 83 ± 23 91 ± 32 94 ± 26
Increased 90 ± 17 98 ± 17 89 ± 18 89 ± 21 99 ± 17
Mean pulmonary arterial pressure (mmHg) Sham 16 ± 3 15 ± 3 16 ± 3 15 ± 4 16 ± 4
Normal 15 ± 5 34 ± 9*† 26 ± 8*† 25 ± 7*† 24 ± 6*†
Increased 20 ± 4 35 ± 10*† 31 ± 4*† 34 ± 6*†‡ 35 ± 6*†‡
Pulmonary wedge pressure (mmHg) Sham 5 ± 2 5 ± 2 5 ± 1 5 ± 2 5 ± 2
Normal 5 ± 2 11 ± 4*† 8 ± 2*† 8 ± 3*† 8 ± 4
Increased 6 ± 1 11 ± 4*† 13 ± 6*† 12 ± 3*† 14 ± 5*†‡
Central venous pressure (mmHg) Sham 5 ± 5 5 ± 3 6 ± 5 5 ± 4 5 ± 4
Normal 4 ± 2 5 ± 3 6 ± 2 6 ± 2 5 ± 3
Increased 4 ± 2 8 ± 3 9 ± 5* 10 ± 4*†‡ 11 ± 4*†‡
Cardiac output (ml/kg per min) Sham 134 ± 30 148 ± 36 153 ± 37 144 ± 33 151 ± 41
Normal 139 ± 43 117 ± 27 135 ± 38 149 ± 42 142 ± 34
Increased 157 ± 51 221 ± 64*†‡ 257 ± 67*†‡ 276 ± 84*†‡ 290 ± 91*†‡
Superior mesenteric artery blood flow (ml/min per g) Sham 498 ± 107 568 ± 126* 551 ± 126* 548 ± 134* 539 ± 131*
Normal 553 ± 184 514 ± 152 566 ± 161 573 ± 145 529 ± 169
Increased 578 ± 206 803 ± 226*‡ 794 ± 209*†‡ 863 ± 326*‡ 923 ± 370*†‡
Increased 362 ± 116 437 ± 75†‡ 286 ± 53 336 ± 102 295 ± 75
Systemic oxygen transport (ml/min per kg) Sham 16.2 ± 4.5 18.0 ± 5.6* 19.0 ± 6.2* 17.8 ± 5.3 18.8 ± 6.1*
Normal 16.4 ± 6.6 13.3 ± 4.9 14.0 ± 4.8 16.4 ± 6.4 15.8 ± 5.7
Increased 17.2 ± 4.0 23.0 ± 5.5*‡ 25.5 ± 6.7*‡ 26.0 ± 8.4*‡ 26.9 ± 9.9*‡
Systemic oxygen consumption (ml/min per kg) Sham 6.4 ± 0.8 6.4 ± 1.1 6.8 ± 1.3 6.6 ± 1.2 7.2 ± 1.3
Normal 6.4 ± 1.2 5.3 ± 1.2* 5.8 ± 1.6* 6.0 ± 1.5 6.5 ± 1.4
Increased 7.6 ± 0.9 7.6 ± 2.0‡ 7.3 ± 2.1 7.4 ± 2.2 8.3 ± 3.2
Intestinal oxygen transport (ml/min per kg) Sham 62.3 ± 22.2 71.4 ± 24.8* 70.8 ± 25.1* 69.9 ± 24.6* 69.1 ± 24.0*
Normal 64.0 ± 22.6 56.1 ± 19.3 57.0 ± 15.8 60.8 ± 18.4 56.5 ± 17.0
Increased 64.3 ± 16.7 86.4 ± 19.1*‡ 81.4 ± 22.1* 82.2 ± 23.5* 87.1 ± 23.6*‡
Intestinal oxygen consumption (ml/min per kg) Sham 21.7 ± 4.0 21.1 ± 3.7 22.0 ± 3.2 22.7 ± 4.2 21.8 ± 4.7
Normal 21.2 ± 4.1 22.1 ± 6.5 22.7 ± 8.9 22.6 ± 7.8 22.4 ± 9.0
Increased 29.3 ± 9.7 28.9 ± 9.3 32.5 ± 13.0 29.8 ± 9.4 37.2 ± 12.3†‡
* P < 0.05 versus basal. † P < 0.05 versus sham. ‡ P < 0.05 versus normal. Sham, sham group; normal, normal blood flow group; increased,
increased blood flow group.
Available online />R70
mucosa induced by endotoxin [23]. VanderMeer and col-
leagues found that intramucosal acidosis developed despite
preserved blood flow and tissue PO
2
in endotoxemic pigs,
attributed to changes in energetic metabolism [24]. Thus, the
concept of 'cytopathic hypoxia' was introduced [6].
However, cytopathic hypoxia and increased anaerobic CO
2
production might not be the sole explanation for the increase
in ∆PCO
2
. Vallet and colleagues [25] and Dubin and col-
leagues [26] recently showed that hypoperfusion is a key fac-
tor in the development of venous and tissue hypercarbia. In
addition, Tugtekin and colleagues showed an association
between increased ∆PCO
2
and diminished villi microcircula-
tion [7].
This body of information suggests that intramucosal acidosis
in sepsis is due mainly to microcirculatory alterations, even
though cardiac output and regional flows might remain
unchanged. Disturbed energetic metabolism might be present
in sepsis, but it does not explain intramucosal acidosis. How-
ever, it might be a reasonable explanation for the development
of systemic metabolic acidosis in our experiments. Increased
anion-gap metabolic acidosis appeared despite preserved
oxygen metabolism. As described previously, metabolic acido-
sis was not explained by elevations of lactate but by increases
in unmeasured anions whose source and identification are still
unknown [27,28].
Effects of saline solution expansion on intramucosal
acidosis
Increased blood flow by volume expansion prevented ∆PCO
2
elevation. PCO
2
gradients, venoarterial and tissue-arterial
PCO
2
differences are the result of interactions between CO
2
production, blood capacity to transport CO
2
and blood flow to
Table 2
Arterial hemoglobin, acid-base and metabolic parameters in sham, normal and increased blood flow groups
Parameter Group Basal Endotoxemia
30 min 60 min 90 min 120 min
Hemoglobin (g/l) Sham 9.6 ± 2.4 9.7 ± 2.7 9.9 ± 2.3 9.8 ± 2.2 9.9 ± 2.2
Normal 9.1 ± 2.3 9.0 ± 2.4 8.4 ± 2.0* 8.1 ± 2.2* 8.3 ± 2.4*
Increased 8.9 ± 2.2 8.2 ± 2.3* 7.8 ± 2.4* 7.6 ± 2.5* 7.7 ± 2.5*
pH Sham 7.44 ± 0.03 7.45 ± 0.02 7.45 ± 0.03 7.47 ± 0.02 7.47 ± 0.03
Normal 7.39 ± 0.07 7.34 ± 0.08*† 7.31 ± 0.05*† 7.34 ± 0.05*† 7.35 ± 0.06*†
Increased 7.42 ± 0.04 7.35 ± 0.05*† 7.31 ± 0.05*† 7.28 ± 0.08*† 7.25 ± 0.08*†‡
PCO
2
(mmHg) Sham 35 ± 3 34 ± 3 34 ± 3 33 ± 3 34 ± 4
Normal 35 ± 4 38 ± 6* 41 ± 7* 37 ± 6 35 ± 6
Increased 34 ± 2 36 ± 5 34 ± 3 34 ± 5 37 ± 6
PO
2
(mmHg) Sham 85 ± 13 88 ± 18 86 ± 16 88 ± 17 84 ± 15
Normal 87 ± 16 119 ± 59 105 ± 39 123 ± 20*† 134 ± 43*†
Increased 90 ± 23 150 ± 48*† 132 ± 21*† 101 ± 20 99 ± 31
[HCO
3
-
] (mmol/l) Sham 24 ± 2 24 ± 3 24 ± 3 24 ± 3 24 ± 3
Normal 21 ± 2 21 ± 2 20 ± 2† 20 ± 2*† 19 ± 2*†
Increased 22 ± 3 20 ± 2*† 17 ± 3*† 16 ± 3*†‡ 16 ± 2*†‡
Base excess (mmol/l) Sham 1 ± 3 1 ± 3 1 ± 3 2 ± 3 2 ± 3
Normal t2 ± 4 t5 ± 3*† t5 ± 2*† t5 ± 3*† t5 ± 3*†
Increased t1 ± 4 t4 ± 3*† t8 ± 4*† t10 ± 4*† t10 ± 3*†‡
[Cl
-
]/[Na
+
] Sham 0.76 ± 0.02 0.76 ± 0.03 0.76 ± 0.03
Normal 0.76 ± 0.01 0.77 ± 0.02 0.77 ± 0.01
Increased 0.76 ± 0.02 0.78 ± 0.02* 0.80 ± 0.02*†‡
Lactate (mmol/l) Sham 2.1 ± 0.7 2.0 ± 0.7 1.8 ± 0.6
Normal 1.7 ± 0.8 1.9 ± 0.7 2.2 ± 1.1
Increased 2.2 ± 1.6 1.7 ± 1.1 1.9 ± 1.1
* P < 0.05 versus basal. † P < 0.05 versus sham. ‡ P < 0.05 versus normal. Sham, sham group; normal, normal blood flow group; increased,
increased blood flow group.
Critical Care February 2005 Vol 9 No 2 Dubin et al.
R71
tissues. We and others have previously shown that ∆PCO
2
fails to reflect tissue hypoxia when blood flow is preserved
[25,26,29]. Our results suggest that intramucosal acidosis is
related mainly to local hypoperfusion, because the only differ-
ence between our groups, in terms of PCO
2
difference deter-
minants, was the level of blood flow. We can speculate that
volume expansion might improve microcirculation and, subse-
quently, CO
2
clearance. However, intramucosal acidosis
might be corrected by the inhibition of inducible nitric oxide
synthase and without microcirculatory recruitment [30].
Improvement of cellular metabolism and/or redistribution of
blood flow from the mucosa to other layers have been pro-
posed as underlying mechanisms. We cannot exclude the
possibility that increases in blood flow might decrease tissue
hypoxia and anaerobically generated CO
2
. Intestinal VO
2
increased after elevation of O
2
transport in the increased
blood flow group, suggesting unmet needs in the normal blood
flow group. Flow might have been inadequate in the face of
increased metabolic requirements caused by endotoxemia
[31].
Despite this apparent dependence on intestinal oxygen sup-
ply, CO
2
production remained stable. Possible reasons are
error propagation in the VO
2
and VCO
2
calculations, or an
increase in VO
2
due to non-metabolic processes, such as the
production of inflammatory reactants and reactive oxygen spe-
cies [32].
Other investigators have reported that volume expansion
could not correct intramucosal acidosis, in both clinical and
experimental settings [11,13,14]. Differences in the level of
attained blood flow, timing of expansion or the type of injury
might account for these findings opposite to ours.
Potential limitations of our study are related to the errors of
saline tonometry, such as inadequate equilibration time,
Table 3
Systemic and intestinal CO
2
-derived parameters in sham, normal and increased blood flow groups
Parameter Group Basal Endotoxemia
30 min 60 min 90 min 120 min
Mixed venous – arterial PCO
2
(mmHg) Sham 6 ± 2 6 ± 2 6 ± 2 6 ± 2 5 ± 2
Normal 7 ± 2 8 ± 2 7 ± 2 8 ± 3 8 ± 3†
Increased 6 ± 2 6 ± 3 7 ± 5 7 ± 4 4 ± 1‡
Mesenteric venous – arterial PCO
2
(mmHg) Sham 6 ± 2 5 ± 2 5 ± 2 6 ± 2 5 ± 2
Normal 7 ± 2 8 ± 2 8 ± 3 10 ± 4 10 ± 2*†
Increased 8 ± 3 6 ± 2 8 ± 4 8 ± 3 6 ± 1*‡
Intramucosal – arterial PCO
2
(mmHg) Sham 4 ± 4 5 ± 8 5 ± 8 5 ± 8 6 ± 9
Normal 7 ± 4 6 ± 5 12 ± 5 15 ± 6*‡ 19 ± 4*‡
Increased 5 ± 7 2 ± 9 7 ± 7 12 ± 8 9 ± 6†
Systemic VCO
2
(ml/min per kg) Sham 5.2 ± 1.9 4.5 ± 1.2 4.0 ± 1.5 4.7 ± 1.2 4.6 ± 1.8
Normal 6.0 ± 2.4 4.9 ± 1.4 4.9 ± 1.7 5.0 ± 1.3 5.0 ± 1.7
Increased 6.5 ± 2.5 4.8 ± 2.4 6.1 ± 2.8 5.8 ± 2.3 5.8 ± 4.7
Intestinal VCO
2
(ml/min per kg) Sham 36.7 ± 10.9 38.1 ± 11.3 34.0 ± 8.8 43.2 ± 10.6 36.7 ± 5.6
Normal 37.7 ± 10.9 35.3 ± 11.6 37.2 ± 13.7 41.8 ± 20.3 36.7 ± 16.2
Increased 36.5 ± 21.8 35.3 ± 14.6 27.4 ± 9.4 35.8 ± 12.9 34.0 ± 7.4
Mixed venous blood capacity for
transporting CO
2
(ml/100 ml per mmHg)
Sham 0.67 ± 0.12 0.59 ± 0.40 0.51 ± 0.11 0.61 ± 0.21 0.61 ± 0.13
Normal 0.62 ± 0.12 0.49 ± 0.12* 0.55 ± 0.04* 0.47 ± 0.09* 0.44 ± 0.09*†
Increased 0.67 ± 0.24 0.38 ± 0.27* 0.42 ± 0.24* 0.45 ± 0.19* 0.48 ± 0.12*†
Mesenteric venous blood capacity for
transporting CO
2
(ml/100 ml per mmHg)
Sham 1.14 ± 0.24 1.15 ± 0.32 1.22 ± 0.29 1.37 ± 0.22 1.28 ± 0.08
Normal 1.04 ± 0.22 0.99 ± 0.38 0.86 ± 0.24† 0.78 ± 0.33*† 0.76 ± 0.24*†
Increased 1.17 ± 0.45 0.85 ± 0.29 0.66 ± 0.27† 0.81 ± 0.19† 0.69 ± 0.18*†
* P < 0.05 versus basal. † P < 0.05 versus sham. ‡ P < 0.05 versus normal. Sham, sham group; normal, normal blood flow group; increased,
increased blood flow group.
Available online />R72
deadspace effect and underestimation of PCO
2
by blood gas
analyzers [33,34].
Effects of saline solution expansion on metabolic
acidosis
Metabolic acidosis was a prominent finding in our study.
Expansion with large volumes of saline predictably produced
hyperchloremic metabolic acidosis [35]. In addition, metabolic
acidosis arose as a result of unmeasured anions. Previous
research has shown that during streptococcal infusion in pigs,
metabolic acidosis decreased, but did not disappear, when
oxygen transport was supported with dextran and red blood
cells [36].
The reason for augmented unmeasured anions in the
increased blood flow group is unclear. Possible causes are
washout of tissue acids by high blood flow, or an impairment
of oxygenation caused by tissue edema. Nevertheless, Gow
and colleagues have shown that oxygen extraction is already
altered in septic animals, so increased diffusion distances
would not be relevant [37].
In addition, hyperchloremic acidosis might induce an inflam-
matory response, cellular dysfunction and apoptosis, and
increased mortality in experimental septic shock [38-41]. In
this way, a deleterious effect of acidosis on cellular function
with the subsequent production of unknown anions might be
operative.
Conclusions
Despite preserved blood flow and oxygen transport, intramu-
cosal acidosis developed in endotoxemic sheep. Volume
expansion prevented the increase in ∆PCO
2
, implying that
intramucosal acidosis is related mainly to local hypoperfusion.
Despite aggressive expansion, anion-gap metabolic acidosis
worsened, which suggests an effect on cellular metabolism.
Competing interests
The author(s) declare that they have no competing interests.
Authors' contributions
AD was responsible for the study concept and design, the
analysis and interpretation of data, and drafting of the manu-
script. GM, MOP, VSKE and HSC performed the acquisition
of data and contributed to the draft of the manuscript. BM and
GE conducted the blood determinations and contributed to
the draft of the manuscript. MB and JPS performed the surgi-
cal preparation and contributed to the discussion. EE helped
in the draft of the manuscript and made a critical revision for
important intellectual content. All authors read and approved
the final manuscript.
References
1. Natanson C, Hoffman WD, Suffredini AF, Eichacker PQ, Danner
RL: Selected treatment strategies for septic shock based on
proposed mechanisms of pathogenesis. Ann Intern Med 1994,
120:771-783.
2. Shoemaker WC, Montgomery ES, Kaplan E, Elwyn DH: Physio-
logic patterns in surviving and nonsurviving shock patients.
Arch Surg 1973, 106:630-636.
3. Pittet JF, Pastor CM, Morel DR: Spontaneous high systemic oxy-
gen delivery increases survival rate in awake sheep during
sustained endotoxemia. Crit Care Med 2000, 28:496-503.
4. Rivers E, Nguyen B, Hvastad S, Ressler J, Muzzin A, Knoblich B,
Peterson E, Tomlanovich M, for the Early Goal-directed Therapy
Collaborative Group: Early goal-directed therapy in the treat-
ment of severe sepsis and septic shock. N Engl J Med 2001,
345:1368-1377.
5. Dubin A, Estenssoro E, Murias G, Canales H, Sottile P, Badie J,
Barán M, Pálizas F, Laporte M, Rivas Díaz M: Effects of hemor-
rhage on gastrointestinal oxygenation. Intensive Care Med
2001, 27:1931-1936.
6. Fink M: Mitochondrial dysfunction as mechanism contributing
to organ dysfunction in sepsis. Crit Care Clin 2001,
17:219-237.
7. Tugtekin IF, Radermacher P, Theisen M, Matejovic M, Stehr A,
Ploner F, Matura K, Ince C, Georgieff M, Trager K: Increased ileal-
mucosal-arterial PCO
2
gap is associated with impaired villus
microcirculation in endotoxic pigs. Intensive Care Med 2001,
27:757-766.
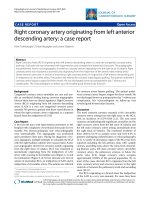
Figure 2
Behavior of intramucosal – arterial PCO
2
difference in the sham, normal and increased blood flow groupsBehavior of intramucosal – arterial PCO
2
difference in the sham, normal
and increased blood flow groups. Intramucosal acidosis developed in
the normal blood flow group and was prevented in the increased blood
flow group. Intramucosal – arterial PCO
2
difference was unchanged in
the sham group. 30', 60', 90' and 120' refer to 30, 60, 90 and 120 min,
respectively.
Key messages
• Intramucosal acidosis developed in endotoxemic sheep,
despite preserved blood flow and oxygen transport.
• Increased blood flow prevented elevation in ∆PCO
2
,
suggesting that intramucosal acidosis is mainly related
to local hypoperfusion. However, anion-gap metabolic
acidosis was higher, pointing to a possible effect on cel-
lular mechanism.
Critical Care February 2005 Vol 9 No 2 Dubin et al.
R73
8. De Backer D, Creteur J, Preiser JC, Dubois MC, Vincent JL: Micro-
vascular blood flow is altered in patients with sepsis. Am J
Respir Crit Care Med 2002, 166:98-104.
9. Spronk PE, Ince C, Gardien MJ, Mathura KR, Oudemans-van
Straaten HM, Zandstra DF: Nitroglicerin in septic shock after
intravascular volume resuscitation. Lancet 2002,
360:1395-1396.
10. Spronk PE, Zandstra DF, Ince C: Sepsis is a disease of the
microcirculation. Crit Care 2004, 8:462-468.
11. Forrest DM, Baigorri F, Chittock DR, Spinelli JJ, Russell JA: Vol-
ume expansion using pentastarch does not change gastric-
arterial CO
2
gradient or gastric intramucosal pH in patients
who have sepsis syndrome. Crit Care Med 2000,
28:2254-2258.
12. Mark P, Mohedin M: The contrasting effects of dopamine and
norepinephrine on systemic and splanchnic oxygen utilization
in hyperdynamic sepsis. JAMA 1994, 272:1354-1357.
13. Vallet B, Lund N, Curtis SE, Kelly D, Cain SM: Gut and muscle tis-
sue PO
2
in endotoxemic dogs during shock and resuscitation.
J Appl Physiol 1994, 76:793-800.
14. Lagoa CE, de Figueiredo LFP, Cruz RJ, Silva E, Rocha e Silva M:
Effects of volume resuscitation on splanchnic perfusion in
canine model of severe sepsis induced by live Escherichia coli
infusion. Crit Care 2004, 8:R221-R228.
15. Taylor DE, Gutierrez G: Tonometry. A review of clinical studies.
Crit Care Clin 1996, 12:1007-1018.
16. Douglas AR, Jones LN, Reed JW: Calculation of whole blood
CO
2
content. J Appl Physiol 1988, 65:473-477.
17. Cavaliere F, Antonelli M, Arcangeli A, Conti G, Pennisi MA, Proietti
R: Effects of acid-base abnormalities on blood capacity of
transporting CO
2
: adverse effect of metabolic acidosis. Inten-
sive Care Med 2002, 28:609-615.
18. Constable PD: Total weak acid concentration and effective dis-
sociation constant of nonvolatile buffers in human plasma. J
Appl Physiol 2001, 91:1364-1371.
19. Fink MP, Heard SO: Laboratory models of sepsis and septic
shock. J Surg Res 1990, 49:186-196.
20. Traber DL, Flynn JT, Herndon DN, Redl H, Schlag G, Traber LD:
Comparison of cardiopulmonary responses to single bolus
and continuous infusion of endotoxin in an ovine model. Circ
Shock 1989, 27:123-138.
21. Vallet B: Gut oxygenation in sepsis: still a matter of
controversy? Crit Care 2002, 6:282-283.
22. Antonsson JB, Engstrom L, Rasmussen I, Wollert S, Haglund UH:
Changes in gut intramucosal pH and gut oxygen extraction
ratio in a porcine model of peritonitis and hemorrhage. Crit
Care Med 1995, 23:1872-1881.
23. Revelly JP, Ayuse T, Brienza N, Fessler HE, Robotham JL: Endo-
toxic shock alters distribution of blood flow within the intesti-
nal wall. Crit Care Med 1996, 24:1345-1351.
24. VanderMeer TJ, Wang H, Fink MP: Endotoxemia causes ileal
mucosal acidosis in the absence of mucosal hypoxia in a nor-
modynamic porcine model of septic shock. Crit Care Med
1995, 23:1217-1226.
25. Vallet B, Teboul JL, Cain S, Curtis S: Venoarterial CO
2
difference
during regional ischemic or hypoxic hypoxia. J Appl Physiol
2000, 89:1317-1321.
26. Dubin A, Murias G, Estenssoro E, Canales H, Badie J, Pozo M, Sot-
tile JP, Baran M, Palizas F, Laporte M: Intramucosal-arterial PCO
2
gap (∆PCO
2
) fails to increase during hypoxic hypoxia. Crit Care
2002, 6:514-520.
27. Mecher C, Rackow EC, Astiz ME, Weil MH: Unaccounted for
anion in metabolic acidosis during severe sepsis in humans.
Crit Care Med 1991, 19:705-711.
28. Rackow EC, Mecher C, Astiz ME, Goldstein C, McKee D, Weil
MH: Unmeasured anion during severe sepsis with metabolic
acidosis. Circ Shock 1990, 30:107-115.
29. Gutierrez G: A mathematical model of tissue-blood carbon
dioxide exchange during hypoxia. Am J Respir Crit Care Med
2004, 169:525-533.
30. Pittner A, Nalos M, Asfar P, Yang Y, Ince C, Georgieff M, Bruckner
UB, Radermacher P, Froba G: Mechanisms of inducible nitric
oxide synthase (iNOS) inhibition-related improvement of gut
mucosal acidosis during hyperdynamic porcine endotoxemia.
Intensive Care Med 2003, 29:312-316.
31. Jakob SM: Splanchnic ischaemia. Crit Care 2002, 6:306-312.
32. Taylor DE, Piantadosi CA: Oxidative metabolism in sepsis and
sepsis syndrome. J Crit Care 1995, 10:122-135.
33. Oud L, Kruse JA: Poor in vivo reproducibility of gastric intramu-
cosal pH determined by saline-filled balloon tonometry. J Crit
Care 1996, 11:144-150.
34. Steverink PJGM, Kolkman JJ, Groeneveld ABJ, De Vries JW: Cath-
eter deadspace: a source of error during tonometry. Br J
Anaesth 1998, 80:337-341.
35. Kellum JA: Saline-induced hyperchloremic metabolic acidosis.
Crit Care Med 2002, 30:259-260.
36. Rudinsky BF, Meadow WL: Relationship between oxygen deliv-
ery and metabolic acidosis during sepsis in piglets. Crit Care
Med 1992, 20:831-839.
37. Gow KW, Phang PT, Tebbutt-Speirs SM, English JC, Allard MF,
Goddard CM, Walley KR: Effect of crystalloid administration on
oxygen extraction in endotoxemic pigs. J Appl Physiol 1998,
85:1667-1675.
38. Kellum JA, Song M, Li J: Lactic and hydrochloric acids induce
different patterns of inflammatory response in LPS-stimulated
RAW 264.7 cells. Am J Physiol Regul Integr Comp Physiol 2004,
286:R686-R692.
39. Thatte HS, Rhee JH, Zagarins SE, Treanor PR, Birjiniuk V, Crit-
tenden MD, Khuri SF: Acidosis-induced apoptosis in human
and porcine heart. Ann Thorac Surg 2004, 77:1376-1383.
40. Baylor AE 3rd, Diebel LN, Liberati DM, Dulchavsky SA, Brown WJ,
Diglio CA: The synergistic effects of hypoxia/reoxygenation or
tissue acidosis and bacteria on intestinal epithelial cell
apoptosis. J Trauma 2003, 55:241-247.
41. Kellum JA: Fluid resuscitation and hyperchloremic acidosis in
experimental sepsis: improved short-term survival and acid-
base balance with Hextend compared with saline. Crit Care
Med 2002, 30:300-305.