OBJECT-ORIENTED ANALYSIS AND DESIGNWith application 2nd phần 5 ppsx
Bạn đang xem bản rút gọn của tài liệu. Xem và tải ngay bản đầy đủ của tài liệu tại đây (327.84 KB, 54 trang )
Chapter 5: The Notation 209
of messages. Messages with the same sequence number are unordered relative to each other;
messages with lower sequence numbers are dispatched before messages with higher
sequence numbers. Duplicate sequence numbers and missing sequence numbers allow a
partial ordering of messages.
Example Figure 5-25 shows an example of an object diagram for the hydroponics gardening
system, whose context is the class category Planning, first described in Figure 5-7. The intent of
this diagram is to illustrate a scenario that
Figure 5-25
Hydroponics Gardening System Object Diagram
traces the execution of a common system function, namely, the determination of a predicted
net cost-to-harvest for a specific crop.
Carrying out this system function requires the collaboration of several different objects. We
see from this diagram that the action of the scenario begins with some
PlanAnalyst object
invoking the operation timeToHarvest() upon the class utility PlanMetrics. Note that the object C is
passed as an actual argument to this operation. Subsequently, the PlanMetrics class utility calls
status() upon a certain unnamed GardeningPlan object; our diagram includes a development note
indicating that we must check that the given plan is in fact executing. The
GardeningPlan object
in turn invokes the operation maturationTime() upon the selected GrainCrop object, asking for the
time the crop is expected to mature. After this selector operation completes, control then
returns to the PlanAnalyst object, which then calls C.yield() directly, which in turn propagates this
operation to the crop's superclass (the operation Crop::yield()). Control again returns to the
PlanAnalyst object, which completes the scenario by invoking the operation netCost() upon itself.
Chapter 5: The Notation 210
This diagram indicates a link between the PlanAnalyst and GardeningPlan objects. Although no
messages are passed, the presence of this link serves to highlight the existence of a semantic
dependency between the two objects.
Advanced Concepts
The elements we have presented thus far constitute the essential parts of the notation for
object diagrams. However, a number of particularly knotty development issues require that
we extend this basic notation slightly. As we warned in our discussion on class diagrams, we
must again emphasize that
Figure 5-26
Roles
these advanced features should be applied only as necessary to capture the intended
semantics of a scenario.
Roles, Keys, and Constraints In an earlier section, we noted that associations in a class
diagram may be adorned with a role denoting the purpose or capacity wherein one class
associates with another. For certain object diagrams, it is useful to restate this role on the
corresponding link between two objects. Often, this adornment helps to explain why one
object is operating upon another.
Figure 5-26 provides an example of this advanced feature. Here we see that some PlanAnalyst
object inserts a specific crop into an anonymous
CropEncyclopedia object, and does so while
acting in the role of Contributor.
Using the same notation we introduced in class diagrams, we may indicates the keys or
constraints associated with an object or a link.
Data Flow As we described in Chapter 3, data may flow with or against the direction of a
message. Occasionally, explicitly showing the direction of a data flow helps to explain the
semantics of a particular scenario. Borrowing from the notation for structured design, we use
the icon shown in Figure 5-26 to show that the value
succeeded returns upon completion of the
message insert.
Chapter 5: The Notation 211
We may use either an object or a value in a data flow.
Visibility In certain complicated scenarios, it is useful to keep track of exactly how one object
has visibility to another. Although associations in class diagrams denote the semantic
dependencies that may exist among the classes of two objects, they do not dictate exactly how
those instances can see one another. For this reason, we may adorn the links in our object
diagrams with icons that represent the visibility of one object to another. This adornment is
also important for tools that support forward code generation and reverse engineering.
Figure 5-27 is a refinement of Figure 5-25, and includes some of these adornments, which are
similar to the icons we used to represent physical
Figure 5-27
Visibility
containment in class diagrams, but with the addition of a letter designating the kind of
visibility. For example, the G adornment shown on the link from the
PlanAnalyst object to the
PlanMetrics class utility denotes that the class utility is global to the declaration of the analyst
object. The object C is visible to the PlanAnalyst object and the GardeningPlan object through two
different paths. From the perspective of the
PlanAnalyst object, the GrainCrop object C is visible as
a parameter to some analyst operation, (the P adornment); from the perspective of the
GardeningPlan object, the object C is visible as a field (that is, as a part of the plan aggregate
object).
To generalize, the following adornments may be used to indicate visibility:
• G The supplier object is global to the client.
Chapter 5: The Notation 212
• P The supplier object is a parameter to some operation of
the client.
• F The supplier object is a part of the client object.
• L The supplier object is a locally declared object in the scope of
the object diagram.
Consistent with the adornments for physical containment in class diagrams, these
adornments may be written as an open box with a letter (representing that the object's
identity is shared) or as a filled box wit that the object's identity is not structurally shared).
The absence of a visibility adornment means that the precise visibility between the two
objects is left unspecified. In practice, it is common to adorn
Figure 5-28
Active Objects and Synchronization
only a few key links in an object diagram with these visibility symbols. The most common use
of these symbols is to represent whole/part (aggregation) relationships between two objects;
the second most common use is to represent transitory objects that are passed into the object
diagram's scenario as parameters.
Active Objects and Synchronization As noted in Chapter 3, certain objects may be active,
meaning that they embody their own thread of control. Other objects may have only purely
sequential semantics, while yet others might not be active, yet still guarantee their semantics
in the presence of multiple threads of control.
In each of these circumstances, we must address two issues: how to signify the active objects
that denote roots of control in a scenario, and how to represent different forms of
synchronization among such objects.
Chapter 5: The Notation 213
In our earlier discussion on the advanced features of class specifications, we noted that classes
may have one of four concurrency semantics: sequential, guarded, synchronous, and active.
By implication, all instances of a class take on the concurrency semantics of their class; all
objects are sequential unless otherwise stated. We may explicitly reveal the concurrency
semantics of an object in an object diagram by adorning its object icon with the names
sequential, guarded, synchronous, or active, placed in the lower left of the icon. For example, in
Figure 5-28, we see that H, C, and the anonymous instance of the EnviommentalController class are
all active objects and thus embody their own thread of control. Unadorned objects (such as L)
are assumed to be sequential.
The message synchronization symbol we introduced earlier (the simple directed line)
represents simple sequential message passing. In the presence of multiple threads of control,
however, we must specify other forms of synchronization.
Figure 5-29
Time Budgets
Albeit slightly contrived, the example in Figure 5-28 illustrates the different kinds of message
synchronization that: may appear in an object diagram. The message turnOn() is an example of
simple message passing, and is represented with the directed line. The semantics of simple
message passing are guaranteed only in the presence of a single thread of control, in contrast,
all the other messages involve some form of process synchronization; all such advanced
forms of synchronization apply only to suppliers that are non-sequential.
For example, the message
startUp() is synchronous, meaning that the client will wait forever
until the supplier accepts the message. Synchronous message passing is equivalent to Ada's
rendezvous mechanism among tasks. The
isReady() message denotes balking message passing,
meaning that the client will abandon the message if the supplier cannot immediately service
the message. The
restart() message denotes a timeout synchronization: the client will abandon
the message if the supplier cannot service the message within a specified amount of time.
In each of these last three cases, the client must wait for the supplier to completely process the
message (or abandon the message) before control can resume. In the case of the message
failure(), the semantics are different. This is an example of an asynchronous message, which
Chapter 5: The Notation 214
means that the client sends the event to the supplier for processing, the supplier queues the
message, and the client then proceeds without waiting for the supplier. Asynchronous
message passing is akin to interrupt handling.
Time Budgets For certain time-critical applications, it is important to trace scenarios in terms
of exact time relative to the start of the scenario. To designate relative time, we use sequence
numbers that denote time (in seconds), prefixed by the plus symbol. For example, in Figure 5-
29, we see that the message startUp() is first invoked 5 seconds after the start of the scenario,
followed by the message ready() 6.5 seconds after the start of the scenario, and then followed
by the message
turnOn() after 7 seconds.
Specifications
As for class diagrams, each entity in an object diagram may have a specification, which
provides us complete definition. Because the specifications for objects and object relationships
add no information beyond what we have already described in this section, we need not
discuss their textual specification here.
On the other hand, the specifications for object diagrams as a whole do have one significant
piece of nongraphical information that we must consider. As we described at the beginning of
this section, every object diagram must designate a context. We do so in the diagram's
specification, as follows:
Context: global | category | class | operation
In particular, the scope of an object diagram may be global, or in the context of a named class
category, class, or operation (including both methods and free subprograms).
5.5 Interaction Diagrams
Essentials: Objects and Interactions
An interaction diagram is used to trace the execution of a scenario in the same context as an
object diagram.
56
Indeed, to a large degree, an interaction diagram is simply another way of
representing an object diagram. For example, in Figure 5-30, we provide an interaction
diagram that duplicates most of the semantics of the object diagram shown in Figure 5-25.
The advantage of using an interaction diagram is that it is easier to read the passing of
messages in relative order. The advantage of using an object diagram is that it scales well to
many objects with complex invocations, and permits the inclusion of other information, such
as links, attribute values, roles, data flow, and visibility. Because each diagram has
compelling benefit we include both of them in the method.
57
56
These diagrams are generalizations of Rumbaugh's event trace diagrams [14] and Jacobson's interaction
diagrams [15].
57
Object diagrams and interaction diagrams are sufficiently close in terms of their semantics that it is possible
for tools to generate one diagram from the other, with minimal loss of information.
Chapter 5: The Notation 215
Interaction diagrams introduce no new concepts or icons; rather, they take most of the
essential elements of object diagrams and restructure them. As Figure 5-30 indicates, an
interaction diagram appears in tabular form. The entities of interest (which are the same as
for object diagrams) are written horizontally across the top of the diagram. A dashed vertical
line is drawn below each object. Messages (which may denote events or the invocation of
operations) are shown horizontally using the same syntax and synchronization symbols as for
object diagrams. The endpoints of the message icons connect
Figure 5-30
Hydroponies Gardening System Interaction Diagram
with the vertical lines that connect with the entities at the top of the diagram and are drawn
from the client to the supplier. Ordering is indicated by vertical position, with the first
message shown at the top of the diagram, and the last message shown at the bottom. As a
result, it is unnecessary to use sequence numbers.
Interaction diagrams are often better than object diagrams for capturing the semantics of
scenarios early in the development life cycle, before the protocols of individual classes have
been identified. As we explain in the next chapter, early interaction diagrams tend to focus on
events as opposed to operations, because events he1p to define the boundaries of a system
under development. As development proceeds and the system's class structure is refined, the
emphasis tends to migrate to object diagrams, whose semantics are more expressive.
Advanced Concepts
Interaction diagrams are conceptually very simple; however, there are two straightforward
elements that can be added to make them more expressive in the presence of certain
complicated patterns of interaction.
Scripts For complex scenarios that involve conditions or iterations, interaction diagrams can
be enhanced by the use of scripts. As we see in the example in Figure 5-31, a script may be
written to the left of an interaction diagram, with the steps of the script aligning with the
Chapter 5: The Notation 216
message invocations. Scripts may be written using free form or structured English text, or
using the syntax of the chosen implementation language.
Focus of Control Neither simple object diagrams nor interaction diagrams indicate the focus
of control as messages are passed. For example, if object A sends messages X and Y to other
objects, it is not clear if
X and Y are independent messages from A or if they have been invoked
as part of the same
Figure 5-31
Scripts and Focus of Control
enclosing message Z. As we show in Figure 5-31, we may adorn the vertical lines descending
from each object in an interaction diagram with a box representing the relative time that the
flow of control is focused in that object. For example, here we see that the anonymous
instance of the GardeningPlan is the ultimate focus of control, and its behavior of carrying out a
climatic plan invokes other methods, which in turn call other methods that eventually return
control back to the
GardeningPlan object.
5.6 Module Diagrams
Essentials: Modules and Their Dependencies
A module diagram is used to show the allocation of classes and objects to modules in the
physical design of a system. A single module diagram represents a view of the module
structure of a system. During development, we use module diagrams to indicate the physical
layering and partitioning of our architecture.
Certain languages, most notably Smalltalk, have no concept of a physical architecture formed
of modules; in such cases, module diagrams are unnecessary.
The two essential elements of a module diagram are modules and their dependencies.
Chapter 5: The Notation 217
Modules Figure 5-32 shows the icons we use to represent various kinds of modules. The first
three icons denote files, distinguished by their function. The main program icon denotes a file
that contains the root: of a program. In C++ for example, this would likely be some cpp file
that contains the definition of the privileged nonmember function called main. Typically,
there is exactly one such module per program. The specification icon and the body icon
denote files that contain the declaration and definition of entities, respectively. In C++,
Figure 5-32
Module and Subsystem lcons
for example, specification modules denote h files, and body modules denote cpp files.
We will explain the meaning of the subsystem icon in a later section.
A name is required for each module; this name typically denotes the simple name of the
corresponding physical file in the development directory. We usually write such names
without their suffixes, which would be redundant when associated with a particular module
icon. If the name is particularly long, it can either be elided or the icon magnified. Every full
file name must be unique according to its enclosing subsystem. Depending upon the needs of
our particular development environments, we may impose other constraints upon names,
such as requiring distinctive prefixes or requiring unique names across the entire system.
Each module encompasses the declaration or definition of classes, objects, and other language
details. Conceptually, we can zoom in to a module to see the physical contents of its
corresponding file.
Dependencies The only relationship we may have between two modules is a compilation
dependency, represented by a directed line pointing to the module upon which the
dependency exists. In C++ for example, we indicate a compilation dependency by #include
directives. Similarly in Ada, compilation dependencies are indicated by
with clauses. In
general, there may be no cycles within a set of compilation dependencies. Performing a
topological sort upon all the dependencies of a system's module structure is sufficient to
calculate a partial ordering of compilation.
Example In Figure 5-33, we provide an example of this notation, drawn from the physical
architecture of the hydroponics gardening system. Here we see six modules. Two of them,
climatedefs and cropdefs, are only specifications, and serve to provide corm-non types and
Chapter 5: The Notation 218
constants. The remaining four modules are shown with their specification and bodies
grouped together: this is a typical style of drawing module diagrams, since the specification
and body of a module are so intimately related. Because we have overlaid the two parts, the
dependency of the body upon the corresponding specification is hidden, although it in fact
exists. Similarly, the name of the body is hidden, which is not a problem because our
convention is to name specifications and bodies the same except for a distinguishing suffix
(such as .h and .cpp, respectively).
Figure 5-33
Hydroponics Gardening System Module Diagram
The dependencies in this diagram suggest a partial ordering of compilation. For example, the
body of
climate depends upon the specification of heater, which in turn depends upon the
specification of
climatedefs.
Essentials: Subsystems
As explained in Chapter 2, a large system may be decomposed into many hundreds, if not a
few thousand, modules. Trying to comprehend the physical architecture of such a system is
impossible without further chunking. In practice, developers tend to use informal
conventions to collect related modules in directory structures. For similar reasons, we
introduce the notion of a subsystem for module diagrams, which parallels the role played by
the class category for class diagrams. Specifically, subsystems represent clusters of logically
related modules.
Chapter 5: The Notation 219
Subsystems Subsystems serve to partition the physical model of a system. A subsystem is an
aggregate containing other modules and other subsystems. Each module in the system must
live in a single subsystem or at the top level of the system.
Figure 5-32 shows the icon we use to represent a subsystem. As for a module, a name is
required for each subsystem. The rules for naming subsystems follow the rules for naming
individual modules, although full subsystem names do not typically include distinctive
suffixes.
Some of the modules enclosed by a subsystem may be public, meaning that they are exported
from the subsystem and hence usable outside the
Figure 5-34
Hydroponics Gardening System Top-Level Module Diagram
subsystem. Other modules may be part of the subsystem's implementation, meaning that
they are not intended to be used by any other module outside of the subsystem. By
convention, every module in a subsystem is considered public, unless explicitly defined
otherwise. Restricting access to implementation modules is achieved by using the same
advanced concepts as for restricting access in class categories.
A subsystem can have dependencies upon other subsystems or modules, and a module can
have dependencies upon a subsystem. For consistency, we apply the same dependency icon
as described earlier.
Chapter 5: The Notation 220
In practice, a large system has one top-level module diagram, consisting of the subsystems at
the highest level of abstraction. Through this diagram a developer comes to understand the
general physical architecture of a system.
Example Figure 5-34 shows an example of a top-level module diagram for the hydroponics
gardening system. If we zoom into any of the seven subsystems shown here, we will find all
of their corresponding modules.
Notice how this physical architecture maps to the logical architecture of the hydroponics
gardening system shown in Figure 5-7. These structures are largely isomorphic, although
there are small differences. In particular, we have made the decision to separate the low-level
device classes from the Climate and Nutrients class categories and place their corresponding
modules into one subsystem called Devices. We have also split the Greenhouse class category
into the two subsystems called ClimateControl and Nutritionist.
Advanced Concepts
Language Tailoring Certain languages, most notably Ada, define other kinds of modules
than the simple ones provided for by Figure 5-32. In particular, Ada defines generic packages,
generic subprograms, and tasks as separate Compilation units. It is therefore reasonable to
augment the essential icons of module diagrams to include icons that represent language-
specific kinds of modules.
Segmentation Especially for platforms that have severely constrained memory models, the
decision to generate code in different segments, or even to produce a scheme for overlays, is
an important one. Module diagrams can be extended to he1p visualize this segmentation by
including language-specific adornments to each module in a module diagram that denote its
corresponding code or data segment.
Specifications
As with class and object diagrams, each entity in a module diagram may have a specification,
which provides its complete definition. Because the specifications for modules and their
dependencies add no information beyond what we have already described in this section, we
need not discuss their textual specification here.
Given some degree of integration between tools that support: this notation and tools for
programming environments, it is reasonable to use module diagrams as a means of
visualizing the modules managed by the programming environment. Zooming into a specific
module or subsystem in a module diagram is therefore equivalent to navigating to the
corresponding physical file or directory, and vice versa.
Chapter 5: The Notation 221
5.7 Process Diagrams
Essentials: Processors, Devices, and Connections
A process diagram is used to show the allocation of processes to processors in the physical
design of a system. A single process diagram represents a view into the process structure of a
system. During development, we use process diagrams to indicate the physical collection of
processors and devices that serve as the platform for execution of our system.
The three essential elements of a process diagram are processors, devices, and their
connections.
Processors Figure 5-35 shows the icon we use to represent a processor. A processor is a
piece of hardware capable of executing programs. A name is
Figure 5-35
Processor and Device icons
required for each processor; there are no particular constraints upon processor names,
because they denote hardware, not software, entities.
We may adorn a processor icon with a list of processes. A process in this list denotes the root
of a main program (from a module diagram) or the name of an active object (from an object
diagram).
Devices Figure 5-35 shows the icon we use to represent a device. A device is a piece of
hardware incapable of executing programs (as least as far as our logical model is concerned).
As for processors, a name is required for each device. There are no particular constraints
upon device names, and in fact, their names may be quite generic, such as
modem or terminal.
Connections Processors and devices must communicate with one another. Using an
undirected line, we may indicate the connection between a device and a processor, a
processor and a processor, or a device and a device. A connection usually represents some
direct hardware coupling, such as an RS232 cable, an Ethernet connection, or perhaps even a
path to shared memory. A connection may also represent more indirect couplings, such as
Chapter 5: The Notation 222
satellite-to-ground communications. Connections are usually considered to be bi-directional,
although if a particular connection is unidirectional, an arrow may be added to show the
direction. Each connection may include an optional label that names the connection.
Example In Figure 5-36, we provide an example of this notation, drawn from the physical
architecture of the hydroponics gardening system. Here we see that our system architects
have decided to decompose our system into a network of four computers, one assigned to a
gardener workstation, and the others allocated to individual greenhouses. Processes running
on the greenhouse computers cannot communicate directly with one another, although they
can communicate with processes running on the gardener workstation. For simplicity, we
have chosen not to show any devices in this diagram, although we expect there to be quite a
few actuators and sensors in the system.
Figure 5-36
Hydroponics Gardening System Process Diagram
Advanced Concepts
Tailoring Figure 5-35 shows the standard icons we use to represent processors and devices,
but it is reasonable and in fact desirable to allow alternate representations. For example, we
might define specific icons to graphically represent an embedded microcomputer (a
processor), a disk, a terminal, and an A/D converter (all devices), and then use these icons in
a process diagram instead of the standard icons. By doing so, we offer a visualization of the
physical platform of our implementation that speaks directly to our hardware and systems
architects, as well as to the end users of the system, who are probably not experts in software
development.
Chapter 5: The Notation 223
Nesting The hardware configuration of a system is sometimes very complex, and may
involve complex hierarchies of processors and devices. In some circumstances, therefore, it is
useful to be able to represent groups of processors, devices, and connections, much as class
categories represent logical groupings of classes and objects. We may indicate such hardware
groups with a named icon shaped as a rounded rectangle with dashed lines. Each such icon
denotes a distinct group of processors, devices, and connections, and so zooming into a group
reveals these nested entities. We may define connections between groups, as well as among
processors, devices, and groups.
Process Scheduling We must have some policy for how to schedule the execution of
processes within a processor. There are basically five general approaches to scheduling, and
we may document which of these is used by adorning each processor icon with one of the
names:
• Preemptive Higher-priority processes that are ready to execute may preempt
lower-priority ones that are currently executing; typically,
processes with equal priority are given a time slice in which to
execute, so that computational resources are fairly distributed.
• Nonpreemptive The current process continues to execute until it relinquishes
control.
• Cyclic Control passes from one process to another, and each process is
given a fixed amount of processing time, usually called a frame,
processes may be allocated time in frames or subframes.
• Executive Some algorithm controls process scheduling.
• Manual Processes are scheduled by a user outside of the system.
To further explain the scheduling used by a specific processor, it is sometimes useful to
include an object diagram or an interaction diagram, particularly if executive scheduling is
used.
Specifications
As with all other diagrams, each processor, device, and connection may have a specification,
which provides its complete definition. Because the specifications for these entities add no
information beyond what we have already described in this section, we need not discuss their
textual specification here.
Chapter 5: The Notation 224
5.8 Applying the Notation
The Products of Object-Oriented Development
Typically, the analysis of a system will include sets of object diagrams (to express the
behavior of the system through scenarios), class diagrams (to express the roles and
responsibilities of agents that provide the system's behavior), and state transition diagrams
(to show the event-ordered behavior of these agents). Similarly, the design of a system,
encompassing its architecture and implementation, will include sets of class diagrams, object
diagrams, module diagrams, and process diagrams, as well as their corresponding dynamic
views.
End-to-end connectivity exists among these diagrams, permitting us to trace requirements
from implementation back to specification. Starting with a process diagram, a processor may
designate a main program, which is defined in some module diagram. This module diagram
may encompass the definition of a collection of classes and objects, whose definitions we will
find in the appropriate class or object diagrams. Finally, the definitions of individual classes
point to our requirements, because these classes in general directly reflect the vocabulary of
the problem space.
The notation described in this chapter can be used manually, although for larger applications
it cries out for automated tool support. Tools can provide consistency checking, constraint
checking, completeness checking, and analysis, and they can he1p a developer browse
through the products of analysis and design in unconstrained ways. For example, while
looking at a module diagram, a developer might want to study a particular mechanism; he or
she can use a tool to locate all the classes allocated to a particular module. While looking at an
object diagram describing a scenario that uses one of these classes, the developer might want
to see its place in the inheritance lattice. Lastly, if this scenario involved an active object, the
developer might use a tool to find the processor to which this thread of control is allocated,
and then view an animation of its class's state machine on that processor. Using tools in this
manner frees developers from the tedium of keeping all the details of the analysis and design
consistent, allowing them to focus upon the creative aspects of the development process.
Scaling Up and Scaling Down
We have found this notation and its variants applicable both to small systems consisting of
just a dozen or so classes, to ones consisting of a several thousand classes. As we will see in
the next two chapters, this notation is particularly applicable to an incremental, iterative
approach to development. One does not create a diagram and then walk away from it,
treating it as some sacred, immutable artifact. Rather, these diagrams evolve during the
design process as new design decisions are made and more detail is established.
We have also found this notation to be largely language-independent. It is applicable to any-
of a wide spectrum of object-oriented programming languages.
Chapter 5: The Notation 225
This chapter has described the essential products of object-oriented development, including
their syntax and semantics. The next two chapters will describe the process that leads us to
these products. The remaining five chapters demonstrate the practical application of this
notation and process to a variety of problems.
Summary
• Designing is not the act of drawing a diagram; a diagram simply captures a design.
• In the design of a complex system, it is important to view the design from multiple
perspectives: namely, its logical and physical structure, and its static and dynamic
semantics.
• The notation for object-oriented development includes four basic diagrams (class
diagrams, object diagrams, module diagrams, and process diagrams) and two
supplementary diagrams (state transition diagrams and interaction diagrams).
• A class diagram is used to show the existence of classes and their relationships in the
logical design of a system. A single class diagram represents a view of the class structure
of a system.
• An object diagram is used to show the existence of objects and their relationships in the
logical design of a system. A single object diagram is typically used to represent a
scenario.
• A module diagram is used to show the allocation of classes and objects to modules in the
physical design of a system. A single module diagram represents a view of the module
architecture of a system.
• A process diagram is used to show the allocation of processes to processors in the
physical design of a system. A single process diagram represents a view of the process
architecture of a system.
• A state transition diagram is used to show the state space of an instance of a given class,
the events that cause a transition from one state to another, and the actions that result
from a state change.
• An interaction diagram is used to trace the execution of a scenario in the same context as
an object diagram.
Further Readings
Since the publication of the first edition of this book, I have unilaterally tried to incorporate
the best notational elements from many other methodologists, especially Rumbaugh and
Jacobson, into the Booch method, and have cast away or simplified elements of the
Chapter 5: The Notation 226
original Booch notation that proved to be clumsy, inconsistent, or of marginal utility,
while at the same time striving to maintain a conceptual integrity in the notation. This
chapter is the culmination of this unification effort.
A tremendous amount has been written about notations for software analysis and design; the
book by Martin and McClure [H 1988] is a general reference to many of the more
traditional approaches. Graham [F 1991] surveys a number of notations specific to object-
oriented methods.
An early form of the notation described in this chapter was first documented by Booch [F
19811. This notation later evolved to incorporate the expressive power of semantic nets
(Stillings et al. [A 1987] and Barr and Feigenbaum [j 1981]), entity-relationship diagrams
(Chen [E 1976]), entity models (Ross [F 1987]), Petri nets (Peterson [J 1977], Sahraoui [F
1987], and Bruon and Balsamo [F 1986]), associations (Rumbaugh [F 1991]) and statecharts
(Harel [F 1987]). Rumbaugh's work is particularly interesting, for as he observes, our
methods are more similar than they are different.
The icons representing objects and packages were inspired by the iAPX 432 [D 1981]. The
notation for object diagrams derives from Seidewitz [F 1985]. The notation for concurrency
semantics is adapted from the work of Buhr [F 1988, 1989].
Chang [G 1990] provides a good survey on the more general topic of visual languages.
CHAPTER 6
227
The Process
The amateur software engineer is always in search of magic, some sensational method or
tool whose application promises to render software development trivial. it is the mark of the
professional software engineer to know that no such panacea exists. Amateurs often want to
follow cookbook steps; professionals know that right approaches to development usually lead
to inept design products, born of a progression of lies, and behind which developers can
shield themselves from accepting responsibility for earlier misguided decisions. The amateur
software engineer either ignores documentation all together, or follows a process that is
documentation-driven, worrying more about how these paper products look to the customer
than about the substance they contain. The professional acknowledges the importance of
creating certain documents, but never does so at the expense of making sensible
architectural innovations.
The process of object-oriented analysis and design cannot be described in a cookbook, yet it
is sufficiently well-defined as to offer a predictable and repeatable process for the mature
software development organization. In this chapter, we examine this incremental, iterative
process in detail, and consider the purpose, products, activities, and measures of its various
phases.
6.1 First Principles
Traits of Successful Projects
A successful software project is one whose deliverables -satisfy and possibly exceed the
customer's expectations, was developed in a timely and economical fashion, and is resilient to
change and adaptation. By this measure, we have observed two traits that are common to
virtually all of the successful object-oriented systems we have encountered, and noticeably
absent from the ones that we count as failures:
• The existence of a Strong architectural vision
• The application of a well-managed iterative and incremental development life cycle
Chapter 6: The Proccess 228
Architectural Vision A system that has a sound architecture is one that has conceptual
integrity and, as Brooks firmly states, "conceptual integrity is the most important
consideration in system design" [1]. As we described in Chapters 1 and 5, the architecture of
an object-oriented software system encompasses its class and object structure, organized in
terms of distinct layers and partitions. In some ways, the architecture of a system is largely
irrelevant to its end users. However, as Stroustrup points out, having a "clean internal
structure" is essential to constructing a system that is understandable, can be extended and
reorganized, and is maintainable and testable [2]. Furthermore, it is only through having a
clear sense of a system's architecture that it becomes possible to discover common
abstractions and mechanisms. Exploiting this commonality ultimately leads to the
construction of systems that are simpler, and therefore smaller and more reliable.
Just as there is no "right” way to classify abstractions, there is no "right” way to craft the
architecture of a given system. For any application domain, there are certainly some
profoundly stupid ways, and occasionally some very elegant ways, to design the architecture
of a, solution. How then do we distinguish a good architecture from a bad one?
Fundamentally, good architectures tend to be object-oriented. This is not to say that all object-
oriented architectures are good, or that only object-oriented architectures are good. However,
as we discussed in Chapters 1 and 2, it can be shown that the application of the principles that
underlie object-oriented decomposition tend to yield architectures that exhibit the desirable
properties of organized complexity.
Good software architectures tend to have several attributes in common:
• They are constructed in well-defined layers of abstraction, each layer representing a
coherent abstraction, provided through a well-defined and controlled interface, and built
upon equally well-defined and controlled facilities at lower levels of abstraction.
• There is a clear separation of concerns between the interface and implementation of each
layer, making it possible to change the implementation of a layer without violating the
assumptions made by its clients.
• The architecture is simple: common behavior is achieved through common abstractions
and common mechanisms.
We make a distinction between strategic and tactical architectural decisions. A strategic
decision is one that has sweeping architectural implications, and so involves the organization
of the architecture’s higher-level structures. Mechanisms for error detection and recovery,
user interface paradigms, policies for memory management and object persistence, and
approaches to process synchronization in real-time applications all represent strategic
architectural decisions. In contrast, a tactical decision has only local architectural implications,
and so usually only involves the details of an abstraction's interface and implementation. The
protocol of a class, the signature of a method, and the choice of a particular algorithm to
implement a method all represent tactical decisions.
Chapter 6: The Proccess 229
A fundamental part of holding on to a strong architectural vision is maintaining a balance
between these strategic and tactical decisions. In the absence of good strategic decisions, even
the most cunningly designed class will never fit in quite right. A collection of the most
profoundly engineered strategic decisions will be ruined by not paying careful attention to
the design of individual classes. In either case, neglecting an architectural vision leaves us
with the software equivalent of sludge.
Iterative and Incremental Life Cycle Consider two extremes: an organization that has no
well-defined development life cycle, and one that has very rigid and strictly-enforced policies
that dictate every aspect of development. In the former case, we have anarchy: through the
hard work and individual contributions of a few developers, the team may eventually
produce something of value, but we can never reliably predict anything: not progress to date,
not work remaining, and certainly not quality. The team is likely to be very inefficient and, in
the extreme, may never reach closure and so never deliver a software product that satisfies its
customer's current or future expectations. This is an example of a project in free fall.
58
in the
second case, we have a dictatorship, in which creativity is punished, experimentation that
could yic1d a more elegant architecture is discouraged, and the customer's real expectations
are never correctly communicated to the lowly developer who is hidden behind a veritable
paper wall erected by the organization’s bureaucracy.
The successful object-oriented projects we have encountered follow neither anarchic nor
draconian development life cycles. Rather, we find that the process that leads to the
successful construction of object-oriented architectures tends to be both iterative and
incremental. Such a process is iterative in the sense that it involves the successive refinement
of an object-oriented architecture, from which we apply the experience and results of each
release to the next iteration of analysis and design. The process is incremental in the sense
that each pass through an analysis/design/evolution cycle leads us to gradually refine our
strategic and tactical decisions, ultimately converging upon a solution that meets the end
user's real (and usually unstated) requirements, and yet is simple, reliable, and adaptable.
An iterative and incremental development life cycle is the antithesis of the traditional
waterfall life cycle, and so represents neither a strictly top-down nor a bottom-up process. It
is reassuring to note that there are precedents in the hardware and software communities for
this style of development [3, 4]. For example, assume that: we are faced with the problem of
staffing an organization to design and implement a fairly complex multiboard device or some
custom VLSI chip. We might use traditional horizontal staffing, in which we have a waterfall
progression of products, with systems architects feeding logic designers feeding circuit
designers. This is an example of top-down design, and requires designers who are "tall,
skinny men" because of the narrow yet deep skills that each must possess [5]. Alternately, we
might use vertical staffing, in which we have good all-around designers who take slices of the
entire project, from architectural conception through circuit design. This style of development
58
There is an outside chance that a project in free fall will eventually land intact, but you would not want to bet
your company's future on it.
Chapter 6: The Proccess 230
is much more iterative and incremental, and the skills that these designers must have leads us
to call them "short, fat men" because of the broad architectural vision that each must possess.
Our experience indicates that object-oriented development is neither strictly top-down, nor
strictly bottom-up. Instead, as Druke suggests, well-structured complex systems are best
created through the use of "round-trip gestalt design.' This style of design emphasizes the
incremental and iterative development of a system through the refinement of different yet
consistent logical and physical views of the system as a whole. Round-trip gestalt design is
the foundation of the process of object-oriented design.
For a few limited application domains, the problem being solved may already be well-
defined, with many different implementations currently fielded. Here, it is possible to almost
completely codify the development process: the designers of a new system in such a domain
already understand what the important abstractions are; they already know what
mechanisms ought to be employed, and they generally know the range of behavior that is
expected of such a system. Creativity is still important in such a process, but here the problem
is sufficiently constrained as to already address most of the system's strategic decisions. In
such circumstances, it is possible to achieve radically high rates of productivity, because most
of the development risk has been eliminated [6]. The more we know about the problem to be
solved, the easier it is to solve.
Most industrial-strength software problems are not like this: most involve the balancing of a
unique set of functional and performance requirements, and this task demands the full
creative energies of the development team.
Furthermore, any human activity that requires creativity- and innovation demands an
iterative and incremental process that relies upon the experience, team member.
59
It is
therefore impossible to provide any cookbook recipes.
Towards a Rational Design Process
Clearly, however, we desire to be prescriptive; otherwise, we will never secure development
process for any organization. It is for this reason that we spoke earlier of having a well-
managed incremental and iterative life cycle: well-managed in the sense that the process can
be controlled and measured, yet not so rigid that it fails to provide sufficient degrees of
freedom to encourage creativity and innovation.
Having a prescriptive process is fundamental to the maturity of a software organization. As
described by Humphrey, there are five distinct levels of process maturity [7]:
59
The experiments by Curtis and his colleagues reinforce these observations. Curtis Studied the work of
professional software developers by videotaping them in action and then analyzing the different activities they
undertook (analysis, design, implementation, etc.) and when they applied them. From these studies, he
concluded that "software design appears to be a collection of interleaved, iterative, loosely ordered processes
under opportunistic control Top-down balanced development appears to be a special case occurring when a
relevant design schema is available or the problem is small Good designers work at multiple levels of
abstraction and detail simultaneously" [8].
Chapter 6: The Proccess 231
• Initial The development process is ad hoc and often chaotic. Organizations can
progress by introducing basic project controls.
• Repeatable The organization has reasonable control over its plans and commitments.
Organizations can progress by institutionalizing a well-defined process.
• Defined The development process is reasonably well-defined, understood, and
practiced; it serves as a stable foundation for calibrating the team and
predicting progress. Organizations can progress their development
practices.
• Managed The organization has quantitative measures of its process. Organizations
can progress by lowering the cost of gathering this data, and instituting
practices that permit this data to influence the process.
• Optimizing The organization has in place a well-tuned process that consistently yields
products of high quality in a predictable, timely, and cost-effective
manner.
Unfortunately, as Parnas and Clements observe, "we will never find a process that allows us
to design software in a perfectly rational way," because of the need for creativity and
innovation during the development process. However, as they go on to say, "the good news is
that we can fake it [Becausel designers need guidance, we will come closer to a rational
process if we try to follow the process rather than proceed on an ad hoc basis. When an
organization undertakes many software projects, there are advantages to having a standard
procedure. If we agree on an ideal process, it becomes much easier to measure the progress
that the project is making" [9].
As we move our development organizations to higher levels of maturity, how then do we
reconcile the need for creativity and innovation with the requirement for more controlled
management practices? The answer appears to lie in distinguishing the micro and macro
elements of the development process. The micro process is more closely related to Boehm's
spiral model of development, and serves as the framework for an iterative and incremental
approach to development [10]. The macro process is more closely related to the traditional
waterfall life cycle, and serves as the controlling framework for the micro process. By
reconciling these two disparate processes, we end up 'faking" a fully rational development
process, and so have a foundation for the defined level of software process maturity.
We must emphasize that every project is unique, and hence developers must strike a balance
between the informality of the micro process and the formality of the macro process. For
exploratory applications, developed by a tightly knit team of highly experienced developers,
too much formality would stifle innovation; for very complex projects, developed by a large
team of developers who are likely to be distributed geographically as well as in time, too little
formality will lead to chaos.
Chapter 6: The Proccess 232
The remainder of this chapter provides an overview and then a detailed description of the
purpose, products, activities, and measures that make up the micro and macro development
processes. In the next chapter, we examine the practical implications of this process, primarily
from the perspective of managers who must supervise object-oriented projects.
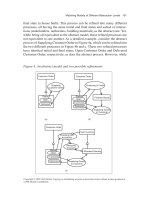
6.2 The Micro Development Process
Overview
The micro process of object-oriented development is largely driven by the stream of scenarios
and architectural products that emerge from and that are successively refined by the macro
process. To a large extent, the micro process represents the daily activities of the individual
developer or a small team of developers.
The micro process applies equally to the software engineer and the software architect. From
the perspective of the engineer, the micro process offers guidance in making the myriad
tactical decisions that are part of the daily
Figure 6-1
The Micro Development Process
fabrication and adaptation of the architecture; from the perspective of the architect, the micro
process offers a framework for evolving the architecture and exploring alternative designs.
Chapter 6: The Proccess 233
In the micro process, the traditional phases of analysis and design are intentionally blurred,
and the process is under opportunistic control. As Stroustrup observes, "There are no
'cookbook' methods that can replace intelligence, experience, and good taste in design and
programming The different phases of a software project, such as design, programming, and
testing, cannot be strictly separated [11].
As Figure 6-1 illustrates, the micro process tends to track the following activities:
• Identify the classes and objects at a given level of abstraction.
• Identify the semantics of these classes and objects.
• Identify the relationships among these classes and objects.
• Specify the interface and then the implementation of these classes and objects.
Let's examine each of these activities in detail.
Identifying Classes and Objects
Purpose The purpose of identifying classes and objects is to establish the boundaries of the
problem at hand. Additionally, this activity is the first step in devising an object-oriented
decomposition of the system under development.
As part of analysis, we apply this step to discover those abstractions that form the vocabulary
of the problem domain, and by so doing, we begin to constrain our problem by deciding what
is and what is not of interest. As part of design, we apply this step to invent new abstractions
that form elements of the solution. As implementation proeeds, we apply this step in order to
invent lower-level abstractions that we can use to construct higher-level ones, and to discover
commonality among existing abstractions, which we can then exploit in order to simplify the
system's architecture.
Products The central product of this step is a data dictionary that is updated as development
proceeds. Initially, it may be sufficient to accumulate a "list of things" consisting of all
significant classes and objects, using meaningful names that imply their semantics [121. As
development proceeds, and especially as the dictionary grows, it becomes necessary to
formalize the repository, perhaps by using a simple ad hoc database to manage the list, or a
more focused tool that supports the method directly.
60
In its more formal variations, a data
dictionary serves as an index into all the other products of the development process,
including the various diagrams and specifications of the object-oriented development
notation.
The data dictionary thus serves as a central repository for the abstractions relevant to the
system. Initially, it: is permissible to keep the dictionary open-ended: some things in this
repository might turn out to be classes, some objects, and others simply attributes of or
60
Formally, a data dictionary for object-oriented development encompasses the specification of each element in
the architecture.