Báo cáo y học: "Generation of a single pulmonary pressure-volume curve does not durably affect oxygenation in patients with acute respiratory distress syndrome" docx
Bạn đang xem bản rút gọn của tài liệu. Xem và tải ngay bản đầy đủ của tài liệu tại đây (196.24 KB, 5 trang )
Open Access
Available online />Page 1 of 5
(page number not for citation purposes)
Vol 10 No 3
Research
Generation of a single pulmonary pressure-volume curve does not
durably affect oxygenation in patients with acute respiratory
distress syndrome
Antoine Roch, Jean-Marie Forel, Didier Demory, Jean-Michel Arnal, Stéphane Donati,
Marc Gainnier and Laurent Papazian
Service de Réanimation Médicale, Hôpitaux Sud, Marseille, France
Corresponding author: Antoine Roch,
Received: 4 Mar 2006 Revisions requested: 27 Mar 2006 Revisions received: 7 Apr 2006 Accepted: 3 May 2006 Published: 1 Jun 2006
Critical Care 2006, 10:R85 (doi:10.1186/cc4936)
This article is online at: />© 2006 Roch et al.; licensee BioMed Central Ltd.
This is an open access article distributed under the terms of the Creative Commons Attribution License ( />),
which permits unrestricted use, distribution, and reproduction in any medium, provided the original work is properly cited.
Abstract
Introduction It is possible that taking a static pressure-volume
(PV) measurement could durably affect oxygenation and thus
interfere with early evaluation of a therapeutic intervention
delivered just after that measurement. The aim of the present
study was to investigate the effects over time of a single static
PV measurement on gas exchange and haemodynamics; the PV
measurements were taken using a super syringe and by using
the constant flow method in patients with acute respiratory
distress syndrome.
Method We conducted a prospective, randomized and
controlled interventional study in an intensive care unit. The
study was conducted in 17 patients with early acute respiratory
distress syndrome ventilated with a tidal volume of 6.9 ± 1.0 ml/
kg, a plateau pressure of 27 ± 7 cmH
2
O and a positive end-
expiratory pressure [PEEP] of 10 cmH
2
O. They were all
evaluated for 1 hour after each of the following two
measurements was taken and during a control period (in a
randomized order): generation of a PV curve using a 2 l super
syringe (PV
SS
; insufflated volume = 1824 ± 381 ml, plateau
pressure = 46 ± 9 cmH
2
O); and generation of a PV curve using
the constant flow method on the ventilator (PV
CF
; insufflated
volume = 1120 ± 115 ml in zero end-expiratory pressure after
20 s expiratory pause, plateau pressure = 46 ± 11 cmH
2
O). The
maximal airway pressure allowed during PV measurement was
60 cmH
2
O. PEEP was set to 10 cmH
2
O immediately after PV
measurement. Partial arterial oxygen tension (Pao
2
), partial
carbon dioxide tension (Paco
2
) and mean arterial pressure were
recorded each minute.
Results PV measurement did not significantly affect Pao
2
,
Paco
2
, mean arterial pressure and lung mechanics. Two patients
exhibited a sustained increase in Pao
2
by more than 20% after
PV
CF
(>60 minutes). Two patients exhibited a decrease in Pao
2
by more than 20% after PV
SS
, which was sustained in one.
These latter patients had an upper inflection point identified on
the PV curve. After PV
SS
, Paco
2
increased by more than 10
mmHg in two patients and returned to baseline values after 15
minutes. One patient exhibited a decrease in mean arterial
pressure by more than 10 mmHg for less than 5 minutes after
PV
SS
and one patient after PV
CF
.
Conclusion Evaluation of the effects of a strategy aimed at
improving oxygenation can be reliably recorded early after a
single PV measurement that is not followed by a change in
PEEP level. PV measurement using the constant flow method
improves oxygenation in a limited number of patients.
Introduction
The pressure-volume (PV) curve characteristics of the respira-
tory system are commonly evaluated in clinical and experimen-
tal studies of acute respiratory distress syndrome (ARDS). The
PV measurement involves insufflating the lungs at low flow
with a volume of up to 2 l using a super syringe [1] or about
1200 ml by ventilator [2], which is done in order to construct
a static PV curve. The procedures required to construct PV
curves may improve oxygenation because they result in alveo-
lar recruitment. On the other hand, there are aspects of the
ANOVA = analysis of variance; ARDS = acute respiratory distress syndrome; Crs = Chord compliance of the total respiratory system; Fio
2
= fractional
inspired oxygen; LIP = lower inflection point; MAP = mean arterial pressure; Paco
2
= arterial partial carbon dioxide tension; Pao
2
= arterial partial
oxygen tension; PEEP = positive end-expiratory pressure; Pplat = airway plateau pressure; PV = pressure-volume; UIP = upper inflection point.
Critical Care Vol 10 No 3 Roch et al.
Page 2 of 5
(page number not for citation purposes)
two procedures that could result in impaired oxygenation; spe-
cifically, it is necessary to disconnect the patient from the ven-
tilator before and after PV curve measurements with the super
syringe technique, and with the constant flow method positive
end-expiratory pressure (PEEP) must be removed before the
PV curve measurements can be taken [3,4]. However, the
potential sustained effects of PV measurement on gas
exchange and haemodynamic parameters have not been
investigated in patients presenting with acute respiratory dis-
tress syndrome (ARDS). This is of concern when ventilator
settings (such as adjusting PEEP level) or any other interven-
tion (for example prone positioning) are studied just after PV
measurement and evaluated by blood gas analysis during the
following 20–60 minutes. In these situations it is important to
know how long one should to wait after PV measurement to
obtain stable oxygenation parameters. The present study, con-
ducted in ARDS patients, compared the effects over time of a
single static PV measurement – using the super syringe and
the constant flow method – on gas exchange.
Materials and methods
The study was approved by our ethics committee. Seventeen
consecutive patients were investigated early in the course of
ARDS (<24 hour) once written informed consent had been
obtained from each patient's next of kin. Patients met the fol-
lowing criteria: arterial oxygen tension (Pao
2
)/fractional
inspired oxygen (Fio
2
) ratio of 200 or less, bilateral radio-
graphic pulmonary infiltrates, and pulmonary artery occlusion
pressure of 18 mmHg or less [5]. A computed tomography
scan was performed during the preceding 12 hours to classify
pulmonary infiltrates as diffuse, lobar, or patchy [6]. Patients
were sedated, paralyzed and ventilated under volume control
ventilation (Puritan Bennett 840; Puritan Bennett, Carlsbad,
CA, USA) using the following parameters throughout the
study: tidal volume at 6–7 ml/kg ideal body weight, plateau
pressure (Pplat) below 35 cm H
2
O, Fio
2
at 0.8 and PEEP at
10 cmH
2
O.
Patients were studied during three randomly assigned and
successive 1-hour periods, two of which were after the follow-
ing interventions one was a control period: a PV measurement
performed using a 2 l super syringe (PV
SS
) and a PV measure-
ment performed using the constant flow method (PV
CF
). PV
SS
measurement was completed in 60–90 s. The patient was dis-
connected from the ventilator during 3 s to reach functional
residual capacity. Then, 100 ml samples of oxygen were given
with a 2 s pause at the end of each inflation until an airway
pressure of 60 cmH
2
O was achieved. Finally, 100 ml samples
of oxygen were aspirated with a 2 s pause at the end of each
deflation until an airway pressure of 0 cmH
2
O was achieved.
PV
CF
measurement was preceded by an expiratory pause of
20 s and was completed in 8 s. Ventilatory parameters were
set on zero end-expiratory pressure, a respiratory rate of 3
breaths/minute and a tidal volume of 1200 ml to obtain a con-
stant flow of 9 l/minute, thus generating a PV curve on the
screen of the ventilator [2]. The maximal peak airway pressure
was set at 60 cmH
2
O. When a cycle at low flow was obtained,
parameters of the ventilator were immediately set as initially.
During the control period, patients were not disconnected
from the ventilator and PEEP was unchanged.
All patients had an arterial catheter placed for monitoring of
systemic pressures. Blood gases were recorded each minute
via a continuous arterial sensor system (Paratrend 7; Diamet-
rics Medical, St Paul, MN, USA) [7]. The 90% response time
for the sensor is 180 s or less at 37°C [8]. In humans, the bias
provided by the Paratrend 7 was found to be -1.19% for Pao
2
and +1.28 mmHg for Paco
2
[7]. During PV
SS
, inspiratory and
expiratory flows were measured using a pneumotachograph
(Hans-Rudolf 3700; Hans-Rudolf, Kansas City, KS, USA) and
a differential pressure transducer. Airway pressures were
measured using another differential pressure transducer. Vol-
ume changes were obtained by integration of the flow signal
recorded using the MP100 data acquisition system (Biopac
Systems, Goleta, CA, USA). A static PV curve was con-
structed to determinate the lower inflection point (LIP) [9] and
the upper inflection point (UIP) [10]. The Chord compliance of
the respiratory system (Crs) was defined as the slope of the
linear part of the PV curve obtained with the super syringe
technique.
Variables were expressed as mean ± standard deviation. A
two-way analysis of variance (ANOVA) for repeated measures
was conducted to study the effects of time and PV measure-
ment on recorded parameters. Positive or negative responders
to PV measurement were patients who exhibited an increase
or a decrease in Pao
2
/Fio
2
above 20% occurring in the 5 min-
utes after PV measurement and persisting for at least 15 min-
utes. Correlations were analyzed using Pearson product
correlation. The maximal increase in Pao
2
after PV measure-
ment taken using both methods was compared between
patients with diffuse, lobar, or patchy ARDS using one-way
ANOVA. P < 0.05 was considered statistically significant.
Results
Characteristics of the 17 patients are summarized in Table 1.
The Lung Injury Score was 3.1 ± 0.4 and the intensive care
unit mortality rate was 36%. Pulmonary infiltrates were classi-
fied as diffuse in 11 patients, lobar in three and patchy in three.
Tidal volume was 410 ± 96 ml (6.9 ± 1.0 ml/kg of ideal body
weight) with a mean inspiratory:expiratory ratio of 1:1.9. All
patients had stable haemodynamic parameters (mean arterial
pressure [MAP] 76 ± 17 mmHg, heart rate 110 ± 17 beats/
minute). Eight patients received norepinephrine (0.2 ± 0.1 µg/
kg per minute).
The insufflated volumes were 1824 ± 381 ml (range: 800–
2000 ml) during PV
SS
and 1120 ± 115 ml (range: 820–1200
ml) during PV
CF
. The Pplat was 46 ± 9 cmH
2
O at the end of
PV
SS
and was 46 ± 11 cmH
2
O at the end of PV
CF
. Peak airway
Available online />Page 3 of 5
(page number not for citation purposes)
pressure, Pplat, mean airway pressure and Crs (measured 5
minute after PV measurement) were not significantly modified
after PV
SS
(36 ± 8 cmH
2
O, 27 ± 7 cmH
2
O, 17 ± 4 cmH
2
O
and 58 ± 25 ml/cmH
2
O, respectively) and after PV
CF
(36 ± 6
cmH
2
O, 28 ± 7 cmH
2
O, 18 ± 4 cmH
2
O and 56 ± 29 cmH
2
O,
respectively) as compared with baseline values (36 ± 6
cmH
2
O, 27 ± 7 cmH
2
O, 18 ± 4 cmH
2
O and 56 ± 26 ml/
cmH
2
O, respectively).
ANOVA revealed that neither PV measurement nor time signif-
icantly affected Pao
2
when measured each minute (P = 0.6 for
PV measurement; P = 0.25 for time; P = 0.2 for interaction).
Two patients (patients 7 and 13; Table 1) were positive
responders to PV
CF
(Pao
2
/Fio
2
ratio increased after PV
CF
by
102% in one patient and by 38% in the other; Figure 1). In one
patient, Pao
2
returned to baseline within 2 hours (PV
CF
was fol-
lowed by control period) whereas the other remained a
responder after 3 hours (PV
CF
was the last period in this
patient). Two patients were negative responders to PV
SS
(Pao
2
/Fio
2
ratio decreased by 40% in one patient and by 35%
in the other; Figure 1). One patient remained a negative
responder 60 minutes after PV
SS
measurement. Neither the
Crs nor the Pplat reached during PV measurement was corre-
lated with the maximal increase in Pao
2
after PV measurement
using both methods (data not shown). The maximal increase in
Pao
2
after PV measurement using both methods was not dif-
ferent between patients with diffuse, lobar, or patchy ARDS
(data not shown).
Eleven patients exhibited a LIP on the PV curve obtained using
the super syringe (Table 1). The PEEP level was 2 cmH
2
O
above the LIP on inclusion in one positive responder to PV
CF
,
whereas no LIP was identified in the other positive responder.
Seven patients exhibited an UIP (at a volume of 1542 ± 82 ml
and a pressure of 39 ± 12 cmH
2
O). An UIP was present in the
two patients exhibiting a negative response to PV
SS
.
PV measurement did not significantly affect Paco
2
and MAP.
One patient had a decrease in MAP by more than 10 mmHg
for less than 5 minutes after PV
SS
and one patient after PV
CF
.
After PV
SS
, Paco
2
increased by more than 10 mmHg in two
patients and returned to baseline values after 15 minutes. No
case of barotrauma was observed on the chest radiograph
performed on the day after the protocol.
Table 1
Characteristics of the patients
Patient Sex Age
(years)
Diagnosis SAPS II
score
Pao
2
/Fio
2
ratio (mmHg)
Crs (ml/
cmH
2
O)
LIP
(cmH
2
O)
Pplat
(cmH
2
O)
UIP
(cmH
2
O)
1 F 56 Aspiration 42 121 58 15 22 -
2M 68CAP 45 95 251540 -
3 M 40 Aspiration 36 89 122 10 19 -
4M 51CAP 25 713452454
5 M 31 Aspiration 34 82 43 - 27 -
6M 41Pneumocystis 36 161 50 12 27 35
7 M 50 CAP 19 110 73 8 24 -
8M 73Legionella 32 72 75 13 31 -
9M 31Pneumocystis 9 112 78 - 24 -
10 M 31 Aspiration 74 104 55 7 26 -
11 M 66 Peritonitis 85 55 41 - 32 46
12 F 43 CAP 46 170 75 8 12 27
13 F 42 CAP 22 187 52 - 22 -
14 M 70 Aspiration 40 191 68 - 22 31
15 F 36 CAP 43 216 51 13 27 53
16 F 57 Aspiration 36 172 56 10 30 -
17 F 66 CAP 36 112 12 - 39 26
50 ± 15 39 ± 18 134 ± 60 56 ± 26 27 ± 7
Where applicable, results are expressed as mean ± standard deviation. Pao
2
/Fio
2
ratio is provided under a positive end-expiratory pressure level
of 10 cmH
2
O. CAP, community-acquired pneumonia; Crs, Chord compliance of the respiratory system; F, female; Fio
2
, fractional inspired oxygen;
LIP, lower inflection point; M, male; Pao
2
, partial arterial oxygen tension; Pplat, plateau airway pressure; SAPS II, Simplified Acute Physiology
Score II; UIP, upper inflection point.
Critical Care Vol 10 No 3 Roch et al.
Page 4 of 5
(page number not for citation purposes)
Discussion
Taking the measurements necessary to construct a single PV
curve without changing the PEEP level, either by super syringe
or by constant flow method, does not durably affect gas
exchange and haemodynamic parameters in a population of
ARDS patients. Therefore, early evaluation of the impacts of
changing ventilator settings or therapeutic interventions
should not be influenced by any lasting effect of PV measure-
ment. However, a very limited number of patients exhibit a sus-
tained alteration in oxygenation following PV measurements.
Therefore, if a small sample of patients or animals is studied,
then a blood gas analysis should be performed before and
after PV measurement before any therapeutic intervention is
applied, in order to ensure that blood gas analysis is reliable.
Our study compared the two methods commonly used for PV
measurement. PV measurement using the constant flow
method was able to improve oxygenation over several hours in
two of our 17 patients, whereas PV measurement using super
syringe impaired Pao
2
in two patients. This selective effect
could be explained by the differences in the design of these
PV curve methods. PV measurement using the super syringe
consists of a significant phase of alveolar recruitment at infla-
tion but this is followed by an active expiration and by a short
disconnection from the ventilator that probably prevents any
sustained recruitment. Moreover, this active expiration fol-
lowed by disconnection could have resulted in a dramatic
decrease in Pao
2
, although no such effect was observed in the
present investigation. In a recent study Lee and coworkers [3]
found that PV measurement using a super syringe was well tol-
erated in most ARDS patients but caused significant changes
in pulse oximetry. However, this latter study did not evaluate
for how long oxygenation may be affected by PV measure-
ment. During PV measurement using the constant flow
method, the removal of PEEP just before PV curve assessment
probably contributed to preventing any significant beneficial
effect on oxygenation. The improvement in oxygenation that
we observed in two patients could be accounted for by the
lack of disconnection from the ventilator and the lack of active
expiration as compared with the super syringe procedure.
Therefore, PV measurement using the constant flow method
could result in significant recruitment in a limited number of
ARDS patients.
In the present study, a single PV curve measurement did not
affect oxygenation while maintaining a PEEP level of 10
cmH
2
O after PV measurement. Therefore, we cannot rule out
the possibility that there is any beneficial influence of increas-
ing PEEP level after PV measurement. Indeed, the effects of a
recruitment manoeuvre were suggested to depend on the
PEEP level that is applied after that recruitment manoeuvre
[11,12]. In our patients, maintaining the PEEP level
unchanged after PV measurement might have contributed to
an early loss of recruitment possibly achieved during the PV
manoeuvre.
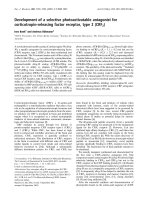
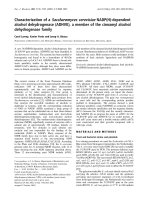
Figure 1
Evolution over time of Pao
2
/Fio
2
ratio following PV measurements and during a control periodEvolution over time of Pao
2
/Fio
2
ratio following PV measurements and
during a control period. The PV measurements were taken using the
super syringe (PV
SS
) and constant flow method (PV
CF
). Data are
expressed as percentage increase or decrease in Pao
2
/Fio
2
ratio at 5,
15, 30 and 60 minutes as compared with values before PV measure-
ment or the control period. Dashed lines represent 20% increase and
decrease as compared with before PV measurement. Fio
2
, fractional
inspired oxygen; Pao
2
, partial arterial oxygen tension; PV, pressure-vol-
ume.
Available online />Page 5 of 5
(page number not for citation purposes)
We performed only one PV measurement, and therefore we
cannot rule out any deleterious effect of PV measurements
repeated at short intervals. Indeed, repeated generation of a
PV curve using the constant flow method in pigs subjected to
lung lavage was recently shown to induce de-recruitment by
repeated removal of PEEP [4].
The response to a potential recruitment manoeuvre might
depend on the nature of the insult (pulmonary versus
extrapulmonary) [13], and on the stage of lung disease (early
versus late phase) [14]. Indeed, it is likely that a recruitment
manoeuvre is less effective in pulmonary ARDS as well as in
late ARDS (for example in patients with more consolidation or
fibrosis) [12]. In our study we included mainly patients with
pulmonary ARDS. This could have contributed to the lack of
beneficial effect of constructing a PV curve on oxygenation.
However, our patients presented with early and mainly diffuse
ARDS, which should have potentiated the recruitment poten-
tially induced by a PV manoeuvre.
Conclusion
The effects of a strategy aimed at improving oxygenation can
be reliably recorded early after a single PV measurement that
is not followed by a change in PEEP level. This finding is impor-
tant because many clinical and experimental studies report
early evaluation findings for therapeutic interventions that are
initiated just after PV measurement. Even if a few patients
exhibit a sustained improvement in oxygenation (>60 minutes)
after PV measurement using the constant flow method, then
this latter method cannot be considered a recruitment
manoeuvre. We confirmed that PV curve assessment is well
tolerated in ARDS patients.
Competing interests
The authors declare that they have no competing interests.
Authors' contributions
AR and LP designed the study and drafted the manuscript. AR
performed the statistical analysis. AR, JMF, DD, JMA, SD and
MG performed the study. All authors read and approved the
final manuscript.
Acknowledgements
A grant (PHRC 2002) was obtained from the French Ministry of Health
for the present work.
References
1. Matamis D, Lemaire F, Harf A, Brun-Buisson C, Ansquer JC, Atlan
G: Total respiratory pressure-volume curves in the adult res-
piratory distress syndrome. Chest 1984, 86:58-66.
2. Lu Q, Vieira SR, Richecoeur J, Puybasset L, Kalfon P, Coriat P,
Rouby JJ: A simple automated method for measuring pres-
sure-volume curves during mechanical ventilation. Am J
Respir Crit Care Med 1999, 159:275-282.
3. Lee WL, Stewart TE, MacDonald R, Lapinsky S, Banayan D, Hallett
D, Mehta S: Safety of pressure-volume curve measurement in
acute lung injury and ARDS using a syringe technique. Chest
2002, 121:1595-1601.
4. Henzler D, Mahnken A, Dembinski R, Waskowiak B, Rossaint R,
Kuhlen R: Repeated generation of the pulmonary pressure-vol-
ume curve may lead to derecruitment in experimental lung
injury. Intensive Care Med 2005, 31:302-310.
5. Bernard GR, Artigas A, Brigham AL, Carlet J, Falke K, Hudson L,
Lamy M, LeGall JR, Mois A, Spragg R: American-European con-
sensus conference on ARDS. Am J Respir Crit Care Med 1994,
149:818-824.
6. Rouby JJ, Puybasset L, Cluzel P, Richecoeur J, Lu Q, Grenier P:
Regional distribution of gas and tissue in acute respiratory
distress syndrome. II. Physiological correlations and definition
of an ARDS Severity Score. CT Scan ARDS Study Group. Inten-
sive Care Med 2000, 26:1046-1056.
7. Abraham E, Gallagher TJ, Fink S: Clinical evaluation of a multi-
parameter intra-arterial blood-gas sensor. Intensive Care Med
1996, 22:507-513.
8. Biomedical Sensors: Paratrend 7 Operating Instructions Malvern,
PA: Biomedical Sensors; 1993:6-18.
9. Gattinoni L, Pesenti A, Avalli L, Rossi F, Bombino M: Pressure-
volume curve of total respiratory system in acute respiratory
failure. Computed tomographic scan study. Am Rev Respir Dis
1987, 136:730-736.
10. Roupie E, Dambrosio M, Servillo G, Mentec H, el Atrous S, Beydon
L, Bun-Buisson C, Lemaire F, Brochard L: Titration of tidal vol-
ume and induced hypercapnia in acute respiratory distress
syndrome. Am J Respir Crit Care Med 1995, 152:121-128.
11. Lim S, Adams AB, Simonson DA, Dries DJ, Broccard AF, Hotchk-
iss JR, Marini JJ: Intercomparison of recruitment maneuver effi-
cacy in three models of acute lung injury. Crit Care Med 2004,
32:2371-2377.
12. Kloot TE, Blanch L, Melynne Youngblood A, Weinert C, Adams
AB, Marini JJ, Shapiro RS, Nahum A: Recruitment maneuvers in
three experimental models of acute lung injury. Effect on lung
volume and gas exchange. Am J Respir Crit Care Med 2000,
161:1485-1494.
13. Pelosi P, Cadringher P, Bottino N, Panigada M, Carrieri F, Riva E,
Lissoni A, Gattinoni L: Sigh in acute respiratory distress
syndrome. Am J Respir Crit Care Med 1999, 159:872-880.
14. Grasso S, Mascia L, Del Turco M, Malacarne P, Giunta F, Brochard
L, Slutsky AS, Ranieri M: Effects of recruiting maneuvers in
patients with acute respiratory distress syndrome ventilated
with protective ventilatory strategy. Anesthesiology 2002,
96:795-802.
Key messages
• The generation of a single pulmonary PV curve, whether
one uses the super syringe or the constant flow
method, does not significantly and durably affect oxy-
genation and haemodynamic parameters in ARDS
patients.
• Evaluation of the effects of a strategy aiming at improv-
ing oxygenation can be reliably recorded early after PV
measurement.