Báo cáo y học: "Measurement of alveolar derecruitment in patients with acute lung injury: computerized tomography versus pressure–volume curve" ppsx
Bạn đang xem bản rút gọn của tài liệu. Xem và tải ngay bản đầy đủ của tài liệu tại đây (717.32 KB, 10 trang )
Open Access
Available online />Page 1 of 10
(page number not for citation purposes)
Vol 10 No 3
Research
Measurement of alveolar derecruitment in patients with acute
lung injury: computerized tomography versus pressure–volume
curve
Qin Lu
1,6
, Jean-Michel Constantin
2,6
, Ania Nieszkowska
3,6
, Marilia Elman
4,6
, Silvia Vieira
5,6
and
Jean-Jacques Rouby
1,6
1
Surgical Intensive Care Unit Pierre Viars, Department of Anesthesiology, Assistance Publique – Hôpitaux de Paris, La Pitié-Salpêtrière Hospital, 47-
83 boulevard de l'Hôpital 75013 Paris, France
2
Surgical Intensive Care Unit, Hôtel-Dieu Hospital, Centre Hospitalo-Universitaire de Clermont Ferrand, boulevard Léon Malfreyt 63058 Clemont
Ferrand cedex, France
3
Medical Intensive Care Unit, Assistance Publique-Hôpitaux de Paris, La Pitié-Salpêtrière Hospital, 47-83 boulevard de l'Hôpital 75013 Paris, France
4
Department of Anesthesiology of Santa Casa de Misericordia de São Paulo, Faculdade de Ciências Médicas da Santa Casa de São Paulo, Rua Dr
Sesario Mota Jr, 61, Santa Cecilia/São Paulo – 01221-020 – Brazil
5
Department of Internal Medicine, Faculty of Medicine Federal University from Rio Grande do Sul, Intensive Care Unit, Hospital de Clinicas de Porto
Alegre, Rua Ramiro Barcelos, 2350 – 90035-903 Porto Alegre/Rio Grande do Sul – Brazil
6
From the Surgical Intensive Care Unit Pierre Viars, Department of Anesthesiology, Assistance Publique-Hôpitaux de Paris, La Pitié-Salpêtrière
Hospital, University School of Medicine Pierre et Marie Curie
Corresponding author: Jean-Jacques Rouby,
Received: 22 Feb 2006 Revisions requested: 27 Mar 2006 Revisions received: 16 May 2006 Accepted: 23 May 2006 Published: 22 Jun 2006
Critical Care 2006, 10:R95 (doi:10.1186/cc4956)
This article is online at: />© 2006 Lu et al.; licensee BioMed Central Ltd.
This is an open access article distributed under the terms of the Creative Commons Attribution License ( />),
which permits unrestricted use, distribution, and reproduction in any medium, provided the original work is properly cited.
Abstract
Introduction Positive end-expiratory pressure (PEEP)-induced
lung derecruitment can be assessed by a pressure–volume (P–
V) curve method or by lung computed tomography (CT).
However, only the first method can be used at the bedside. The
aim of the study was to compare both methods for assessing
alveolar derecruitment after the removal of PEEP in patients with
acute lung injury or acute respiratory distress syndrome.
Methods P–V curves (constant-flow method) and spiral CT
scans of the whole lung were performed at PEEPs of 15 and 0
cmH
2
O in 19 patients with acute lung injury or acute respiratory
distress syndrome. Alveolar derecruitment was defined as the
difference in lung volume measured at an airway pressure of 15
cmH
2
O on P–V curves performed at PEEPs of 15 and 0
cmH
2
O, and as the difference in the CT volume of gas present
in poorly aerated and nonaerated lung regions at PEEPs of 15
and 0 cmH
2
O.
Results Alveolar derecruitments measured by the CT and P–V
curve methods were 373 ± 250 and 345 ± 208 ml (p = 0.14),
respectively. Measurements by both methods were tightly
correlated (R = 0.82, p < 0.0001). The derecruited volume
measured by the P–V curve method had a bias of -14 ml and
limits of agreement of between -158 and +130 ml in comparison
with the average derecruited volume of the CT and P–V curve
methods.
Conclusion Alveolar derecruitment measured by the CT and P–
V curve methods are tightly correlated. However, the large limits
of agreement indicate that the P–V curve and the CT method are
not interchangeable.
Introduction
Reducing tidal volume during mechanical ventilation
decreases mortality in patients with acute respiratory distress
syndrome (ARDS) [1]. However, selecting the right level of
positive end-expiratory pressure (PEEP) remains a difficult
issue [2,3]. A recent multicenter randomized trial failed to dem-
onstrate a decrease in mortality when a high PEEP was
applied to patients with ARDS [3]. Several studies using
ALI = acute lung injury; ARDS = acute respiratory distress syndrome; CT = computed tomography; ∆EELV = changes in end-expiratory lung volume
measured by pneumotachography; ∆FRC = change in functional residual capacity measured by the computed tomography method; HU = Hounsfield
unit; PaCO
2
= arterial partial pressure of CO
2
; PEEP = positive end-expiratory pressure; P–V = pressure–volume; ZEEP = zero end-expiratory
pressure.
Critical Care Vol 10 No 3 Lu et al.
Page 2 of 10
(page number not for citation purposes)
computed tomography (CT) have suggested that the right
level of PEEP should be selected according to the specific
lung morphology of each individual patient, taking into consid-
eration not only the potential for recruitment but also the risk
of lung overinflation [2,4-7].
In the early 1990s, Ranieri and colleagues suggested that
PEEP-induced alveolar recruitment could be measured from
pressure–volume (P–V) curves [8]. Based on the physiologi-
cal concept that any increase in lung volume at a given static
airway pressure is due to the recruitment of previously nonaer-
ated lung regions, PEEP-induced alveolar recruitment was
defined as the increase in lung volume at a given airway pres-
sure measured on P–V curves performed in PEEP and zero
end-expiratory pressure (ZEEP) conditions [9,10]. The
recruited volume measured by the P–V curve method was
then found to be correlated with the increase in arterial oxy-
genation [9,11]. In the late 1990s, the validation of the con-
stant flow method for measuring P–V curves [12] gave the
possibility of measuring alveolar recruitment more easily at the
bedside [13-15]. Consequently, the P–V curve method
became a technique widely accepted by clinical researchers
for assessing alveolar derecruitment [15-17]. However, this
method has never been compared with another independent
method. Another critical question is whether the P–V curve
method can differentiate recruitment from (over)inflation.
Recently, Malbouisson and colleagues proposed a CT method
for assessing PEEP-induced alveolar recruitment [18]. Alveo-
lar recruitment was defined as the volume of gas penetrating
into poorly aerated and nonaerated lung areas after PEEP.
With this method, a good correlation was found between
PEEP-induced alveolar recruitment and improvement of arte-
rial oxygenation. The CT method, although considered by
many as a gold standard, cannot be performed routinely and
repeated easily because it requires the patient to be trans-
ported outside the intensive care unit.
We undertook a comparative assessment of the P–V curve
and CT methods for measuring alveolar derecruitment after
PEEP withdrawal in patients with acute lung injury (ALI) or
ARDS. The aim of the study was to assess whether the P–V
curve method could replace the CT method and be consid-
ered a valuable clinical tool at the bedside.
Materials and methods
Study design
After approval had been obtained from the Ethical Committee,
and informed consent from the patients' next-of-kin, 19
patients with ALI/ARDS [19] were studied prospectively.
Patients with untreated pneumothorax and bronchopleural fis-
tula were excluded. Patients were ventilated in a volume-con-
trolled mode with tidal volumes of 7.7 ± 1.8 ml/kg with a Horus
ventilator (Taema, Antony, France). All patients were moni-
tored with a fiber-optic thermodilution pulmonary artery cathe-
ter (CCO/SvO
2
/VIP TD catheter Baxter Healthcare co, Irvine,
CA, USA) and radial or femoral arterial catheters.
After one hour of mechanical ventilation at a PEEP of 15
cmH
2
O, each patient was transported to the Department of
Radiology. All patients were anesthetized and paralyzed dur-
ing the study. Cardiorespiratory parameters at a PEEP of 15
cmH
2
O were recorded on a Biopac system (Biopac System
Inc. Goleta, CA, USA) [20] and a P–V curve of the respiratory
system at a PEEP of 15 cmH
2
O was measured with the low
constant flow method (9 L/minute) [12]. Scanning of the
whole lung at a PEEP of 15 cmH
2
O was performed as
described previously [18]. Contiguous axial CT sections 10
mm thick were acquired after clamping the connecting piece
between the Y piece and the endotracheal tube. During acqui-
sition, airway pressure was monitored to ensure that a PEEP
of 15 cmH
2
O was actually applied. The patient was then dis-
connected from the ventilator, and the change of end-expira-
tory lung volume (∆EELV) resulting from PEEP withdrawal was
measured with a calibrated pneumotachograph. P–V curve,
CT scan and cardiorespiratory measurements in ZEEP condi-
tions were performed immediately after disconnecting maneu-
vers. Between each measurement, mechanical ventilation at a
PEEP of 15 cmH
2
O was resumed to standardize lung volume
history. In seven patients, the same measurements in ZEEP
were performed at the end of a 15-minute period of mechani-
cal ventilation without PEEP.
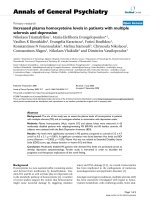
The time course of the protocol is summarized in Figure 1.
Cardiorespiratory measurements
In each patient, cardiac output, systemic arterial pressure,
right atrial pressure, pulmonary artery pressure, pulmonary
capillary wedge pressure and airway pressure were recorded
continuously with the Biopac system. Fluid-filled transducers
were positioned at the midaxillary line and connected to the
different lines of the pulmonary artery catheter. Cardiac filling
pressures were measured at end expiration and averaged over
five cardiac cycles. Pulmonary shunt and systemic and pulmo-
nary vascular resistances were calculated from standard for-
mula. Expired CO
2
was continuously recorded and measured
with an infrared capnometer, and the ratio of alveolar dead
space to tidal volume (V
DA
/V
T
) was calculated from the equa-
tion V
DA
/V
T
= 1 - PetCO
2
/PaCO
2
, where PetCO
2
is end-tidal
CO
2
measured at the plateau of the expired CO
2
curve and
PaCO
2
is arterial partial pressure of CO
2
. The compliance of
the respiratory system was calculated by dividing the tidal vol-
ume by the plateau pressure minus the intrinsic PEEP.
CT measurements of alveolar derecruitment and
changes in functional residual capacity resulting from
PEEP withdrawal
CT analysis was performed on the entire lung from the apex to
the diaphragm as described previously [18]. In a first step, the
two CT sections obtained in ZEEP and PEEP conditions
Available online />Page 3 of 10
(page number not for citation purposes)
corresponding to the same anatomical level were matched
and displayed simultaneously on the screen of the computer
(Figure 2). Each CT section obtained in ZEEP conditions was
shown on the screen of the computer with the use of a color-
encoding system integrated in the Lungview
®
software. Non-
aerated voxels (CT attenuation between -100 and +100
Hounsfield units (HU)) were colored in red, poorly aerated vox-
els (CT attenuation between -500 and -100 HU) in light gray,
and normally aerated voxels (CT attenuation between -500
and -900 HU) in dark gray. Overinflated voxels (CT attenua-
tions between -900 and -1,000 HU) were colored in white. As
shown in Figure 2, the color encoding served to separate two
regions of interest on each CT section: normally aerated lung
regions, and poorly or nonaerated lung regions. In a second
step, by referring to anatomical landmarks, the limit between
the two regions of interest delineated on the CT section in
ZEEP conditions was manually redrawn on the CT section in
PEEP conditions. During the regional analysis, two CT sec-
tions obtained in PEEP often corresponded to a single CT
section obtained in ZEEP conditions, as attested by the ana-
tomical landmarks (divisions of bronchial and pulmonary ves-
sels). In such a situation, the region of interest manually
delineated on the ZEEP CT section was manually delineated
on the two corresponding CT sections obtained in PEEP con-
ditions. In each of the two regions of interest delineated in
ZEEP and PEEP conditions – namely, normally aerated lung
region, and poorly aerated and nonaerated lung regions – the
volumes of gas and tissue were computed from the following
equations [18], in which CT number is the CT attenuation of
the compartment analyzed:
volume of the voxel = (size of the pixel)
2
× section thickness
(1)
total lung volume = number of voxels × volume of the voxel
(2)
volume of gas = (-CT number/1,000) × total volume, if the
compartment considered has a CT number below 0 (volume
of gas = 0 if the compartment considered has a CT number
above 0) (3)
volume of lung tissue = (1 + CT number/1,000) × total vol-
ume, if the compartment considered has a CT number below
zero (4)
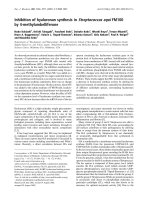
Figure 1
Illustration of the time course of the protocolIllustration of the time course of the protocol. The upper panel represents the time course of the protocol for 12 patients for whom a computed tom-
ography (CT) scan and pression–volume (P–V) curve in zero end-expiratory pressure (ZEEP) were acquired immediately after positive end-expiratory
pressure (PEEP) withdrawal. The lower panel represents the time course of the protocol for 7 patients for whom a CT scan and P–V curve in ZEEP
were acquired after 15 minutes of mechanical ventilation without PEEP. End-expiratory occlusion is defined as occlusion of the connecting piece
between the Y piece and the endotracheal tube at end expiration; disconnection is defined as PEEP withdrawal, the patient being disconnected
from the ventilator. ∆EELV, decrease in end-expiratory lung volume resulting from PEEP withdrawal measured by pneumotachography after the dis-
connecting maneuver.
Critical Care Vol 10 No 3 Lu et al.
Page 4 of 10
(page number not for citation purposes)
volume of lung tissue = number of voxels × volume of the voxel,
if the compartment considered has a CT number above zero
(5)
The change in functional residual capacity resulting from
PEEP withdrawal (∆FRC) was computed as the difference in
total volume of gas in the whole lung between PEEP and
ZEEP. Alveolar derecruitment was defined as the difference in
gas volume in poorly aerated and nonaerated lung regions
between PEEP and ZEEP. The changes in gas volume result-
ing from PEEP withdrawal in normally aerated lung regions
characterized by CT attenuations between -500 and -900 HU
were computed separately (Figure 2). As described previously
[21], the distribution of the loss of lung aeration in each patient
(lung morphology) was classified as diffuse, patchy, and lobar
on the basis of the distribution of CT attenuations at ZEEP.
Pneumotachographic measurement of changes in end-
expiratory lung volume resulting from PEEP withdrawal
∆EELV was measured with a heated pneumotachograph
(Hans Rudolph Inc, Kansas City, KA, USA) positioned
between the Y piece and the connecting piece. The pneumo-
tachograph was previously calibrated with a supersyringe
filled with 1,000 ml of air. The precision of the calibration was
3%. The respiratory tubing connecting the endotracheal tube
to the Y piece of the ventilatory circuit was occluded by a
clamp at an end-expiratory pressure of 15 cmH
2
O while the
ventilator was disconnected from the patient. This occlusion
was performed after a prolonged expiration obtained by
decreasing the respiratory rate to 5 breaths/minute. The clamp
was then released and the exhaled volume measured by the
pneumotachograph was recorded on the Biopac system. The
total duration from PEEP withdrawal to reconnection of the
ventilator to the patient was 7.4 ± 0.4 s.
Measurement of alveolar derecruitment by P–V curves
P–V curves of the respiratory system were acquired with the
specific software of the Horus ventilator – low constant flow
technique [12] – and recorded with the Biopac system. During
insufflation, the maximum peak airway pressure was limited to
50 cmH
2
O. Data pairs of airway pressure and volume of the
P–V curves in ZEEP and PEEP conditions recorded on the
computer were fitted to a sigmoid model as proposed by Ven-
egas and colleagues [22]. The lower and upper inflection
points as well as the slope of the linear part of the curve
between lower and upper inflection points were computed
from inspiratory P–V curves in ZEEP conditions.
Because the Horus ventilator was not equipped with a specific
software measuring alveolar derecruitment directly, alveolar
derecruitment resulting from PEEP withdrawal was measured
from the data recorded on the computer with the help of
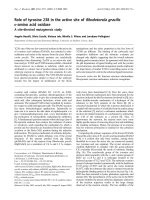
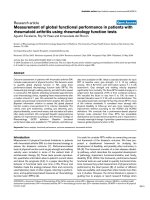
Figure 2
Assessment of alveolar derecruitment by computed tomography (left panel) and pressure-volume curves (right panel)Assessment of alveolar derecruitment by computed tomography (left panel) and pressure-volume curves (right panel). Image 1 shows a computed
tomography (CT) section representative of the whole lung obtained at zero end-expiratory pressure (ZEEP). The dashed line separates poorly aer-
ated and nonaerated lung areas (which appear in light gray and red, respectively, on image 2) from normally aerated lung areas (colored in dark gray
on image 2 by a color-encoding system included in Lungview). Image 3 shows the same CT section obtained at a positive end-expiratory pressure
(PEEP) of 15 cmH
2
O. The delineation performed at ZEEP has been transposed on the new CT section in accordance with anatomical landmarks
such as divisions of pulmonary vessels. Image 4 shows the same CT section with the color-encoding system, the overinflated lung areas appearing
in white. Alveolar derecruitment was defined as the decrease in gas volume in poorly aerated and nonaerated lung regions after PEEP withdrawal. In
the right panel, the pressure-volume (P–V) curves of the total respiratory system measured at ZEEP and a PEEP of 15 cmH
2
O are represented. After
determining the decrease in total gas volume resulting from PEEP withdrawal (∆FRC), ∆FRC was added to each volume for constructing the P–V
curve in PEEP conditions. The two curves were then placed on the same pressure and volume axis. Derecruitment volume was identified by a down-
ward shift of the ZEEP P–V curve compared with the PEEP P–V curve and computed as the difference in lung volume between PEEP and ZEEP at
an airway pressure of 15 cmH
2
O.
Available online />Page 5 of 10
(page number not for citation purposes)
Microsoft Excel files as follows: first, ∆FRC was added to each
volume of the P–V curve in PEEP conditions; then the P–V
curves in ZEEP and PEEP conditions were placed on the
same volume axis. Derecruited volume was computed as the
difference in lung volume between PEEP and ZEEP at an air-
way pressure of 15 cmH
2
O [10] (Figure 2).
Statistical analysis
Data are expressed as means ± SD or as median (range)
depending on the data distribution. Cardiorespiratory and CT
variables were compared before and after the administration
of PEEP with the use of a paired Student t test or a Wilcoxon
test. All correlations were made by linear regression. Agree-
ment between CT and P–V curve methods was tested with the
Bland and Altman method [23]: the bias was expressed as the
mean difference of derecruited volume between the P–V curve
method and the average value of the P–V curves and CT meth-
ods; the limits of agreement were defined as 2 SD. The statis-
tical analysis was performed with Sigmastat 3.1 (Systat
Software Inc., Point Richmond, CA, USA). The statistical sig-
nificance level was fixed at p = 0.05.
Results
Patients
Nineteen consecutive patients with ALI/ARDS (2 females and
17 males; age 48 ± 17 yrs) were studied. ALI/ARDS was
related to postoperative pulmonary infection (n = 10), bron-
chopulmonary aspiration in the postoperative period (n = 5),
lung contusion (n = 3), and extracorporeal circulation (n = 1).
Three patients had diffuse, nine patchy and seven lobar loss of
lung aeration. The delay between the onset of ALI/ARDS and
inclusion in the study was 3 days (range, 1 to 10 days). The
lung injury severity score [24] was 2.3 ± 0.7. Ten patients had
septic shock requiring norepinephrine (noradrenaline). The
overall mortality rate was 32%.
Cardiorespiratory changes and P–V curves in ZEEP and
PEEP conditions
As shown in Table 1, PEEP withdrawal resulted in a significant
decrease in arterial partial pressure of oxygen (PaO
2
) and pul-
monary capillary wedge pressure, and a significant increase in
pulmonary shunt, PaCO
2
, slope of the P–V curve, mean arte-
rial pressure, and cardiac index.
Sixteen patients had a lower inflection point and 17 an upper
inflection point on their P–V curves in ZEEP: these were at 9.2
± 4.8 cmH
2
O (range 3 to 16 cmH
2
O) and 28.1 ± 5.4 cmH
2
O
(19 to 40 cmH
2
O), respectively.
Comparison of PEEP-induced changes in end-expiratory
lung volume measured by pneumotachography and
functional residual capacity measured by CT
In the 12 patients in whom CT sections at ZEEP were
acquired immediately after the disconnecting maneuver,
∆FRC and ∆EELV were similar (1,054 ± 352 ml versus 1,022
± 315 ml). In the 7 patients in whom CT sections at ZEEP
were acquired 15 minutes after the disconnecting maneuver,
∆FRC was significantly greater than ∆EELV (1,167 ± 230 ver-
Table 1
Cardiorespiratory parameters of 19 patients at PEEPs of 15 cmH
2
O and 0
Parameter PEEP ZEEP p
PaO
2
(mmHg) 213 ± 83 147 ± 80 <0.0001
Qs/Qt (%) 30 ± 6 39 ± 9 <0.0001
PaCO
2
(mmHg) 43 ± 8 46 ± 8 0.006
VD
A
/VT (%) 29 ± 11 33 ± 12 NS
Crs (ml cmH
2
O
-1
) 56 ± 26 48 ± 14 NS
Slope (ml cmH
2
O
-1
) 53 ± 21 69 ± 26 0.003
PEEPi (cmH
2
O) 2.2 ± 1.1 0.8 ± 1.1 0.001
MAP (mmHg) 84 ± 13 92 ± 15 0.006
SVRI (dyn s
-1
cm
-5
m
2
) 1,767 ± 748 1,916 ± 1,114 NS
MPAP (mmHg) 28 ± 8 25 ± 9 NS
PVRI (dyn s
-1
cm
-5
m
2
) 345 ± 164 289 ± 174 NS
PCWP (mmHg) 14 ± 3 11 ± 4 0.02
CI (l minute
-1
m
-2
) 3.7 ± 1.8 4.3 ± 1.8 0.03
CI, cardiac index; Crs, respiratory compliance; MAP, mean arterial pressure; MPAP, mean pulmonary arterial pressure; NS, not significant; PaCO
2
,
arterial partial pressure of CO
2
; PaO
2
, arterial partial pressure of oxygen; PCWP, pulmonary capillary wedge pressure; PEEPi, intrinsic positive
end-expiratory pressure; PVRI, pulmonary vascular resistance index; Qs/Qt, pulmonary shunt; slope, respiratory inflation compliance; SVRI,
systemic vascular resistance index; VD
A
/VT, alveolar deadspace; ZEEP, zero end-expiratory pressure; PEEP, positive end-expiratory pressure.
Data are expressed as means ± SD.
Critical Care Vol 10 No 3 Lu et al.
Page 6 of 10
(page number not for citation purposes)
sus 1,028 ± 200 ml, p = 0.03). Very probably, the period of
15 minutes of mechanical ventilation without PEEP induced an
additional time-dependent derecruitment.
Comparison of alveolar derecruitment measured by the
CT and P–V curve methods
CT analysis showed that PEEP withdrawal induced a signifi-
cant increase in poorly aerated and nonaerated lung volumes
and a decrease in normally aerated lung volume (Table 2).
One-third of the decrease in FRC resulting from PEEP with-
drawal was related to lung derecruitment, the other two-thirds
being caused by the deflation of normally aerated lung regions
(Table 3). In PEEP conditions, lung overinflation of between 7
and 446 ml was observed in 10 patients.
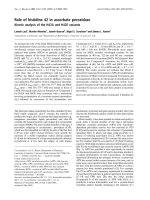
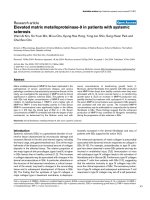
As shown in Figure 3, alveolar derecruitment measured by the
P–V curve method was tightly correlated with alveolar dere-
cruitment measured by the CT scan method. The derecruited
volume measured by the P–V curve method had a bias of -14
ml and limits of agreement between -158 and +130 ml in com-
parison with the average derecruited volume of the CT and P–
V curve methods. The decrease in gas volume in the normally
aerated lung regions resulting from PEEP withdrawal meas-
ured by CT was tightly correlated with lung volume measured
at an airway pressure of 15 cmH
2
O on the P–V curve per-
formed in ZEEP conditions (y = 51.6 + 0.95x, R = 0.90, p <
0.0001).
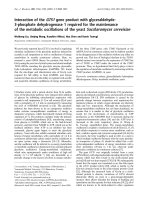
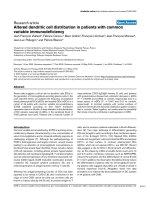
∆FRC resulting from PEEP withdrawal was weakly correlated
with alveolar derecruitment measured by the P–V curve
method (Figure 4). The change in nonaerated lung volume
resulting from PEEP withdrawal measured by CT was not cor-
related to the derecruited volume measured by the P–V curve
method (R = 0.4, p = 0.07).
Table 2
Computed tomographic analysis of degrees of lung aeration of the whole lung
Parameter PEEP ZEEP p
Lung volume, gas + tissue (ml) 3,372 ± 686 2,283 ± 549 <0.001
Functional residual capacity (ml) 2,035 ± 594 992 ± 450 <0.001
Volume of tissue (ml) 1,344 ± 315 1,296 ± 328 0.015
Overinflated lung volume (ml) 51 ± 121 (0–508) 4 ± 11(0–45) <0.001
Normally aerated lung volume (ml) 2,476 ± 649 1,133 ± 640 <0.001
Poorly aerated lung volume (ml) 394 ± 224 597 ± 280 0.002
Nonaerated lung volume (ml) 451 ± 275 (123–1,213) 549 ± 342 (165–1,452) 0.001
ZEEP, zero end-expiratory pressure; PEEP, positive end-expiratory pressure of 15 cmH
2
O. Results in parentheses are ranges.
Figure 3
Comparison of alveolar derecruitment assessed by the computed tomography and pressure–volume curve methodsComparison of alveolar derecruitment assessed by the computed tomography and pressure–volume curve methods. In the left panel, the linear cor-
relation existing between the two methods is represented. In the right panel, the agreement between the two methods is represented with the Bland
and Altman analysis. Open circles indicate 12 patients in whom alveolar derecruitment was measured by both methods immediately after the discon-
necting maneuver; closed circles identify seven patients in whom alveolar derecruitment was measured by both methods 15 minutes after PEEP
withdrawal. The bias was expressed as the mean difference between the derecruited volume measured by the P–V curve method and the average
value of the two methods. The limits of agreement were defined as 2 SD.
Available online />Page 7 of 10
(page number not for citation purposes)
Discussion
This study shows a statistically tight correlation between alve-
olar derecruitment measured by the P–V curve and CT meth-
ods. However, the large limits of agreement indicate that the
P–V curve method cannot replace the CT method.
Comparison of changes in functional residual capacity
measured by CT and changes in end-expiratory lung
volume measured by pneumotachography
Alveolar derecruitment resulting from PEEP withdrawal rather
than recruitment induced by PEEP implementation was meas-
ured in the present study first and foremost for safety and
methodological reasons. Each patient enrolled in the study
was ventilated with PEEP at inclusion and the clinician in
charge considered that PEEP had to be maintained during the
transportation to the Department of Radiology. Ventilation with
PEEP was therefore considered as the control condition. In
addition, ∆EELV, an indispensable parameter for constructing
P–V curves in PEEP conditions, can be measured by pneumo-
tachography only during a PEEP releasing maneuver, which
corresponds to a derecruitment maneuver.
After PEEP withdrawal, lung derecruitment continues. This
study was initially designed for measuring immediate and time-
dependent derecruitment after PEEP withdrawal as recom-
mended previously [8,9]. This is the reason that seven patients
underwent CT scan and P–V curve at ZEEP, 15 minutes after
PEEP withdrawal. ∆EELV, measured by pneumotachography
immediately after PEEP withdrawal, was initially used for
constructing the P–V curve at PEEP. However, after complet-
ing the CT analysis of the seven patients, we found that ∆FRC
computed from CT scan data was 15% greater than ∆EELV
measured by pneumotachography. In other words, a 15-
minute period of mechanical ventilation at ZEEP had induced
an additional lung derecruitment that could not be measured
by pneumotachography. If, as initially planned, we had used
∆EELV measured by pneumotachography for constructing the
P–V curve at PEEP, alveolar derecruitment measured by the
P–V curve method would have been underestimated. This is
why, in the present study, ∆FRC rather than ∆EELV was used
in the construction of the P–V curve at PEEP.
If ∆EELV is measured by direct spirometry (pneumotachogra-
phy, hot wire, or any other technique), the existence of a time-
dependent lung derecruitment imposes the requirement to
perform the measurement immediately after a PEEP releasing
maneuver. Our main objective was to validate the P–V curve
method, the only method that might have a bedside applica-
tion. To standardize the conditions for measuring ∆FRC and
∆EELV, P–V curves and CT scans at ZEEP were measured
immediately after PEEP withdrawal in an additional group of
12 patients. Measurement of time-dependent lung derecruit-
ment requires the measurement of changes in FRC (CT and
gas dilution techniques). As far as assessment of time-
dependent lung derecruitment is concerned, the possibility of
measuring FRC provided on some recent ventilators is of
Table 3
Separate regional computed tomographic analysis of normally aerated/poorly aerated and nonaerated lung regions
Parameter PEEP ZEEP p
Regional analysis performed in poorly aerated and nonaerated lung regions
Lung volume, gas + tissue (ml) 1,438 ± 582 1,068 ± 424 < 0.001
Volume of gas (ml) 561 ± 325 188 ± 109 < 0.001
Volume of tissue (ml) 877 ± 361 880 ± 376 NS
Regional analysis performed in normally aerated lung regions
Lung volume, gas + tissue (ml) 1,940 ± 985 1,220 ± 696 < 0.001
Volume of gas (ml) 1,474 ± 779 803 ± 515 < 0.001
Volume of tissue (ml) 466 ± 212 416 ± 190 < 0.001
ZEEP, zero end-expiratory pressure; PEEP, positive end-expiratory pressure of 15 cmH
2
O.
Figure 4
Relationship between ∆FRC and alveolar derecruitment measured by the P–V curve methodRelationship between ∆FRC and alveolar derecruitment measured by
the P–V curve method. ∆FRC, change in functional residual capacity;
PEEP, positive end-expiratory pressure
Critical Care Vol 10 No 3 Lu et al.
Page 8 of 10
(page number not for citation purposes)
potential interest, especially if coupled with the possibility of
measuring P–V curves [25].
Comparison of alveolar derecruitment measured by the
CT and P–V curve methods
When PEEP is applied to lungs whose loss of aeration is het-
erogeneously distributed, a part of the gas entering the respi-
ratory system penetrates into poorly aerated and nonaerated
lung regions, whereas another part (over)inflates previously
aerated ones. Only the gas penetrating into poorly aerated and
nonaerated lung regions can be considered as lung recruit-
ment. Quite often it represents a small part of PEEP-induced
increase in lung volume and (over)inflation largely predomi-
nates over recruitment [26]. The same reasoning can be
applied to alveolar derecruitment resulting from PEEP with-
drawal. In the present study, lung derecruitment represented
only one-third of total changes in gas volume. The other two-
thirds was due to gas volume loss in normally aerated lung
regions. This is the reason why the computed tomographic
method developed by Malbouisson and colleagues for meas-
uring PEEP-induced alveolar recruitment is based on a sepa-
rate analysis of the gas penetrating into poorly aerated and
nonaerated lung regions and into normally aerated lung areas
[18].
Proposed in the late 1990s [13,14,27], the P–V curve method
is based on the physiological concept that, at a given static air-
way pressure, any increase in gas volume after PEEP adminis-
tration is due to the reaeration of previously collapsed lung
units [9]. However, this hypothesis may be invalidated by the
heterogeneity and complexity of the reaeration process after
an increase in airway pressure. In most ARDS lungs, nonaer-
ated and normally aerated lung areas coexist at ZEEP. Previ-
ous CT data [18,26,28] demonstrated that alveolar
recruitment of nonaerated lung regions may be associated
with inflation and overinflation of previously normally aerated
lung areas. A recent CT study, performed during a P–V curve
maneuver, demonstrated that, during the inflation of the lungs,
alveolar recruitment occurs simultaneously with inflation and
overinflation of previously aerated lung regions [29]. One
essential question is whether the P–V curve method can dif-
ferentiate between recruitment and (over)inflation.
CT derecruitment resulting from PEEP withdrawal was signifi-
cantly and tightly correlated with the derecruitment measured
by the P–V curve method. There was also a weak, but statisti-
cally significant, correlation between lung derecruitment
measured by P–V curve and ∆FRC resulting from PEEP with-
drawal. However, the large limits of agreement between both
methods suggest that the P–V curve is not interchangeable
with the CT scan method. A recent electrical impedance tom-
Figure 5
CT sections and P–V curves in a patient with diffuse loss of lung aerationCT sections and P–V curves in a patient with diffuse loss of lung aeration. Image 1 shows a computed tomographic (CT) section representative of
the whole lung obtained at zeron end-exoiratory pressure (ZEEP). The dashed line delineates the poorly aerated and nonaerated lung areas, which
appear in light gray and red, respectively, on image 2 in accordance with a color-encoding system included in Lungview. Normally aerated lung areas
are not observed and the delineation corresponds to the lung parenchyma present on the CT section. Image 3 shows the same CT section obtained
at a positive end-expiratory pressure (PEEP) of 15 cmH
2
O. Image 4 shows the same CT section to which the color encoding has been applied, the
normally aerated areas appearing in dark gray. In this patient without any normally aerated lung areas at ZEEP, alveolar derecruitment computed by
the CT scan method is equal to the total decrease in functional residual capacity (∆FRC = 583 ml). Because both CT and the pressure-volume (P–
V curve) at ZEEP were acquired immediately after PEEP withdrawal, alveolar derecruitment is also equal to changes in end-expiratory lung volume
measured by pneumotachography (596 ml). The P–V curve method markedly underestimates PEEP-induced alveolar derecruitment measured by the
CT method.
Available online />Page 9 of 10
(page number not for citation purposes)
ography study has demonstrated that, during tidal inflation, the
normally aerated lung is expanded earlier than the consoli-
dated lung [30,31]. Our result confirms that the initial portion
of the P–V curve in ZEEP is essentially influenced by the infla-
tion of previously normally aerated lung regions. When the ini-
tial increase in lung volume measured at an airway pressure of
15 cmH
2
O on the P–V curve in ZEEP conditions consists
exclusively of the inflation of normally aerated lung areas, the
derecruitment resulting from PEEP withdrawal measured by
the CT and P–V curves is the same. However, if the initial
increase in lung volume measured at an airway pressure of 15
cmH
2
O on the P–V curve in ZEEP consists partly or exclu-
sively of reaeration of poorly aerated or nonaerated lung areas
(lung recruitment), then the derecruitment resulting from PEEP
withdrawal measured by P–V curves underestimates CT dere-
cruitment. Such a condition is illustrated by a patient in the
present study in whom CT alveolar derecruitment was under-
estimated by 69% by the P–V curve method. At ZEEP, the
patient had a bilateral and diffuse loss of aeration without any
normally aerated lung areas (Figure 5). Lung derecruitment
measured by CT immediately after PEEP withdrawal was
equal to ∆FRC and ∆EELV because each expired milliliter con-
tributed to an increase in poorly aerated and nonaerated lung
regions [5,32]. Therefore, discarding the lung volume corre-
sponding to an airway pressure of 15 cmH
2
O on the ZEEP P–
V curve leads to an underestimate of lung derecruitment.
Previous studies have suggested that measuring lung dere-
cruitment by the P–V curve method immediately after PEEP
withdrawal might result in an underestimate of overall lung
derecruitment by ignoring the additional derecruitment occur-
ring with time [10,33]. The present study provides convincing
evidence that time-dependent lung derecruitment can be cor-
rectly assessed by the P–V curve method at a single condition:
an accurate measurement of changes in FRC either by CT or
by the gas dilution technique. Again, the recent possibility
offered by recent ventilators of measuring FRC by the gas dilu-
tion technique and P–V curves by the low flow inflation tech-
nique offers an attractive opportunity of measuring lung
recruitment and derecruitment at the bedside.
In fact, the CT and P–V curve methods do not measure exactly
the same lung derecruitment. The CT method measures end-
expiratory lung derecruitment, whereas the P–V curve method
measures the difference in volume between the P–V curve in
PEEP and ZEEP conditions at a given elastic pressure. Ideally,
the validation of the P–V curve method by the CT method
should have implied the acquisition of CT sections not only in
PEEP conditions but also during an insufflation maneuver of
the P–V curve in ZEEP conditions at a pressure of 15 cmH
2
O.
End-inspiratory lung volume at this pressure should have been
subtracted from total changes in FRC resulting from PEEP
withdrawal. Unfortunately, CT technology does not permit the
acquisition of CT sections of the whole lung at a fixed inspira-
tory pressure during a quasi-static inflation maneuver. Another
confounding factor that might interfere with alveolar derecruit-
ment measured with the P–V curve method could be an alter-
ation of the chest wall elastance. It is also well known that
atelectasis of caudal and dependent lung regions resulting
from an increase in intra-abdominal pressure induces a right-
ward shift of the P–V curve [34]. Whether such a condition
influences the alveolar derecruitment computed from respira-
tory and P–V curve methods remains to be determined.
Conclusion
The present study demonstrates that lung derecruitment
derived from P–V curves is tightly correlated with lung dere-
cruitment measured by CT. As a result, it provides useful infor-
mation on PEEP-induced lung derecruitment at the bedside.
However, the P–V curve method measures a lung derecruit-
ment that is different from the CT lung derecruitment meas-
ured in true static end-expiratory conditions and can be
influenced by aeration changes occurring during the initial part
of the inflation P–V curve performed in ZEEP conditions.
Competing interests
The authors declare that they have no competing interests.
Authors' contributions
QL performed the study and drafted the manuscript. JMC and
AN participated in the study and in the study analysis. ME and
SV participated in the acquisition of the data for the study. JJR
participated in the design of the study and helped to draft the
manuscript. All authors read and approved the final
manuscript.
Acknowledgements
The authors acknowledge the following members who contributed to
this study: L Malbouisson, Department of Anesthesiology, Hospital das
Clínicas, Universidade de São Paulo, São Paulo, Brazil; J Richecoeur,
General ICU, Pontoise Hospital, Pontoise, France; Jean-Charles Muller
and L Puybasset, Neurosurgical ICU, Department of Anesthesiology,
Hôpital de la Pitié-Salpêtrière, Paris, France; P Grenier and P Cluzel,
Key messages
• Computed tomography is a gold standard for the
assessment of lung derecruitment in patients with acute
lung injury.
• The pressure–volume curve can measure lung dere-
cruitment at the bedside.
• Lung derecruitment resulting from posivite end-expira-
tory pressure measured by two methods is tightly corre-
lated, but the derecruited volume measured by the pres-
sure–volume curve has a large limits of agreement in
comparison with the average volume of the both
methods.
• The pressure–volume curve cannot replace the com-
puted tomography method.
Critical Care Vol 10 No 3 Lu et al.
Page 10 of 10
(page number not for citation purposes)
Department of Radiology, Hôpital de la Pitié-Salpêtrière, Paris, France;
and F Préteux and C Fetita, Institut National des Télécommunications,
Evry, France. ME was the recipient of a scholarship provided by the
French Ministry of Foreign Affairs (ref. 23344471), and SV was the
recipient of a postdoctoral award from (CAPES) of Brazil.
References
1. The Acute Respiratory Distress Syndrome Network: Ventilation
with lower tidal volumes as compared with traditional tidal vol-
umes for acute lung injury and the acute respiratory distress
syndrome. N Engl J Med 2000, 342:1301-1308.
2. Rouby JJ, Lu Q, Goldstein I: Selecting the right level of positive
end-expiratory pressure in patients with acute respiratory dis-
tress syndrome. Am J Respir Crit Care Med 2002,
165:1182-1186.
3. Brower RG, Lanken PN, MacIntyre N, Matthay MA, Morris A,
Ancukiewicz M, Schoenfeld D, Thompson BT: Higher versus
lower positive end-expiratory pressures in patients with the
acute respiratory distress syndrome. N Engl J Med 2004,
351:327-336.
4. Vieira SR, Nieszkowska A, Lu Q, Elman M, Sartorius A, Rouby JJ:
Low spatial resolution computed tomography underestimates
lung overinflation resulting from positive pressure ventilation.
Crit Care Med 2005, 33:741-749.
5. Rouby JJ, Lu Q, Vieira S: Pressure/volume curves and lung
computed tomography in acute respiratory distress
syndrome. Eur Respir J Suppl 2003, 42:27s-36s.
6. Rouby JJ, Constantin JM, Roberto De AGC, Zhang M, Lu Q:
Mechanical ventilation in patients with acute respiratory dis-
tress syndrome. Anesthesiology 2004, 101:228-234.
7. Rouby JJ, Puybasset L, Nieszkowska A, Lu Q: Acute respiratory
distress syndrome: lessons from computed tomography of
the whole lung. Crit Care Med 2003, 31:S285-S295.
8. Ranieri VM, Giuliani R, Fiore T, Dambrosio M, Milic-Emili J: Vol-
ume–pressure curve of the respiratory system predicts effects
of PEEP in ARDS: 'occlusion' versus 'constant flow' technique.
Am J Respir Crit Care Med 1994, 149:19-27.
9. Ranieri VM, Eissa NT, Corbeil C, Chasse M, Braidy J, Matar N,
Milic-Emili J: Effects of positive end-expiratory pressure on
alveolar recruitment and gas exchange in patients with the
adult respiratory distress syndrome. Am Rev Respir Dis 1991,
144:544-551.
10. Ranieri VM, Mascia L, Fiore T, Bruno F, Brienza A, Giuliani R: Car-
diorespiratory effects of positive end-expiratory pressure dur-
ing progressive tidal volume reduction (permissive
hypercapnia) in patients with acute respiratory distress
syndrome. Anesthesiology 1995, 83:710-720.
11. Mergoni M, Volpi A, Bricchi C, Rossi A: Lower inflection point
and recruitment with PEEP in ventilated patients with acute
respiratory failure. J Appl Physiol 2001, 91:441-450.
12. Lu Q, Vieira SR, Richecoeur J, Puybasset L, Kalfon P, Coriat P,
Rouby JJ: A simple automated method for measuring pres-
sure–volume curves during mechanical ventilation. Am J
Respir Crit Care Med 1999, 159:275-282.
13. Jonson B, Richard JC, Straus C, Mancebo J, Lemaire F, Brochard
L: Pressure–volume curves and compliance in acute lung
injury: evidence of recruitment above the lower inflection
point. Am J Respir Crit Care Med 1999, 159:1172-1178.
14. Richard JC, Maggiore SM, Jonson B, Mancebo J, Lemaire F, Bro-
chard L: Influence of tidal volume on alveolar recruitment.
Respective role of PEEP and a recruitment maneuver. Am J
Respir Crit Care Med 2001, 163:1609-1613.
15. Maggiore SM, Lellouche F, Pigeot J, Taille S, Deye N, Durrmeyer
X, Richard JC, Mancebo J, Lemaire F, Brochard L: Prevention of
endotracheal suctioning-induced alveolar derecruitment in
acute lung injury. Am J Respir Crit Care Med 2003,
167:1215-1224.
16. Richard JC, Brochard L, Vandelet P, Breton L, Maggiore SM, Jon-
son B, Clabault K, Leroy J, Bonmarchand G: Respective effects
of end-expiratory and end-inspiratory pressures on alveolar
recruitment in acute lung injury. Crit Care Med 2003, 31:89-92.
17. Grasso S, Fanelli V, Cafarelli A, Anaclerio R, Amabile M, Ancona
G, Fiore T: Effects of high versus low positive end-expiratory
pressures in acute respiratory distress syndrome. Am J Respir
Crit Care Med 2005, 171:1002-1008.
18. Malbouisson LM, Muller JC, Constantin JM, Lu Q, Puybasset L,
Rouby JJ: Computed tomography assessment of positive end-
expiratory pressure-induced alveolar recruitment in patients
with acute respiratory distress syndrome. Am J Respir Crit
Care Med 2001, 163:1444-1450.
19. Bernard GR, Artigas A, Brigham KL, Carlet J, Falke K, Hudson L,
Lamy M, Legall JR, Morris A, Spragg R: The American–European
Consensus Conference on ARDS. Definitions, mechanisms,
relevant outcomes, and clinical trial coordination. Am J Respir
Crit Care Med 1994, 149:818-824.
20. Rouby JJ, Puybasset L, Cluzel P, Richecoeur J, Lu Q, Grenier P:
Regional distribution of gas and tissue in acute respiratory
distress syndrome. II. Physiological correlations and definition
of an ARDS Severity Score. CT Scan ARDS Study Group. Inten-
sive Care Med 2000, 26:1046-1056.
21. Puybasset L, Cluzel P, Gusman P, Grenier P, Preteux F, Rouby J-J,
CT scan ARDS Study Group: Regional distribution of gas and
tissue in acute respiratory distress syndrome. I. Conse-
quences for lung morphology. Intensive Care Med 2000,
26:857-869.
22. Venegas JG, Harris RS, Simon BA: A comprehensive equation
for the pulmonary pressure–volume curve. J Appl Physiol
1998, 84:389-395.
23. Bland JM, Altman DG: Statistical methods for assessing agree-
ment between two methods of clinical measurement. Lancet
1986, 1:307-310.
24. Murray JF, Matthay MA, Luce JM, Flick MR: An expanded defini-
tion of the adult respiratory distress syndrome. Am Rev Respir
Dis 1988, 138:720-723.
25. Olegard C, Sondergaard S, Houltz E, Lundin S, Stenqvist O: Esti-
mation of functional residual capacity at the bedside using
standard monitoring equipment: a modified nitrogen wash-
out/washin technique requiring a small change of the inspired
oxygen fraction. Anesth Analg 2005, 101:206-212.
26. Nieszkowska A, Lu Q, Vieira S, Elman M, Fetita C, Rouby JJ: Inci-
dence and regional distribution of lung overinflation during
mechanical ventilation with positive end-expiratory pressure.
Crit Care Med 2004, 32:1496-1503.
27. Maggiore SM, Jonson B, Richard JC, Jaber S, Lemaire F, Brochard
L: Alveolar derecruitment at decremental positive end-expira-
tory pressure levels in acute lung injury. Comparison with the
lower inflection point, oxygenation, and compliance. Am J
Respir Crit Care Med 2001, 164:795-801.
28. Puybasset L, Muller JC, Cluzel P, Coriat P, Rouby JJ, Group CSAs:
Regional distribution of gas and tissue in acute respiratory
distress syndrome. III. Consequences for the effects of posi-
tive end-expiratory pressure. Intensive Care Med 2000,
26:1215-1227.
29. Albaiceta GM, Taboada F, Parra D, Luyando LH, Calvo J, Menen-
dez R, Otero J: Tomographic study of the inflection points of
the pressure–volume curve in acute lung injury. Am J Respir
Crit Care Med 2004, 170:1066-1072.
30. Frerichs I, Dargaville PA, Dudykevych T, Rimensberger PC: Elec-
trical impedance tomography: a method for monitoring
regional lung aeration and tidal volume distribution? Intensive
Care Med 2003, 29:2312-2316.
31. van Genderingen HR, van Vught AJ, Jansen JR: Estimation of
regional lung volume changes by electrical impedance pres-
sures tomography during a pressure–volume maneuver.
Intensive Care Med 2003, 29:233-240.
32. Hickling KG: The pressure–volume curve is greatly modified by
recruitment. A mathematical model of ARDS lungs. Am J
Respir Crit Care Med 1998, 158:194-202.
33. Grasso S, Mascia L, Del Turco M, Malacarne P, Giunta F, Brochard
L, Slutsky AS, Marco Ranieri V: Effects of recruiting maneuvers
in patients with acute respiratory distress syndrome ventilated
with protective ventilatory strategy. Anesthesiology 2002,
96:795-802.
34. Ranieri VM, Brienza N, Santostasi S, Puntillo F, Mascia L, Vitale N,
Giuliani R, Memeo V, Bruno F, Fiore T, et al.: Impairment of lung
and chest wall mechanics in patients with acute respiratory
distress syndrome: role of abdominal distension. Am J Respir
Crit Care Med 1997, 156:1082-1091.