Báo cáo y học: "Effect of bladder volume on measured intravesical pressure: a prospective cohort study" ppt
Bạn đang xem bản rút gọn của tài liệu. Xem và tải ngay bản đầy đủ của tài liệu tại đây (254.05 KB, 6 trang )
Open Access
Available online />Page 1 of 6
(page number not for citation purposes)
Vol 10 No 4
Research
Effect of bladder volume on measured intravesical pressure: a
prospective cohort study
Manu LNG Malbrain
1
and Dries H Deeren
2
1
Intensive Care Unit, Ziekenhuisnetwerk Antwerpen Campus Stuivenberg, Lange Beeldekensstraat, B-2060 Antwerp, Belgium
2
Department of Internal Medicine and Intensive Care Medicine, Ziekenhuisnetwerk Antwerpen Campus Stuivenberg, Lange Beeldekensstraat, B-
2060 Antwerp, Belgium
Corresponding author: Manu LNG Malbrain,
Received: 20 Feb 2006 Revisions requested: 13 Mar 2006 Revisions received: 30 Apr 2006 Accepted: 7 Jun 2006 Published: 6 July 2006
Critical Care 2006, 10:R98 (doi:10.1186/cc4962)
This article is online at: />© 2006 Malbrain and Deeren; licensee BioMed Central Ltd.
This is an open access article distributed under the terms of the Creative Commons Attribution License ( />),
which permits unrestricted use, distribution, and reproduction in any medium, provided the original work is properly cited.
Abstract
Introduction Correct bedside measurement of intra-abdominal
pressure (IAP) is important. The bladder method is considered
as the gold standard for indirect IAP measurement, but the
instillation volumes reported in the literature vary substantially.
The aim of this study was to evaluate the effect of instillation
volume on intra-bladder pressure (IBP) as an estimation for IAP
in critically ill patients.
Methods In this prospective cohort study in 13 sedated and
mechanically ventilated patients, we used a revised closed
system repeated measurement technique for measurement of
IBP. After the system was flushed, IBP was measured with 25
ml increments up to 300 ml. The absolute bias for each volume
was calculated as IBP at a given volume minus IBP at zero
volume.
Results In total, 30 measurement sets were performed (mean
2.3 per patient). The median IBP at 25 ml was already
significantly higher than IBP at zero volume (7.5 versus 6
mmHg). There was no correlation between IBP at zero volume
and absolute IBP bias at any bladder volume. Median absolute
IBP bias was 1.5 mmHg at 50 ml; 2.5 mmHg at 100 ml; 5.5
mmHg at 150 ml; and up to 11 mmHg at 300 ml.
Conclusion Larger instillation volumes than the usually
recommended 50 ml to estimate IAP by bladder pressure may
cause clinically relevant overestimation of IAP. Small volumes to
a maximum of 25 ml, enough to create a fluid column and to
remove air, may be sufficient.
Introduction
The occurrence of intra-abdominal hypertension (IAH) during
intensive care unit (ICU) stay is an independent predictor for
mortality [1-3] and IAH may cause injury to various organs [4].
Recently, we found that increases in intra-abdominal pressure
(IAP), even at low levels, are associated with increases in
intracranial pressure and decreases in cerebral perfusion
pressure in patients with non-traumatic brain injury [5]. Correct
bedside measurement of IAP is important because it allows
the ICU physician to evaluate the effect of surgical or non-sur-
gical decompression on IAP. Furthermore, IAP is a physiolog-
ical parameter that may guide interventions to improve the
haemodynamic or respiratory status [4,6].
The World Society on Abdominal Compartment Syndrome
(WSACS) [7] stated that until other methods are validated, the
bladder method is considered as the gold standard for indirect
IAP measurement (the gold standard for direct measurement
being intraperitoneal pressure measurement) [4,7]. However,
the instillation volumes reported in the literature for bladder
pressure measurement are not uniform and range from 50 up
to 300 ml [8,9]. Instillation of large volumes may raise the
intrinsic bladder pressure and cause overestimation of IAP.
The aim of this study was to evaluate the effect of instillation
volume on intra-bladder pressure (IBP) as an estimation for
IAP in critically ill patients. Parts of this study were presented
at the 16th Annual congress of the European Society of Inten-
sive Care Medicine in Amsterdam, The Netherlands (6 to 8
October 2003) [10].
ACS = abdominal compartment syndrome; IAH = intra-abdominal hypertension; IAP = intra-abdominal pressure; IBP = intra-bladder pressure; ICU
= intensive care unit; PV = pressure volume; WSACS = World Society on Abdominal Compartment Syndrome.
Critical Care Vol 10 No 4 Malbrain and Deeren
Page 2 of 6
(page number not for citation purposes)
Materials and methods
Study design, setting and participants
We performed a prospective cohort study at the 12 bed med-
ical ICU of the Stuivenberg hospital. The study was conducted
in accordance with the study protocol, the Declaration of Hel-
sinki and applicable regulatory requirements. The local Institu-
tional Review Board and Ethics Committee approved the
protocol. In view of the nature of the study, which did not
demand a deviation from standard clinical ICU care, informed
consent from the patient or the next of kin was not essential.
All sedated and ventilated patients in whom bladder pressure
was measured to estimate IAP were eligible for the study.
Patients were excluded if they had bladder injury or if they
were haemodynamically or respiratorally unstable. IAH and
abdominal compartment syndrome (ACS) were defined
according to the WSACS suggested consensus definitions
on their website [7].
Study protocol and materials
We used the revised closed system repeated measurement
technique for measurement of bladder pressure [8]. In this
technique, a ramp with three stopcocks is inserted in the drain-
age tubing connected to a Foley catheter. A standard infusion
set is connected to a bag of 1,000 ml of saline and attached
to the first stopcock. A 60 ml syringe is connected to the sec-
ond stopcock and the third stopcock is connected to a pres-
sure transducer via rigid tubing. The system is flushed with
saline to remove air, and the pressure transducer is zeroed at
the symphysis pubis. To measure IBP, the bladder is com-
pletely emptied and the urinary drainage tubing is clamped dis-
Table 1
Mean intra-bladder pressure, expressed in mmHg at different bladder instillation volumes, per individual patient obtained during
bladder filling
Patient Bladder Instillation Volume
0 ml 25 ml 50 ml 75 ml 100 ml 125 ml 150 ml 175 ml 200 ml 225 ml 250 ml 275 ml 300 ml
1 7 7.5 8.5 8.8 9.8 10 11 11.5 12 13 13.5 14 15.5
2 7 7.5 8 9 9 9.5 10 10.5 11 11.5 12.5 13 14
3 6 9.3 13 14.7 16 19.3 22.3 25.3 28.3 32.3 37.3 42 48
4 0.5 1.5 2.5 4.5 4.5 6 8.5 12 13.5 15 17 22 27
5 4 4 5.3 5.7 6 7.7 9.7 9.7 10 11 11.7 12.7 13.7
6 00.51.52.533.545677911
7 12.7 13.3 13.7 14 14.7 15.3 16.3 17 17.7 18.7 19.7 21 23.3
8 6677888.59.51011121415
9 6 6.5 7.5 7.5 8.5 9.5 11.5 13 15 18 21.5 25 29.5
10 12 12 13 13 13.5 15 17.5 20.5 23.5 27 31 35 39.5
11 4 6 6.7 7 8 8.7 10.3 11 12.3 13.7 15.7 17.3 21.3
12 8.5 8.5 9.5 9.5 10 10.5 11.5 12 13 13.5 15 16.5 18.5
13 6.5 7.5 8 9 10 11 12 13 15.5 17.5 20.5 23 26.5
Mean 6.2 6.9 8 8.6 9.3 10.3 11.8 13.1 14.4 16.1 18 20.3 23.3
Median 6 7.5 8 8.8 9 9.5 11 12 13 13.7 15.7 17.3 21.3
Table 2
Incidence of intra-abdominal hypertension and abdominal compartment syndrome related to different instillation volumes for IAP
estimation
Bladder Instillation Volume
300 ml 275 ml 250 ml 225 ml 200 ml 175 ml 150 ml 125 ml 100 ml 75 ml 50 ml 25 ml 0 ml
IAH 92.3% 92.3% 84.6% 69.2% 69.2% 53.8% 30.8% 23.1% 23.1% 23.1% 23.1% 15.4% 15.4%
ACS 53.8% 46.2% 30.8% 15.4% 15.4% 15.4% 7.7% 0.0% 0.0% 0.0% 0.0% 0.0% 0.0%
The percentages were calculated using the WSACS suggested thresholds and definitions [7] and were based on the mean intra-abdominal
pressure (IAP) values obtained in each patient.
Available online />Page 3 of 6
(page number not for citation purposes)
tal to the ramp-device. The desired amount of saline is
aspirated from the bag into the syringe and then instilled in the
bladder. After opening the stopcocks to the pressure trans-
ducer, the IBP can be read from the bedside monitor. To con-
firm correct measurement, a rapid flush test, inspection of
respiratory pressure variations and an oscillation test were
performed before every measurement.
After the system was flushed, baseline IBP was measured
without instilling extra volume. Then, IBP measurements were
performed with 25 ml increments up to 300 ml and with 25 ml
decrements until baseline. Each instillation was followed by a
one minute equilibration period. The IBP was read as an inte-
ger value recorded at end-expiration. All IBP values were trans-
duced to the same mark and type of bedside monitor
(Spacelabs, Issaquah, Washington, USA). Each patient
underwent repeated measurement series. All measurements
were performed by the same observer to limit interobserver
variability. Mean values were used for statistical analysis.
Analysis
For each bladder volume in each patient, mean IBP was
recorded and absolute bias was calculated. The absolute bias
for each volume was calculated as IBP at a given volume
minus IBP at zero volume. Although only the absolute bias is
clinically relevant in IAP estimation, the relative bladder pres-
sure bias was also calculated. The relative bias for each vol-
ume was calculated as the IBP at a given volume minus IBP at
zero volume divided by IBP at zero volume and expressed as a
percentage. We used the Shapiro-Wilk W test to test for nor-
mality, weighted correlation (because of repeated measure-
ments) to test for correlation between IBP at zero volume and
absolute bladder pressure bias, and the Wilcoxon matched
pairs signed rank sum test to test for differences between IBP
at different bladder volumes. Pearson correlation coefficient
and Bland and Altman analysis was used to compare IBP at
zero and 50 ml of priming volume.
Results
Patients
We studied 13 intubated and mechanically ventilated patients
(eight women, five men). Mean age was 69.2 ± 13.5 years,
mean body mass index was 24.5 ± 3.9, mean simplified acute
physiology (SAPS II) score was 60.4 ± 13.2, mean sequential
organ failure assessment (SOFA) score was 9.6 ± 3.5 and
mean acute physiology and chronic health evaluation
(APACHE-II) score was 27.8 ± 9.8. In total, 30 measurement
series were performed. The number of measurements in each
patient was 2.3 ± 0.5 (range 2 to 3).
Bladder pressures
Mean bladder pressures at different bladder instillation vol-
umes are summarized in Table 1. The IBP at 25 ml was already
significantly higher than IBP at zero volume (p = 0.007 for 25
ml; p = 0.001 for 50 ml; and p < 0.0001 for all other compar-
isons). Hence, in each patient, bladder pressure volume (PV)
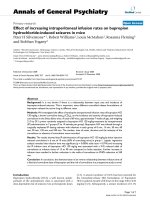
Figure 1
Example of two bladder pressure volume (PV) curvesExample of two bladder pressure volume (PV) curves. Curve A (black
circles) shows the bladder PV curve in a patient with a normal bladder
compliance: baseline intra-bladder pressure (IBP; at empty bladder)
was 3 mmHg; bladder compliance was 38.3 ml/cm H
2
O (∆V/∆P1).
Curve B (grey squares) shows the bladder PV curve in another patient
with a low bladder compliance: baseline IBP (at empty bladder) was 10
mmHg; bladder compliance was 10.2 ml/cm H
2
O (∆V/∆P2). The PV
curves are shown with the inflation/filling limb (right hand side) and the
deflation/emptying limb (left hand side).
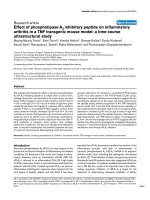
Figure 2
Curve fit of the mean intra-bladder pressures (IBPs) on the X-axis ver-sus the instilled bladder volume (Y-axis) from all patientsCurve fit of the mean intra-bladder pressures (IBPs) on the X-axis ver-
sus the instilled bladder volume (Y-axis) from all patients. The 'inflation'
(right-hand side) and 'deflation' (left hand side) pressure volume (PV)
curve is plotted as a curve fit of the means of the 30 measurements.
Hysteresis can be seen, as with respiratory PV curves. No clear lower
inflection point can be identified; via extrapolation, an upper inflection
point was found at a bladder volume of 150 ml to 175 ml on the infla-
tion limb. Error bars show 95% confidence intervals.
Critical Care Vol 10 No 4 Malbrain and Deeren
Page 4 of 6
(page number not for citation purposes)
curves could be obtained, illustrating the relative bladder com-
pliance at that moment (Figure 1). The PV curve fit of the mean
showed a linear increase in IBP with ongoing filling, without a
clear inflection point (Figure 2).
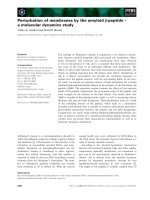
There was no correlation between IBP at zero volume (base-
line) and absolute IBP bias at any bladder volume (Pearson's
correlation coefficient -0.036 to -0.290; p > 0.05). These data
are shown in the pressure-volume boxplots in Figure 3. The
observed data of absolute bias for each bladder volume were
not normally distributed (Shapiro-Wilk W statistic 0.550 to
0.849; p < 0.05). Therefore, the median values of absolute IBP
bias are more representative than the mean values. Median
absolute IBP bias was 1.5 mmHg at 50 ml; 2.5 mmHg at 100
ml; 5.5 mmHg at 150 ml; and up to 11 mmHg at 300 ml.
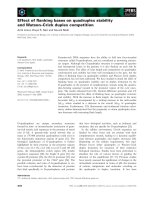
The relative bladder pressure bias could only be calculated for
11 patients (since the IBP at zero volume was close to zero
mmHg in 2 patients, leading to an excessively high relative
bias). Figure 4 shows the relative bias related to the different
instillation volumes. There was no correlation between base-
line IBP and relative bladder pressure bias at any volume.
Pearson correlation between IBP obtained at zero and 50 ml
of priming fluid was good with an R2 of 0.8; however, the anal-
ysis according to Bland and Altman showed a mean bias of
1.5 ± 1.8 mmHg, with large limits of agreement (from -2.1 to
5.1 mmHg).
Discussion
The main result of our study is that large instillation volumes
are associated with higher IBP. This may cause overestimation
of IAP. The increase in IBP was already statistically significant
at the smallest instillation volume (25 ml), but only became
clinically relevant at a volume of 75 ml for most of the patients.
For one patient, however, the PV curve was flattened and
shifted to the right, with overestimation being obvious even at
the smallest instillation volumes (Figure 1).
There are two explanations for the rise in IBP after instillation
of large volumes. First, the bladder wall is not merely a mem-
brane that transfers pressure from the intra-abdominal space
to the bladder content. Bladder wall compliance differs
between patients and depends on several factors like age,
BMI, filling status and bladder perfusion/ischemia [11]. Sec-
ond, IAP reflects the relationship between the intra-abdominal
volume and abdominal compliance. In the physiological range,
small volume increases do not cause substantial IAP increases
until a point of decompensation, after which each small
increase in volume results in a relatively large increase in IAP.
If injury causes an enlargement of one of the intra-abdominal
contents, abdominal compliance can be reduced. In that situ-
ation, it is possible that instillation of a large amount of fluid in
the bladder leads to an iatrogenic IAP increase. We did not,
however, find a correlation between IBP at zero volume and
absolute or relative IBP bias.
Figure 3
Boxplot of absolute bladder pressure bias (Y-axis, mmHg) against instilled bladder volume (X-axis)Boxplot of absolute bladder pressure bias (Y-axis, mmHg) against
instilled bladder volume (X-axis). The absolute bias for each volume
was calculated as intra-bladder pressure (IBP) at a given volume minus
IBP at zero volume. Each box shows the median values and quartiles
for absolute bladder pressure bias. Outliers (cases with values
between 1.5 and three box lengths from the upper or lower edge of the
box) are denoted with circles. Extreme cases (cases with values more
than three box lengths from the upper or lower edge of the box) are
denoted with asterisks. For both outliers and extreme cases, the patient
number is shown above the symbol.
Figure 4
Bar graph of relative bladder pressure bias (Y-axis, %) against instilled bladder volume (X-axis, ml)Bar graph of relative bladder pressure bias (Y-axis, %) against instilled
bladder volume (X-axis, ml). The relative bias for each volume was cal-
culated as the intra-bladder pressure (IBP) at a given volume minus IBP
at zero volume divided by IBP at zero volume and expressed as a per-
centage. Each bar shows the mean value with error bar (standard devi-
ation) for relative bladder pressure bias at different instillation volumes.
Available online />Page 5 of 6
(page number not for citation purposes)
Our results agree with the data of Fusco and colleagues [12]
who compared direct IAP measurements during laparoscopy
with IBPs. IBPs at larger instillation volumes were systemati-
cally higher than at smaller volumes, and 'average bias' was
lowest at the minimal instillation volume ('average bias' =
directly measured IAP minus IBP = -0.79 mmHg). Instillation
of 50 ml saline resulted in an 'average bias' of -3.7 mmHg.
However, calculation of correlation between direct IAP and
IBP was jeopardized by two factors. First, IAP was adjusted to
a specific value by abdominal insufflation after, but not before,
each bladder instillation. This means that iatrogenic IAP
increases by bladder instillation were masked. Second, corre-
lation was calculated with Pearson correlation coefficients for
the entire 222 data set without accounting for the fact that
there were only 37 patients, indicating that on average 6
repeated measurements were performed in each patient.
The clinical implications of our results are that instillation of a
large volume for IAP estimation may lead to IAP overestimation
and misdiagnosis of IAH or ACS (Table 2). This may lead to
unnecessary and even harmful interventions, underdiagnosis
of other pathology and prolonged ICU stay. In the absence of
strong data that demonstrate a better correlation of directly
measured IAP with IBP at one specific volume, we suggest to
measure IBP after priming the system with a small amount of
saline (maximum 25 ml), enough to create a fluid column and
to remove air. Our results are in accordance with those
observed by De Waele and colleagues [13], who also sug-
gested recently that priming the bladder with 10 ml of saline
may be sufficient for estimation of IAP. In their paper, the per-
centage difference (or relative bias) for IAP50 (IAP obtained
after instaillation of 50 ml) and IAP100 (IAP obtained after
installation of 100 ml for each patient was calculated as:
(IAP50 or IAP100 - IAPminimum)/IAPminimum. They found
that the mean percentage difference was 21% for IAP50 and
40% for IAP100. This is in accordance with our findings, with
a relative bias defined as (IAP50 or IAP100 - IAP0)/IAP0 of
31.4% and 50.8% at instillation volumes of 50 and 100 ml,
respectively (Figure 4). However, it is difficult to compare our
data further since our mean IAP0 was only 6.6 mmHg com-
pared to 12.8 mmHg in the study by De Waele and col-
leagues. Also, their incidence of IAH was 60%, 75% and 85%
at instillation volumes of 10, 50 and 100 ml, respectively, ver-
sus 7.1%, 23.1% and 23.1% in our study. Also in the study by
De Waele and colleagues, only one set of measurements was
performed per patient.
Our study has limitations. The number of patients studied was
relatively small. We only compared IBPs with each other and
not with directly measured IAP. The ideal study, that is, a com-
parison between direct measured IAP and IBP at different
priming volumes, should include a Bland-Altman analysis as
recommended by the WSACS. Furthermore, our results are
only applicable to our observed values of IAP. Also as pointed
out by De Waele and colleagues, the temperature, rate of infu-
sion or volume of the instillate may also cause increased detru-
sor tone. This might be resolved by using aslow infusion of
saline at body temperature. Another limitation may be that the
bladder needs more time (longer than the one minute we used
in this study) to adapt, and that an IAP recording should only
be done minutes after instilling saline into the bladder.
Conclusion
Large instillation volumes of 75 ml or more to estimate IAP by
IBP may cause clinically relevant overestimation of IAP and
hence a false increase in the prevalence and incidence of IAH
and ACS. Bladder compliance varies within and between
patients. Small volumes to a maximum of 25 ml, enough to cre-
ate a fluid column and to remove air, should be used.
Competing interests
MM is a member of the medical advisory board of Pulsion
Medical Systems. MM is the founding president of the
WSACS.
Authors' contributions
MM conceived of the study and its design, participated in the
data collection, helped to draft the manuscript and made the
final review. DD participated in the data collection, performed
the statistical analysis and drafted the manuscript.
Acknowledgements
MM is the founding President of the WSACS.
References
1. Malbrain ML, Chiumello D, Pelosi P, Bihari D, Innes R, Ranieri VM,
Del Turco M, Wilmer A, Brienza N, Malcangi V, et al.: Incidence
and prognosis of intraabdominal hypertension in a mixed pop-
ulation of critically ill patients: a multiple-center epidemiologi-
cal study. Crit Care Med 2005, 33:315-322.
2. Balogh Z, McKinley BA, Holcomb JB, Miller CC, Cocanour CS,
Kozar RA, Valdivia A, Ware DN, Moore FA: Both primary and sec-
ondary abdominal compartment syndrome can be predicted
early and are harbingers of multiple organ failure. J Trauma
2003, 54:848-859. discussion 859–861.
3. Biancofiore G, Bindi ML, Romanelli AM, Boldrini A, Consani G,
Bisa M, Filipponi F, Vagelli A, Mosca F: Intra-abdominal pressure
Key messages
• Instilling over 50 ml of saline into the bladder may over-
estimate actual IAP
• Instilling over 50 ml may falsely increase the prevalence
and incidence of IAH and ACS
• 25 ml may be enough to prime the bladder for estima-
tion of IAP
• Bladder compliance varies between and within ICU
patients
• A uniform, standardised, accurate and reproducible IAP
measurement method is needed for multiple centre
study purposes
Critical Care Vol 10 No 4 Malbrain and Deeren
Page 6 of 6
(page number not for citation purposes)
monitoring in liver transplant recipients: a prospective study.
Intensive Care Med 2003, 29:30-36.
4. Malbrain ML, Deeren D, De Potter TJ: Intra-abdominal hyperten-
sion in the critically ill: it is time to pay attention. Curr Opin Crit
Care 2005, 11:156-171.
5. Deeren D, Dits H, Malbrain MLNG: Correlation between intra-
abdominal and intracranial pressure in nontraumatic brain
injury. Intensive Care Med 2005, 31:1577-1581.
6. Gattinoni L, Chiumello D, Carlesso E, Valenza F: Bench-to-bed-
side review: chest wall elastance in acute lung injury/acute
respiratory distress syndrome patients. Crit Care 2004,
8:350-355.
7. WSACS EC: World Society on Abdominal Compartment
Syndrome. [
].
8. Malbrain ML: Different techniques to measure intra-abdominal
pressure (IAP): time for a critical re-appraisal. Intensive Care
Med 2004, 30:357-371.
9. Malbrain M, Jones F: Intra-abdominal pressure measurement
techniques. In Abdominal Compartment Syndrome Edited by:
Ivatury R, Cheatham M, Malbrain M, Sugrue M. Georgetown,
Texas, USA: Landes Bioscience; 2006:19-68.
10. Malbrain MLNG, Deeren D, Darquennes K, Van Mieghem N, Ver-
brugghe W, Daelemans R, Lins R: Estimating optimal bladder
volume for intra-abdominal pressure measurement by bladder
PV-curves. Intensive Care Med 2003, 29(Suppl 1):abstract 560.
11. Kershen RT, Azadzoi KM, Siroky MB: Blood flow, pressure and
compliance in the male human bladder. J Urol 2002,
168:121-125.
12. Fusco MA, Martin RS, Chang MC: Estimation of intra-abdominal
pressure by bladder pressure measurement: validity and
methodology. J Trauma 2001, 50:297-302.
13. De Waele J, Pletinckx P, Blot S, Hoste E: Saline volume in trans-
vesical intra-abdominal pressure measurement: enough is
enough. Intensive Care Med 2006, 32:455-459.
![Báo cáo Y học: Effect of adenosine 5¢-[b,c-imido]triphosphate on myosin head domain movements Saturation transfer EPR measurements without low-power phase setting ppt](https://media.store123doc.com/images/document/14/rc/vd/medium_vdd1395606111.jpg)