Báo cáo y học: "Effect of a lung recruitment maneuver by high-frequency oscillatory ventilation in experimental acute lung injury on organ blood flow in pigs" ppsx
Bạn đang xem bản rút gọn của tài liệu. Xem và tải ngay bản đầy đủ của tài liệu tại đây (399.15 KB, 10 trang )
Open Access
Available online />Page 1 of 10
(page number not for citation purposes)
Vol 10 No 4
Research
Effect of a lung recruitment maneuver by high-frequency
oscillatory ventilation in experimental acute lung injury on organ
blood flow in pigs
Matthias David
1
, Hendrik W Gervais
1
, Jens Karmrodt
1
, Arno L Depta
1
, Oliver Kempski
2
and
Klaus Markstaller
1
1
Department of Anesthesiology, Johannes Gutenberg-University, Mainz, Germany
2
Institute of Neurosurgical Pathophysiology, Johannes Gutenberg-University, Mainz, Germany
Corresponding author: Matthias David,
Received: 28 Mar 2006 Revisions requested: 21 Apr 2006 Revisions received: 11 May 2006 Accepted: 19 Jun 2006 Published: 12 Jul 2006
Critical Care 2006, 10:R100 (doi:10.1186/cc4967)
This article is online at: />© 2006 David et al; licensee BioMed Central Ltd.
This is an open access article distributed under the terms of the Creative Commons Attribution License ( />),
which permits unrestricted use, distribution, and reproduction in any medium, provided the original work is properly cited.
Abstract
Introduction The objective was to study the effects of a lung
recruitment procedure by stepwise increases of mean airway
pressure upon organ blood flow and hemodynamics during
high-frequency oscillatory ventilation (HFOV) versus pressure-
controlled ventilation (PCV) in experimental lung injury.
Methods Lung damage was induced by repeated lung lavages
in seven anesthetized pigs (23–26 kg). In randomized order,
HFOV and PCV were performed with a fixed sequence of mean
airway pressure increases (20, 25, and 30 mbar every 30
minutes). The transpulmonary pressure, systemic
hemodynamics, intracranial pressure, cerebral perfusion
pressure, organ blood flow (fluorescent microspheres), arterial
and mixed venous blood gases, and calculated pulmonary shunt
were determined at each mean airway pressure setting.
Results The transpulmonary pressure increased during lung
recruitment (HFOV, from 15 ± 3 mbar to 22 ± 2 mbar, P < 0.05;
PCV, from 15 ± 3 mbar to 23 ± 2 mbar, P < 0.05), and high
airway pressures resulted in elevated left ventricular end-
diastolic pressure (HFOV, from 3 ± 1 mmHg to 6 ± 3 mmHg, P
< 0.05; PCV, from 2 ± 1 mmHg to 7 ± 3 mmHg, P < 0.05),
pulmonary artery occlusion pressure (HFOV, from 12 ± 2 mmHg
to 16 ± 2 mmHg, P < 0.05; PCV, from 13 ± 2 mmHg to 15 ± 2
mmHg, P < 0.05), and intracranial pressure (HFOV, from 14 ±
2 mmHg to 16 ± 2 mmHg, P < 0.05; PCV, from 15 ± 3 mmHg
to 17 ± 2 mmHg, P < 0.05). Simultaneously, the mean arterial
pressure (HFOV, from 89 ± 7 mmHg to 79 ± 9 mmHg, P <
0.05; PCV, from 91 ± 8 mmHg to 81 ± 8 mmHg, P < 0.05),
cardiac output (HFOV, from 3.9 ± 0.4 l/minute to 3.5 ± 0.3 l/
minute, P < 0.05; PCV, from 3.8 ± 0.6 l/minute to 3.4 ± 0.3 l/
minute, P < 0.05), and stroke volume (HFOV, from 32 ± 7 ml to
28 ± 5 ml, P < 0.05; PCV, from 31 ± 2 ml to 26 ± 4 ml, P <
0.05) decreased. Blood flows to the heart, brain, kidneys and
jejunum were maintained. Oxygenation improved and the
pulmonary shunt fraction decreased below 10% (HFOV, P <
0.05; PCV, P < 0.05). We detected no differences between
HFOV and PCV at comparable transpulmonary pressures.
Conclusion A typical recruitment procedure at the initiation of
HFOV improved oxygenation but also decreased systemic
hemodynamics at high transpulmonary pressures when no
changes of vasoactive drugs and fluid management were
performed. Blood flow to the organs was not affected during
lung recruitment. These effects were independent of the
ventilator mode applied.
Introduction
High-frequency oscillatory ventilation (HFOV) is a pressure-
controlled, time-cycled method of mechanical ventilation in
which a continuous distending pressure (CDP) expands the
lung and superimposed pressure oscillations at high frequen-
cies (4–15 Hz) from a coupled oscillator swing around the
CDP = continuous distending pressure; CO = cardiac output; FiO
2
= inspiratory oxygen fraction; HFOV = high-frequency oscillatory ventilation;
PaCO
2
= arterial partial pressure of carbon dioxide; PaO
2
= arterial partial pressure of oxygen; PCV = pressure-controlled ventilation; PEEP = positive
end-expiratory pressure; P
mean
= mean airway pressure; P
T
= transpulmonary pressure; Q
s
/Q
t
= pulmonary shunt; RR = respiratory rate.
Critical Care Vol 10 No 4 David et al.
Page 2 of 10
(page number not for citation purposes)
applied CDP. The pressure swings are significantly attenuated
by the endotracheal tube and the respiratory system before
reaching the alveolar level. The tidal volumes and pressure
amplitudes at the alveolar level are therefore minimal. Active
expiration by the superimposed pressure swings prevents air
trapping [1]. HFOV theoretically has advantages such as the
minimal applied tidal volumes at the alveolar level, avoiding
volutrauma from tidal overdistension, whereas a constant high
mean airway pressure (P
mean
) leads to lung recruitment over
time [2].
A potential drawback to HFOV is the fact that spontaneous
respiratory efforts must be suppressed. When similar P
mean
settings by HFOV or conventional ventilation are used, how-
ever, the amplitude of pressure and volume excursions is sub-
stantially different between both ventilatory modes. Despite
the same arithmetic P
mean
, alveolar excursions occur around a
greater gradient of pressures and volumes during conven-
tional ventilation. It is well known that high airway pressures
may lead to detrimental hemodynamic effects, mainly depend-
ent on respiratory mechanics and the capacity of cardiovascu-
lar compensation [3,4]. Inspiratory lung inflation can alter the
autonomic tone, pulmonary vascular resistance, ventricular fill-
ing by reduced venous return, and at high lung volumes, it
interacts mechanically with the heart in the cardiac fossa to
limit absolute cardiac volumes [3,4].
Current practice at the initiation of HFOV involves lung recruit-
ment maneuvers, typically performed by increases of CDP in
steps of 2–5 mbar up to 40 mbar [5-8]. Although increases of
the CDP may improve oxygenation and gas exchange, the
effects of high CDP and nearly constant lung volumes during
HFOV upon organ blood flow have not been evaluated. The
hemodynamics, transpulmonary pressure (P
T
), and organ
blood flows were therefore measured in pigs with acute
injured lungs during a sequence of similar P
mean
increases by
HFOV and by conventional pressure-controlled ventilation
(PCV). The primary objective of this study was to asses
whether a recruitment procedure of the lung, at initiation of
HFOV by stepwise increases of continuous distending pres-
sures, impairs the hemodynamics and organ blood flow in
lung-injured animals. Secondarily, we determined whether
these effects are more pronounced during HFOV when com-
pared with similar P
mean
settings in PCV.
Materials and methods
Animals and instrumentation
The study protocol was approved by the institutional and state
animal care committee. Seven pigs (mean body weight, 26 kg;
range, 23–27 kg) were anesthetized with fentanyl 0.005 mg/
kg and thiopentone 10–15 mg/kg intravenously, followed by a
continuous infusion of fentanyl (5 µg/kg/hour) and thiopentone
(10 mg/kg/hour). Neuromuscular blockade was achieved with
repeated intravenous bolus of pancuronium bromide (0.1 mg/
kg). An adequate level of anesthesia was monitored clinically
by observation of the heart rate and the blood pressure.
The trachea was intubated and the lung was mechanically ven-
tilated via an endotracheal tube (inner diameter, 8.0 mm) in
constant-volume mode (AVEA Ventilator; VIASYS Healthcare,
Palm Springs, CA, USA): FiO
2
of 0.4; positive end-expiratory
pressure (PEEP) of 3 mbar; inspiratory to expiratory ratio of
1:1; tidal volume of 12 ml/kg; respiratory rate (RR) was set to
maintain normocapnia. Ringer's solution at a rate of 5 ml/kg/
hour was given throughout the entire experiment and was not
changed. Before the lung lavage procedure started, hydroxye-
thyl starch (15 ml/kg; HES 130/0.4 Voluven
®
; Fresenius Kabi
GmbH, Bad Homburg, Germany) was intravenously infused
over 30 minutes. No further fluid boluses were applied during
the experiment.
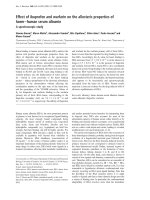
Figure 1
Illustration of the study protocolIllustration of the study protocol. ETT, endotracheal tube; HFOV, high-frequency oscillatory ventilation; PCV, pressure-controlled ventilation;
PEEP, positive end-expiratory pressure; Pmean, mean airway pressure; VCV, volume-controlled ventilation; Vt, tidal volume.
Available online />Page 3 of 10
(page number not for citation purposes)
After exposure of the femoral vessels, a left ventricular cathe-
ter, an arterial catheter, a central venous line, and a pulmonary
artery catheter with continuous cardiac output measurement
(7.5 F Edwards CCO catheter connected to Edwards Vigi-
lance CCO Monitor; Edwards Lifesciences Corp., Irvine, CA,
USA) were inserted. The electrocardiogram, intravascular
pressures, and left ventricular pressure were monitored con-
tinuously (S/5 Monitoring; Datex-Ohmeda, Duisburg, Ger-
many). An aortic catheter was inserted via the left axillary artery
for blood withdrawal during microsphere application, for inter-
mittent arterial blood gas analysis (ABL 500; Radiometer,
Copenhagen, Denmark), for arterial oxygen saturation, for
determination of hemoglobin concentration (OSM 3 calibrated
for swine blood; Radiometer), and for calibration of the contin-
uous blood gas monitoring sensor (inserted via the femoral
artery catheter, Paratrend 7; Diametrics Medical, High
Wycombe, UK. The positions of the left ventricular catheter
and pulmonary artery catheter were verified by typical
waveforms.
All intravascular catheters were zeroed to the atmosphere. The
midpoint between the anterior and posterior chest walls was
taken as the zero reference point for pressure measurements.
The animals were positioned in the prone position and a cath-
eter was inserted into the right cerebral ventricle and con-
nected to a fluid-filled pressure transducer (referenced to the
meatus acusticus externus). All animals were thereafter placed
in a supine position for the entire experiment. The distance
between the mouth and the middle of the sternum was meas-
ured and marked on an esophageal catheter (SmartCath
®
Esophageal catheter; VIASYS Healthcare) with an inflatable
balloon at its tip. This catheter was connected to the esopha-
geal pressure port of the ventilator (AVEA Comprehensive;
VIASYS Healthcare), and an automated self-test (leakage test)
and zeroing procedure (reference = atmosphere) was per-
formed by the ventilator. The esophageal catheter was then
inserted up to the marked position into the esophagus. The
continuous measurement of the mean esophageal pressures
started after activation of the software program of the ventila-
tor and automated inflation of the balloon catheter with 0.5–
1.25 ml air.
Experimental protocol
Acute lung injury was induced by repetitive lung lavages until
a PaO
2
/FiO
2
ratio less than 13.3 kPa was achieved. The
endotracheal tube was disconnected from the ventilator and
isotonic Ringer's solution (20 ml/kg, 38°C) was instilled from
a height of 70 cm above the endotracheal tube. After 30 sec-
onds of apnea the fluid was retrieved by gravity drainage fol-
lowed by endotracheal suctioning. After lung lavage, lung
injury was progressed by ventilating the animals with a con-
stant-volume mode and a PEEP of 5 mbar for 2 hours (FiO
2
of
1.0; tidal volume of 12 ml/kg; inspiratory time of (T
insp
) 50% of
the respiratory cycle; RR was set to achieve normocapnia). A
continuous infusion of epinephrine was administered to main-
tain the mean arterial pressure between 70 and 80 mmHg dur-
ing lung lavages and during the following two hours of
mechanical ventilation. The administration of epinephrine and
the infusion of Ringer's solution during the rest of the experi-
ment were then kept constant.
After two hours, and in randomized order, a lung recruitment
procedure was performed first by HFOV or by PCV. This was
realized by a P
mean
step-up maneuver of 5 mbar every 30 min-
utes from 20 to 30 mbar. Every increase of P
mean
was per-
formed slowly over 30 seconds. To achieve standardized
conditions between HFOV and PCV, the endotracheal tube
was disconnected for 30 seconds and mechanical ventilation
was than re-established for 30 minutes (volume controlled
ventilation; FiO
2
of 1.0; PEEP of 5 mbar; inspiratory to expira-
tory ratio of 1:1; tidal volume of 12 ml/kg; RR was set to main-
tain normocapnia) before the subsequent respiratory mode
(either HFOV or PCV) was performed.
During HFOV (High Frequency Oscillator Ventilator 3100b;
Sensor Medics, Yorba Linda, CA, USA) the CDP (= P
mean
)
was increased in steps of 5 mbar from 20, to 25 and 30 mbar
every 30 minutes. The bias flow was set to 30 l/minute, the
oscillatory frequency to 5 Hz, and the inspiratory time to 33%
of the respiratory cycle. During PCV (AVEA Ventilator;
VIASYS Healthcare) the P
mean
was increased from 20 to 25 to
30 mbar by increases of PEEP from 10 to 15 to 20 mbar, cou-
pled to a constant inspiratory pressure amplitude (PEEP + 20
mbar) and an inspiration time of 50% of the respiratory cycle.
The FiO
2
was set to 1.0 with both ventilatory modes, and
P
a
CO
2
was maintained between 4.9 and 5.7 kPa by adjust-
ment of the oscillatory pressure amplitude during HFOV and
of the RR during PCV (see Figure 1).
Measurements
All measurements were performed either during ongoing
HFOV or during ongoing PCV. Thirty minutes after mechanical
ventilation at each P
mean
setting (20, 25, or 30 mbar), the heart
rate, mean arterial pressure, left ventricular end-diastolic pres-
sure, central venous pressure, mean pulmonary artery pres-
sure, pulmonary artery occlusion pressure, intracranial
pressure, arterial hemoglobin, arterial and mixed venous blood
gases, cardiac output (CO), mean esophageal pressure, and
organ blood flows were obtained.
Adequate transmission of pleural pressures to the esophageal
balloon catheter was verified by an occlusion test. This test
was performed by moderately squeezing the chest and the
abdomen while the airway was blocked, either after an inspira-
tion or after an expiration. The position of the esophageal cath-
eter was optimized to obtain a ratio of delta airway pressure/
delta esophageal pressure of approximately 1 during thoraco-
abdominal compression maneuvers with the closed respira-
tory system [9].
Critical Care Vol 10 No 4 David et al.
Page 4 of 10
(page number not for citation purposes)
The cardiac output was measured by the continuous thermodi-
lution cardiac output technique (Edwards Vigilance CCO
Monitor; Edwards Lifesciences Corp.). The 'STAT-Mode' of
the Edwards Vigilance CCO Monitor was used in each exper-
iment, which displayed the actual cardiac output values deter-
mined within the past 60 seconds. The last five measurements
of CO were used and averaged. Numeric displayed values of
intravascular pressures were recorded every 10 s for 1 minute
during ongoing ventilation by PCV and HFOV with a switched
off end-expiratory filter function of the monitoring system (S/5
Monitoring; Datex-Ohmeda).
The left ventricular end-diastolic pressure and pulmonary
artery occlusion pressure were obtained as follows. The bal-
loon of the pulmonary artery catheter was inflated and the
monitor sweep was stopped. A vertical cursor was then
adjusted to lie at the R-wave of the electrocardiogram and the
left ventricular end-diastolic pressure was obtained from the
indicated value from the left ventricular pressure wave, and the
pulmonary artery occlusion pressure was obtained from the
indicated value of the pulmonary artery catheter wave. This
procedure was performed at three consecutive R-waves and
three times regardless of the respiratory cycle.
All hemodynamic and ventilatory parameters were stored in a
database sheet (Microsoft
®
Excel 2002; Microsoft Corpora-
tion, Redmond, Washington, USA).
Organ blood flows were measured by the fluorescent micro-
sphere technique, which is a validated method and is
explained in detail elsewhere [10-13]. The general steps
involved are: injection of a microsphere suspension into the
animal circulation; isolation of organs and dissection into tis-
sue volume elements; alkaline digestion of the solid tissue of
each volume element to produce a tissue hydrolysate; centrif-
ugation of the hydrolysate to isolate microspheres; solvation of
microspheres to extract fluorescent dye; and measurement of
the solution's fluorescence in different spectral regions with a
spectrofluorometer. About two million microspheres were
injected into the left ventricular catheter (six different colors,
one for each measurement). The calculation of absolute blood
flow rates was performed by reference blood sampling from
the aortic catheter using a withdrawal pump (2 ml/minute).
At the end of each experiment the animals were euthanized
(according to the recommendations of the Report of the Amer-
ican Veterinary Medicine Association Panel on Euthanasia)
Table 1
Ventilatory parameters, hemodynamics, and blood gas analysis before and after induction of lung injury
Healthy animal Lung lavage before PCV Lung lavage before HFOV
Plateau airway pressure (mbar) 20 ± 2 33* ± 2 34* ± 3
Mean airway pressure (mbar) 9 ± 1 13* ± 2 13* ± 2
Static lung compliance (ml/mbar) 21 ± 1 11* ± 1 10* ± 1
Respiratory rate (minute
-1
) 16 ± 2 16 ± 2 16 ± 2
tidal volume per kg bodyweight (ml/kg) 12.8 ± 0.8 12.1 ± 0.2 12.3 ± 0.2
expiratory minute ventilation (l/minute) 4.7 ± 0.7 5.0 ± 0.6 4.9 ± 0.6
Heart rate (minute
-1
) 112 ± 12 127* ± 25 125* ± 18
Mean arterial pressure (mmHg) 80 ± 11 81 ± 6 81 ± 8
Right atrial pressure (mmHg) 13 ± 2 12 ± 3 12 ± 2
Mean pulmonary arterial pressure (mmHg) 26 ± 6 39* ± 6 40* ± 6
Pulmonary artery occlusion pressure (mmHg) 10 ± 3 13 ± 5 14 ± 3
Left ventricular end-diastolic pressure
(mmHg)
2 ± 1 3 ± 1 3 ± 1
Intracranial pressure (mmHg) 11 ± 2 13 ± 2 13 ± 1
Cardiac output (l/minute) 3.3 ± 0.3 3.8 ± 0.5 3.7 ± 0.6
Stroke volume (ml) 28 ± 4 29 ± 8 30 ± 6
PaO
2
(kPa) 65.9 ± 8.9 10.8* ± 1.7 11.3* ± 1.9
PaCO
2
(kPa) 5.5 ± 0.3 5.5 ± 0.4 5.6 ± 0.3
Pulmonary shunt (%) 3 ± 1 38* ± 4 39* ± 9
Measurements taken during volume-controlled ventilation (positive end-expiratory pressure, 5 mbar; FiO
2
, 1.0). No differences were found
between lung-injured animals before transition to either high-frequency oscillatory ventilation (HFOV) or pressure-controlled ventilation (PCV).
Data presented as the mean ± standard deviation. Static lung compliance = tidal volume/(plateau airway pressure - positive end-expiratory
pressure). *P < 0.01 versus healthy lungs.
Available online />Page 5 of 10
(page number not for citation purposes)
and the correct position of all catheters was verified by
autopsy. The brains, hearts, kidneys and a jejunal section (10
cm) were removed and weighed. The microspheres were
recovered from the tissue and from the blood by a sedimenta-
tion method [13,14].
Blood flows were calculated according to the formula: blood
flow (ml/minute) = I
S
× R (ml/minute) × I
R
-1
(where I
S
is the flu-
orescence intensity of sample, I
R
is the fluorescence intensity
in the reference blood sample, and R is the reference with-
drawal rate).
The transpulmonary pressure was calculated at each P
mean
setting during HFOV and PCV according to the formula: P
T
=
P
mean
- mean esophageal pressure.
The pulmonary shunt (Q
s
/Q
t
) was calculated using a standard
formula: Q
s
/Q
t
= Cc'O
2
- CaO
2
/Cc'O
2
- CvO
2
(where Q
s
is the
shunt flow, Q
t
is the cardiac output, and Cc'O
2
, CaO
2
, and
CvO
2
represent the oxygen content of pulmonary end-capil-
lary, arterial and mixed venous blood, respectively). The oxygen
contents of arterial (CaO
2
), mixed venous (CvO
2
) and pulmo-
nary capillary (Cc'O
2
) samples were calculated using the fol-
lowing formula: content of oxygen = (hemoglobin
concentration × 1.34 × percentage oxygen saturation/100) +
(partial oxygen tension × 0.0031). To calculate Cc'O
2
, the pul-
monary capillary oxygen tension was assumed to be equivalent
to the alveolar partial oxygen tension, which was estimated as
follows: FiO
2
× (barometric pressure - water vapor pressure) -
PaCO
2
/respiratory quotient. The value for the water vapor
pressure was 47 mmHg and we assumed that the respiratory
quotient was 0.8.
Oxygen delivery (DO
2
) was calculated according to the for-
mula: DO
2
= CO × CaO
2
.
The cerebral perfusion pressure was calculated as follows:
cerebral perfusion pressure = mean arterial pressure - intrac-
ranial pressure.
Statistical analysis
Data are expressed as the mean ± standard deviation. In each
animal both the sequence of the two ventilatory modes (at first
HFOV and secondly PCV, or at first PCV and secondly HFOV)
and the order of the six different colors of microspheres were
randomized by statistical software (BIASR Version 7.40; Epsi-
lon-Verlag, Hochheim-Darmstadt, Germany) from a nonpartic-
ipant before the investigation started. The order of the P
mean
settings for lung recruitment were not randomized (the fixed
sequence started at 20 mbar, increased to 25 mbar, and
increased to 30 mbar every for 30 minutes).
An equal distribution for all data was analyzed by the Kol-
mogorov-Smirnov test. Differences for hemodynamics and
blood gases before lung lavage and after lung lavage before
HFOV and PCV were tested by paired t test. Analysis of vari-
ance for multiple measurements and pairwise multiple com-
parison procedures (Bonferroni t test) (Sigma Stat, Version
2.03; SPSS Inc., San Raphael, CA, USA) were used to evalu-
ate the change of hemodynamics, ventilatory parameters, arte-
Table 2
Transpulmonary pressures, ventilatory parameters, arterial blood gases, calculated pulmonary shunt, oxygen delivery, heart rate,
and cerebral perfusion pressure during a lung recruitment procedure by successive increases of mean airway pressure
20 mbar mean airway pressure 25 mbar mean airway pressure 30 mbar mean airway pressure
HFOV PCV HFOV PCV HFOV PCV
Transpulmonary pressure (mbar) 15 ± 3 15 ± 3 19
c
± 2 18
a
± 3 22
cd
± 2 23
ab
± 2
Respiratory rate (minute
-1
) 300 18 ± 10 300 21 ± 11 300 27
ab
± 10
Oscillatory pressure amplitude (mbar) 40 ± 7 NA 41 ± 8 NA 52
cd
± 8 NA
Dynamic compliance of the respiratory
system (ml/mbar)
NA 18 ± 5 NA 17 ± 4 NA 12
ab
± 3
Tidal volume per kg bodyweight (ml/kg) NA 13 ± 3 NA 12 ± 4 NA 10
ab
± 2
PaO
2
(kPa) 21 ± 4 19 ± 6 57
c
± 10 43
a
± 21 69
cd
± 7 71
ab
± 11
PaCO
2
(kPa) 5.3 ± 0.3 5.4 ± 0.3 5.4 ± 0.31 5.3 ± 0.3 5.4 ± 0.3 5.4 ± 0.3
Pulmonary shunt (%) 22 ± 8 23 ± 7 6
c
± 3 10 ± 6 3
cd
± 1 3
a
± 1
Oxygen delivery (ml/minute) 347 ± 64 356 ± 73 341 ± 65 353 ± 50 335 ± 63 338 ± 57
Heart rate (minute
-1
) 119 ± 16 123 ± 19 121 ± 16 129 ± 19 129
b
± 18 134
a
± 18
Cerebral perfusion pressure (mmHg) 74 ± 15 80 ± 10 68 ± 10 70 ± 8 62
b
± 9 65
a
± 13
Data presented as the mean ± standard deviation. HFOV, high-frequency oscillatory ventilation; PCV, pressure-controlled ventilation. Dynamic
compliance of the respiratory system = tidal volume/(endinspiratory pressure - positive end-expiratory pressure).
a
P < 0.05 compared with PCV 20
mbar,
b
P < 0.05 compared with PCV 25 mbar,
c
P < 0.05 compared with HFOV 20 mbar,
d
P < 0.05 compared with HFOV 25 mbar. NA, not
applicable.
Critical Care Vol 10 No 4 David et al.
Page 6 of 10
(page number not for citation purposes)
rial blood gases, pulmonary shunt, and organ blood flows over
time during HFOV and PCV, and to evaluate the differences of
hemodynamics, ventilatory parameters, arterial blood gases,
pulmonary shunt, and organ blood flows between the ventila-
tory modes (HFOV and PCV). Linear correlation analysis was
performed to evaluate the association between the transpul-
monary pressure and hemodynamics and between the right
and left renal blood flow. Differences were considered statisti-
cally significant if P < 0.05.
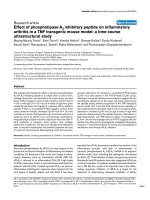
Figure 2
Individual relationships between hemodynamics against corresponding transpulmonary pressures during high-frequency oscillatory ventilation and pressure-controlled ventilationIndividual relationships between hemodynamics against corresponding transpulmonary pressures during high-frequency oscillatory venti-
lation and pressure-controlled ventilation. Relationships during high-frequency oscillatory ventilation (HFOV) (filled symbols) and pressure-con-
trolled ventilation (PCV) (open symbols) for (a) cardiac output, (b) stroke volume, (c) intracranial pressure, (d) mean arterial pressure, (e) right atrial
pressure, (f) mean pulmonary artery pressure, (g) pulmonary artery occlusion pressure, and (h) left ventricular end-diastolic pressure. Animals are
indicated #1–#7.
Available online />Page 7 of 10
(page number not for citation purposes)
Results
The protocol was completed in all seven animals. Lung injury
was induced by an average number of 4.1 ± 0.4 lung lavages
(lavage volume, 2071 ± 189 ml). Epinephrine was adminis-
tered at a rate of 0.04 (0.02–0.06) µg/kg/minute to maintain a
mean arterial pressure between 70 and 80 mmHg during lung
lavages and the following two hours of volume controlled ven-
tilation. The mean volume of intravenously infused fluid volume
was 1329 ± 122 ml during the experiment (mean duration, 7.5
± 0.6 hours). No fluid boluses were applied during PCV and
HFOV. Table 1 presents the ventilatory parameters, hemody-
namics, and blood gas analysis before and after induction of
lung injury. No differences in gas exchange and hemodynam-
ics were noted before initiation of either HFOV or of PCV.
Hemodynamics and blood flows
The results of the hemodynamic measurements for PCV ver-
sus HFOV are presented in Table 2 and Figure 2, where indi-
vidual values of hemodynamics to corresponding
transpulmonary pressures are graphically displayed. Measure-
ments did not differ between both ventilation modes.
The elevation of P
mean
from 20 to 30 mbar lead to an increase
of the heart rate (Table 2), right atrial pressure (HFOV, from 12
± 4 mmHg to 15 ± 3 mmHg, P < 0.05; PCV, from 12 ± 2
mmHg to 16 ± 4 mmHg, P < 0.05), pulmonary artery occlu-
sion pressure (HFOV, from 12 ± 2 mmHg to 16 ± 2 mmHg, P
< 0.05; PCV, from 13 ± 2 mmHg to 15 ± 2 mmHg, P < 0.05),
left ventricular end-diastolic pressure (HFOV, from 3 ± 1
mmHg to 6 ± 3 mmHg, P < 0.05; PCV, from 2 ± 1 mmHg to
7 ± 3 mmHg, P < 0.05), and intracranial pressure (HFOV, from
14 ± 2 mmHg to 16 ± 2 mmHg, P < 0.05; PCV, from 15 ± 3
mmHg to 17 ± 2 mmHg, P < 0.05) during HFOV and PCV. At
the highest P
mean
setting of 30 mbar, the mean arterial pres-
sure (HFOV, from 89 ± 7 mmHg to 79 ± 9 mmHg, P < 0.05;
PCV, from 91 ± 8 mmHg to 81 ± 8 mmHg, P < 0.05), cerebral
perfusion pressure (Table 2), cardiac output (HFOV, from 3.9
± 0.4 l/minute to 3.5 ± 0.3 l/minute, P < 0.05; PCV, from 3.8
± 0.6 l/minute to 3.4 ± 0.3 l/minute, P < 0.05), and stroke vol-
ume (HFOV, from 32 ± 7 ml to 28 ± 5 ml, P < 0.05; PCV, from
31 ± 2 ml to 26 ± 4 ml, P < 0.05) decreased during HFOV
and PCV when compared with measurements at P
mean
levels
of 20 mbar. The mean pulmonary artery pressure remained
stable during all P
mean
variations at both ventilation modes.
The results of the linear correlation analysis between hemody-
namics and transpulmonary pressure are presented in Table 3.
The results of blood flow measurements are presented in
Table 4. A homogeneous distribution of microspheres to the
organs was indicated by significant linear correlation (r = 0.98,
r
2
= 0.95, P < 0.000001, confidence interval (P = 0.99) =
0.91–0.99) between the blood flow of the right kidney (271 ±
131 ml/100 g/minute) and of the left kidney (270 ± 128 ml/
100 g/minute). There were no differences between left and
right renal blood flow. The left ventricular and right ventricular
blood flow did not vary during P
mean
variations. Renal blood
flow did not change during increases of P
mean
and showed no
differences between HFOV and PCV. Jejunal blood flow
showed no deterioration during airway pressure increases.
Also, the cerebral blood flow in the hemispheres, the cerebel-
lum and the brainstem was not influenced by different P
mean
levels and showed no differences between HFOV and PCV.
Transpulmonary pressure, pulmonary gas exchange, and
pulmonary shunt
All ventilatory parameters, PaO
2
and PaCO
2
, and calculated
pulmonary shunt fraction data are presented in Table 2. The P
T
increased at every P
mean
level during HFOV and PCV, and was
comparable between both ventilatory modes at each P
mean
set-
ting. Oxygenation improved after initiation of HFOV and PCV
by a stepwise increase of P
mean
, starting at 20 mbar, followed
by 25 and 30 mbar. To maintain normocapnia at a P
mean
level
of 30 mbar, increased oscillatory pressure amplitudes (Table
2) during HFOV and increased respiratory rates during PCV
were necessary. The P
mean
of 30 mbar during PCV was
Table 3
Linear correlation analysis between transpulmonary pressure and hemodynamics during a lung recruitment procedure by
successive increases of mean airway pressure
High-frequency oscillatory ventilation Pressure-controlled ventilation
Cardiac output -0.29 (0.18) -0. 53 (0.01)
Stroke volume -0.23 (0.33) -0.18 (0.41)
Intracranial pressure 0.48 (0.03) 0.42 (0.06)
Mean arterial pressure -0.46 (0.04) -0.52 (0.01)
Right atrial pressure 0.44 (0.04) 0.19 (0.42)
Mean pulmonary artery pressure 0.17 (0.45) -0.10 (0.65)
Pulmonary artery occlusion pressure 0.52 (<0.01) 0.67 (<0.01)
Left ventricular end-diastolic pressure 0.57 (0.04) 0.63 (0.002)
Data presented as correlation coefficient (P value).
Critical Care Vol 10 No 4 David et al.
Page 8 of 10
(page number not for citation purposes)
accompanied by lower tidal volumes and decreased dynamic
compliance of the respiratory system.
Measurement of tidal volumes and dynamic compliance of the
respiratory system during HFOV was technically not possible.
At similar P
mean
levels, the PaO
2
and PaCO
2
values showed no
differences between HFOV and PCV. As shown in Table 4,
pulmonary shunt values decreased to physiological values
(less than 5%) at the highest P
mean
setting in all animals,
whereas at a P
mean
level of 25 mbar the pulmonary shunt was
reduced by HFOV only. Oxygen delivery was unchanged when
P
mean
increased, independent of the ventilatory mode used
(Table 2).
Discussion
Lung recruitment procedures by incremental increases of lung
volumes and airway pressures may impair hemodynamics and
organ blood flow [15,16]. The present study compared a typ-
ical recruitment maneuver up to a P
mean
of 30 mbar by HFOV
with a recruitment maneuver by PCV at similar P
mean
settings
in a lung lavage model. The lung lavage model affects particu-
larly the lung, whereas other organs are not involved, and
organ blood flow autoregulation is theoretically intact. In this
setting, we observed decreases of the arterial pressure, car-
diac output, and stroke volume, and observed increases of the
heart rate, central venous pressure, pulmonary artery occlu-
sion pressure, left ventricular end-diastolic pressure, and
intracranial pressure during lung recruitment in both ventilatory
modes. The cerebral blood flow, myocardial blood flow, renal
blood flow, and blood flow of the jejunum, however, were not
reduced during stepwise increases of the mean airway pres-
sure up to 30 mbar in the lung-injured animals. Transpulmo-
nary pressures during HFOV and PCV were comparable.
Organ blood flow and systemic hemodynamics did not differ
between both ventilatory modes. These results may differ in a
scenario without inotrope and vasoactive drug administration
or when extrapulmonary organ dysfunctions are present (e.g.
sepsis, septic shock, intracranial pathology, or multiple organ
failure).
Transition to HFOV requires a recruitment procedure of the
lung at initiation, typically performed by slow stepwise
increases of continuous distending pressure to optimize the
alveolar volume available for gas exchange, as used in several
clinical studies [5-8]. This procedure differs from recruitment
maneuvers by conventional ventilation modes, which use sus-
tained or intermittent PEEP or inspiratory pressure level
increases (such as, deep lung inflation of various magnitudes
and durations). During HFOV, the expansion of the lung and
chest wall continues constantly without excursions related to
large tidal volume or airway pressure when compared with
conventional low-frequency ventilation modes [17]. The cardi-
ovascular effects of increasing intrathoracic pressures during
low-frequency positive-pressure ventilation are well investi-
gated. The portion of the applied intraalveolar pressure trans-
mitted across the lung (transpulmonary pressure) may rise at
higher P
mean
but depends mainly on the elastance of the chest
wall and the lung [18]. High transpulmonary pressures have
been associated with increases in cardiac filling pressures,
and decreases in venous return, cardiac output, and arterial
pressures [3,4].
The right ventricular afterload may increase when high airway
pressures are applied and subsequent right ventricular
enlargement could alter the left ventricular performance by
ventricular interdependence (that is to say, leftward shift of the
ventricular septum with decreased left ventricular compliance
and disturbance of septal wall motion). Also, an increased lung
volume with exhausted compensation mechanisms (descend-
ent diaphragm, expanded rib cage) during lung recruitment
can affect cardiac function and hemodynamics by direct
mechanical compression of the heart into the cardiac fossa.
Table 4
Organ blood flows (ml/100 g/min) during a lung recruitment procedure by successive increases of mean airway pressure
20 mbar mean airway pressure 25 mbar mean airway pressure 30 mbar mean airway pressure
HFOV PCV HFOV HFOV PCV HFOV
Left ventricle 220 ± 115 239 ± 74 240 ± 100 266 ± 64 191 ± 55 197 ± 79
Right ventricle 163 ± 72 208 ± 80 206 ± 88 221 ± 66 172 ± 86 209 ± 80
Kidneys 293 ± 89 265 ± 88 258 ± 102 298 ± 80 276 ± 102 240 ± 37
Jejunum 47 ± 22 44 ± 22 47 ± 19 53 ± 17 48 ± 25 47 ± 17
Hemispheres 55 ± 23 53 ± 20 46 ± 22 53 ± 18 45 ± 23 47 ± 10
Cerebellum 43 ± 18 49 ± 16 46 ± 16 48 ± 22 46 ± 15 51 ± 10
Brainstem 40 ± 19 46 ± 13 36 ± 14 43 ± 13 37 ± 19 39 ± 17
Organ blood flow was unchanged when the mean airway pressure increased and no differences were found between high-frequency oscillatory
ventilation (HFOV) and pressure-controlled ventilation (PCV). Data presented as the mean ± standard deviation.
Available online />Page 9 of 10
(page number not for citation purposes)
Experimental and clinical studies have demonstrated effects
upon hemodynamics with initiation of HFOV at high mean air-
way pressures, whereas other studies did not find this effect
[5-8,19-23].
In the literature, HFOV has been associated with a decrease
in arterial pressures, cardiac output, and stroke volume
because of reduced venous return. Systemic hemodynamics
decreased during lung recruitment maneuvers by HFOV and
PCV, but remained in the normal ranges in the present study;
it is expected that these effects can easily corrected either by
volume administration or by the adaptation of the vasoactive
drug dosage. One possible explanation for the impairment in
the hemodynamics is right ventricular dysfunction due to an
increased impedance to the right ventricular output, resulting
in dilatation of the right ventricle, in displacement of the inter-
ventricular septum towards the left ventricle, and hence in
impairment of left ventricular filling. We did not, however,
observe any signs of severe right heart dysfunction during
increases of P
mean
and P
T
.
The magnitude of effects upon the cerebral perfusion pressure
and the intracranial pressure was minor in animals without
intracranial pathology but with an unchanged administration of
epinephrine. All recorded hemodynamic effects were compa-
rable at similar P
T
levels between PCV and HFOV. In this set-
ting, therefore, the P
T
level that interacts with the
cardiorespiratory unit is the main determinant of hemodynamic
response, and not the used ventilatory mode. The used PCV
settings for lung recruitment, however, did not incorporate the
recommended ventilatory strategy in humans with acute lung
injury and acute respiratory distress syndrome (tidal volume, 6
ml/kg predicted bodyweight; inspiratory pressure limitation,
35 mbar; permissive hypercapnia), and it is well known that
inspiratory inflation at high lung volumes may limit cardiac vol-
umes. Normocapnia was maintained during HFOV and PCV to
exclude a significant source of bias in respect to substantial
hypercapnia-associated effects upon hemodynamics and
organ blood flow [24,25].
In this scenario, the blood flow to the brain, heart, kidneys, and
jejunum was unaffected when P
mean
and P
T
increased. This
may be due to the absence of severe effects of the increased
P
T
upon systemic hemodynamics and due to the fact that
blood flow autoregulation of organs was still intact because of
only one organ failure (lung injury induced by lung lavage).
With respect to short-time effects, Nunes and colleagues
reported in healthy pigs impaired intestinal blood flows within
minutes at high airway pressures (continuous positive airway
pressure of 40 mbar for 20 seconds), but these effects recov-
ered quickly after the lung recruitment procedure [26]. Dorin-
sky and colleagues reported decreased CO, but unaffected
regional blood flow (kidneys, heart, brain) at high PEEP levels
(25 mbar) after 30 and 60 minutes in healthy pigs [27].
The effects of elevated airway pressures and the resulting
transpulmonary pressures upon different vascular beds and
organ perfusion, however, may be more pronounced in a clin-
ical situation with acute lung injury/acute respiratory distress
syndrome, concomitant extrapulmonary organ dysfunction,
and impaired tissue perfusion. Oxygenation improved during
HFOV and PCV without differences between both ventilatory
modes at high mean airway pressures. The calculated pulmo-
nary shunt fraction (that is to say, venous admixture) fulfilled
the criteria (pulmonary shunt less than 10%) of complete reo-
pened lungs [28]. Simultaneously, the recruitment of closed
alveolar units was paralleled by pulmonary hyperinflation, indi-
cated by decreased CO
2
clearance because of increased
dead space when P
mean
was set to 30 mbar. The oscillatory
pressure amplitude during HFOV and the RR during PCV had
to be increased to maintain the arterial PCO
2
in the predefined
range.
Limitations
The present study is experimental and the results cannot
directly be extrapolated to patients with lung injury and without
use of inotropic drug and vasoactive drug administration. The
used method for blood flow measurement allowed only a sin-
gle assessment at each P
mean
setting (one measurement 30
minutes after each P
mean
adjustment), and negative effects
before this measurement as well as long-lasting effects cannot
be excluded. The resulting tidal volumes during lung recruit-
ment procedures by PCV were higher than the recommended
tidal volume of 6 ml/kg predicted bodyweight in humans with
acute lung injury or acute respiratory distress syndrome. The
findings of an HFOV initiation protocol by stepwise increases
of CDP can therefore only be compared with the used lung
recruitment strategy by PCV with PEEP increases coupled to
a constant inspiratory pressure amplitude (PEEP + 20 mbar).
According to the randomization, HFOV was used as the sec-
ond mode in four animals whereas only three animals received
PCV as the second mode. Recovery from lavage-induced lung
injury over time by endogenous production of surfactant can-
not be excluded. Hence, a bias of the results due to a time
effect cannot be excluded and might have favored one group.
Conclusion
The present experimental study in lung-injured pigs with
unchanged dosages of a positive intotrope and a vasoactive
drug demonstrates that a typical lung recruitment maneuver as
used clinically at initiation of HFOV decreases the systemic
hemodynamics, improves oxygenation, decreases pulmonary
shunt, but has no negative influence upon blood flow to the
brain, the kidneys, the jejunum and the heart. The stabilization
of organ blood flows may be due to the absence of severe
changes of systemic hemodynamics in lung-injured pigs and
the assumption that blood flow autoregulation of organs was
intact. Changes of macrohemodynamics were dependent on
the transpulmonary pressure level, however, and were not
associated with HFOV per se. All effects were similar to the
Critical Care Vol 10 No 4 David et al.
Page 10 of 10
(page number not for citation purposes)
used settings of conventional low-frequency PCV at compara-
ble transpulmonary pressures. The effects of HFOV-associ-
ated effects upon organ perfusion in a scenario with acute
lung injury and concomitant multiple organ failure need to be
addressed in further studies.
Competing interests
The authors declare that they have no competing interests.
Authors' contributions
MD and KM initiated the study, the design and the experimen-
tal protocol. MD, HWG, JK, and ALD conducted the experi-
ments and the analysis of fluorescent microspheres for organ
blood flow measurements. OK supported the analysis of
microspheres. MD and KM performed the statistical analysis.
MD wrote the manuscript, and KM and OK helped to draft the
manuscript. All authors read and approved the final
manuscript.
Acknowledgements
This study was funded by a German Research Council (DFG) Grant: Ma
2398/3.
References
1. Pillow JJ: High-frequency oscillatory ventilation: mechanisms
of gas exchange and lung mechanics. Crit Care Med 2005,
Suppl 33:135-141.
2. Chan KP, Stewart TE: Clinical use of high-frequency oscillatory
ventilation in adult patients with acute respiratory distress
syndrome. Crit Care Med 2005, Suppl 33:170-174.
3. Pinsky MR: Recent advances in the clinical application of heart-
lung interactions. Curr Opin Crit Care 2002, 8:26-31.
4. Luecke T, Pelosi P: Clinical review: positive end-expiratory
pressure and cardiac output. Crit Care 2005, 9:607-621.
5. Derdak S, Mehta S, Stewart TE, Smith T, Rogers M, Buchman TG,
Carlin B, Lowson S, Granton J, Multicenter Oscillatory Ventilation
For Acute Respiratory Distress Syndrome Trial (MOAT) Study
Investigators: High-frequency oscillatory ventilation for acute
respiratory distress syndrome in adults. Am J Respir Crit Care
Med 2002, 166:801-808.
6. David M, Weiler N, Heinrichs W, Neumann M, Joost T, Markstaller
K, Eberle B: High-frequency oscillatory ventilation in adult
acute respiratory distress syndrome. Intensive Care Med 2003,
29:1656-1665.
7. Bollen CW, van Well GT, Sherry T, Beale RJ, Shah S, Findlay G,
Monchi M, Chiche JD, Weiler N, Uiterwaal C, van Vught AJ: High
frequency oscillatory ventilation compared with conventional
mechanical ventilation in adult respiratory distress syndrome:
a randomized controlled trial [ISRCTN24242669]. Crit Care
2005, 9:R430-R439.
8. David M, Karmrodt J, Weiler N, Scholz A, Markstaller K, Eberle B:
High-frequency oscillatory ventilation in adults with traumatic
brain injury and acute respiratory distress syndrome. Acta
Anaesthesiol Scand 2005, 49:209-214.
9. Lanteri CJ, Kano S, Sly PD: Validation of esophageal pressure
occlusion test after paralysis. Pediatr Pulmonol 1994,
17:56-62.
10. Rudolph AM, Heymann MA: The circulation of the fetus in utero.
Methods for studying distribution of blood flow, cardiac output
and organ blood flow. Circ Res 1967, 21:163-184.
11. Bassingthwaighte JB, Malone MA, Moffett TC, King RB, Little SE,
Link JM, Krohn KA: Validity of microsphere deposition for
regional myocardial flows. Am J Physiol 1987,
253:H184-H193.
12. Glenny RW, Bernard S, Brinkley M: Validation of fluorescent-
labeled microspheres for measurement of regional organ
perfusion. J Appl Physiol 1993, 74:2585-2597.
13. Chien GL, Anselone CG, Davis RF, Van Winkle DM: Fluorescent
vs. radioactive microsphere measurement of regional myocar-
dial blood flow. Cardiovasc Res 1995, 30:405-412.
14. Horstick G, Berg O, Heimann A, Gotze O, Loos M, Hafner G, Bier-
bach B, Petersen S, Bhakdi S, Darius H, et al.: Application of C1-
esterase inhibitor during reperfusion of ischemic myocar-
dium: dose-related beneficial versus detrimental effects. Cir-
culation 2001, 104:3125-3131.
15. Villagra A, Ochagavia A, Vatua S, Murias G, Del Mar Fernandez M,
Lopez Aguilar J, Fernandez R, Blanch L: Recruitment maneuvers
during lung protective ventilation in acute respiratory distress
syndrome. Am J Respir Crit Care Med 2002, 165:165-170.
16. Singer M, Vermaat J, Hall G, Latter G, Patel M: Hemodynamic
effects of manual hyperinflation in critically ill mechanically
ventilated patients. Chest 1994, 106:1182-1187.
17. Luecke T, Meinhardt JP, Herrmann P, Weisser G, Pelosi P, Quintel
M: Setting mean airway pressure during high-frequency oscil-
latory ventilation according to the static pressure-volume
curve in surfactant-deficient lung injury: a computed tomogra-
phy study. Anesthesiology 2003, 99:1313-1322.
18. Gattinoni L, Chiumello D, Carlesso E, Valenza F: Bench-to-bed-
side review: chest wall elastance in acute lung injury/acute
respiratory distress syndrome patients. Crit Care 2004,
8:350-355.
19. Zobel G, Dacar D, Rodl S: Hemodynamic effects of different
modes of mechanical ventilation in acute cardiac and pulmo-
nary failure: an experimental study. Crit Care Med 1994,
22:1624-1630.
20. Traverse JH, Korvenranta H, Adams EM, Goldthwait DA, Carlo
WA: Impairment of hemodynamics with increasing mean air-
way pressure during high-frequency oscillatory ventilation.
Pediatr Res 1988, 23:628-631.
21. Lucking SE, Fields AI, Mahfood S, Kassir MM, Midgley FM: High-
frequency ventilation versus conventional ventilation in dogs
with right ventricular dysfunction. Crit Care Med 1986,
14:798-801.
22. Osiovich HC, Suguihara C, Goldberg RN, Hehre D, Martinez O,
Bancalari E: Hemodynamic effects of conventional and high
frequency oscillatory ventilation in normal and septic piglets.
Biol Neonate 1991, 59:244-252.
23. David M, von Bardeleben RS, Weiler N, Markstaller K, Scholz A,
Karmrodt J, Eberle B: Cardiac function and hemodynamics dur-
ing transition to high-frequency oscillatory ventilation. Eur J
Anaesthesiol 2004, 21:944-952.
24. Mas A, Saura P, Joseph D, Blanch L, Baigorri F, Artigas A, Fernan-
dez R: Effects of acute moderate changes in PaCO
2
on global
hemodynamics and gastric perfusion. Crit Care Med 2000,
28:360-365.
25. Akca O: Optimizing the intraoperative management of carbon
dioxide concentration. Curr Opin Anaesthesiol 2006, 19:19-25.
26. Nunes S, Rothen HU, Brander L, Takala J, Jakob SM: Changes in
splanchnic circulation during an alveolar recruitment maneu-
ver in healthy porcine lungs. Anesth Analg 2004,
98:1432-1438.
27. Dorinsky PM, Hamlin RL, Gadek JE: Alterations in regional blood
flow during positive end-expiratory pressure ventilation. Crit
Care Med 1987, 15:106-113.
28. Lachmann B: Open up the lung and keep the lung open. Inten-
sive Care Med 1992, 18:319-321.
Key messages
• A lung recruitment maneuver by stepwise increases of
the mean airway pressure to 30 mbar either by PCV
with tidal volumes of 10–13 ml/kg or by HFOV had sim-
ilar effects on cardiac performance and on blood flow to
the nonpulmonary organs.
• The results of this study cannot be extrapolated to clini-
cal situations without the use of inotropic drugs or
vasoactive drugs.