Environmental Soil Chemistry - Chapter 10 pot
Bạn đang xem bản rút gọn của tài liệu. Xem và tải ngay bản đầy đủ của tài liệu tại đây (473.08 KB, 68 trang )
285
10
The Chemistry of
Saline and Sodic
Soils
Introduction
O
ceans contain about 97.3% of the Earth’s water, continents about
2.8%, and the atmosphere about 0.001% (Todd, 1970). About
77.2% of the water associated with continents occurs in ice caps
and glaciers and about 22% is groundwater. The remaining 0.8% occurs as
surface waters (lakes and rivers). The land surface of the Earth is 13.2 × 10
9
ha; of this area, 7 × 10
9
ha is arable and only 1.5 × 10
9
ha is cultivated
(Massoud, 1981). Of the cultivated land, approximately 0.34 × 10
9
ha (23%)
is saline and 0.56 × 10
9
ha (37%) is sodic, containing excessive levels of Na
+
.
Salinity can be defined as “the concentration of dissolved mineral salts
present in waters and soils on a unit volume or weight basis” (Tanji, 1990b).
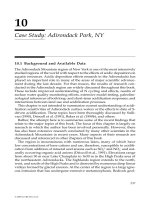
Figure 10.1 and Table 10.1 show the global distribution of salt-affected soils.
Salt-affected soils can be classified as saline, sodic, and saline–sodic soils.
Briefly, saline soils are plagued by high levels of soluble salts, sodic soils have
high levels of exchangeable sodium, and saline–sodic soils have high contents
of both soluble salts and exchangeable sodium. These soils will be described
more completely later.
Salt-affected soils occur most often in arid and semiarid climates but
they can also be found in areas where the climate and mobility of salts cause
saline waters and soils for short periods of time (Tanji, 1990b). However, for
the most part, in humid regions salt-affected soils are not a problem because
rainfall is sufficient to leach excess salts out of the soil, into groundwater, and
eventually into the ocean. Some salt-affected soils may occur along seacoasts
or river delta regions where seawater has inundated the soil (Richards, 1954).
286 10 The Chemistry of Saline and Sodic Soils
TABLE 10.1. Global Distribution of Salt-Affected Soils
a
Area in millions of ha
Continent Saline Sodic (alkali) Total
North America 6.2 9.6 15.8
Central America 2.0 — 2.0
South America 69.4 59.6 129.0
Africa 53.5 27.0 80.5
South Asia 83.3 1.8 85.1
North and Central Asia 91.6 120.1 211.7
Southeast Asia 20.0 — 20.0
Australasia 17.4 340.0 357.4
Europe 7.8 22.9 30.7
Total 351.5 581.0 932.2
a
From I. Szabolcs, “Review of Research on Salt-Affected Soils.” Copyright © 1979 UNESCO, Paris. “Salt-Affected
Soils.” Copyright © 1989 CRC Press. Reprinted by permission of CRC Press.
FIGURE 10.1. Global distribution of salt-affected soils. Reprinted with permission from Szabolcs, I.
(1989). “Salt-Affected Soils.” CRC Press, Boca Raton, FL.
Causes of Soil Salinity
Soluble Salts
In arid and semiarid climates, there is not enough water to leach soluble salts
from the soil. Consequently, the soluble salts accumulate, resulting in salt-
affected soils. The major cations and anions of concern in saline soils and
waters are Na
+
, Ca
2+
, Mg
2+
, and K
+
, and the primary anions are Cl
–
, SO
2–
4
,
HCO
–
3
, CO
2–
3
, and NO
–
3
. In hypersaline waters or brines, B, Sr, Li, SiO
2
,
Rb, F, Mo, Mn, Ba, and Al (since the pH is high Al would be in the Al(OH)
–
4
form) may also be present (Tanji, 1990b). Bicarbonate ions result from the
reaction of carbon dioxide in water. The source of the carbon dioxide is either
the atmosphere or respiration from plant roots or other soil organisms.
Carbonate ions are normally found only at pH ≥ 9.5. Boron results from
weathering of boron-containing minerals such as tourmaline (Richards, 1954).
When soluble salts accumulate, Na
+
often becomes the dominant counterion
on the soil exchanger phase, causing the soil to become dispersed. This results
in a number of physical problems such as poor drainage. The predominance
of Na
+
on the exchanger phase may occur due to Ca
2+
and Mg
2+
precipitating
as CaSO
4
, CaCO
3
, and CaMg(CO
3
)
2
. Sodium then replaces exchangeable
Ca
2+
and Mg
2+
on the exchanger phase.
Evapotranspiration
An additional factor in causing salt-affected soils is the high potential evapo-
transpiration in these areas, which increases the concentration of salts in both
soils and surface waters. It has been estimated that evaporation losses can
range from 50 to 90% in arid regions, resulting in 2- to 20-fold increases in
soluble salts (Cope, 1958; Yaalon, 1963).
Drainage
Poor drainage can also cause salinity and may be due to a high water table or
to low soil permeability caused by sodicity (high sodium content) of water.
Soil permeability is “the ease with which gases, liquids or plant roots penetrate
or pass through a bulk mass of soil or a layer of soil” (Glossary of Soil Science
Terms, 1997). As a result of the poor drainage, salt lakes can form like those
in the western United States. Irrigation of nonsaline soils with saline water
can also cause salinity problems. These soils may be level, well drained, and
located near a stream. However, after they are irrigated with saline water
drainage may become poor and the water table may rise.
Irrigation Water Quality
An important factor affecting soil salinity is the quality of irrigation water. If the
irrigation water contains high levels of soluble salts, Na, B, and trace elements,
serious effects on plants and animals can result (Ayers and Westcot, 1976).
Causes of Soil Salinity 287
Salinity problems are common in irrigated lands, with approximately
one-third of the irrigated land in the United States seriously salt-affected
(Rhoades, 1993). In some countries it may be as high as 50% (Postel, 1989).
Areas affected include humid climate areas such as Holland, Sweden, Hungary,
and Russia, and arid and semiarid regions such as the southwestern United
States, Australia, India, and the Middle East. About 100,000 acres of irrigated
land each year are no longer productive because of salinity (Yaron, 1981).
One of the major problems in these irrigated areas is that the irrigation
waters contain dissolved salts, and when the soils are irrigated the salts accu-
mulate unless they are leached out. Saline irrigation water, low soil permeability,
inadequate drainage, low rainfall, and poor irrigation management all cause
salts to accumulate in soils, which deleteriously affects crop growth and yields.
The salts must be leached out for crop production. However, it is the leach-
ing out of these salts, resulting in saline drainage waters, that causes pollution
of waters, a major concern in saline environments.
The presence of selenium and other toxic elements (Cr, Hg) in subsurface
drainage waters is also a problem in irrigated areas. Selenium (resulting from
shale parent material) in drainage waters has caused massive death and deformity
to fish and waterfowl in the Kesterson Reservoir of California.
Sources of Soluble Salts
The major sources of soluble salts in soils are weathering of primary minerals
and native rocks, residual fossil salts, atmospheric deposition, saline irrigation
and drainage waters, saline groundwater, seawater intrusion, additions of
inorganic and organic fertilizers, sludges and sewage effluents, brines from
natural salt deposits, and brines from oil and gas fields and mining (Jurinak
and Suarez, 1990; Tanji, 1990b).
As primary minerals in soils and exposed rocks weather the processes of
hydrolysis, hydration, oxidation, and carbonation occur and soluble salts are
released. The primary source of soluble salts is fossil salts derived from prior
salt deposits or from entrapped solutions found in earlier marine sediments.
Salts from atmospheric deposition, both as dry and wet deposition, can
range from 100 to 200 kg year
–1
ha
–1
along seacoasts and from 10 to 20 kg
year
–1
ha
–1
in interior areas of low rainfall. The composition of the salt varies
with distance from the source. At the coast it is primarily NaCl. The salts
become higher in Ca
2+
and Mg
2+
farther inland (Bresler et al., 1982).
Important Salinity and Sodicity Parameters
The parameters determined to characterize salt-affected soils depend primarily
on the concentrations of salts in the soil solution and the amount of exchange-
able Na
+
on the soil. Exchangeable Na
+
is determined by exchanging the Na
+
288 10 The Chemistry of Saline and Sodic Soils
from the soil with another ion such as Ca
2+
and then measuring the Na
+
in
solution by flame photometry or spectrometry (e.g., atomic absorption or
inductively coupled plasma emission spectrometries). The concentration of
salts in the solution phase can be characterized by several indices (Table 10.2)
and can be measured by evaporation, or using electroconductometric or
spectrometric techniques.
Total Dissolved Solids (TDS)
Total dissolved solids (TDS) can be measured by evaporating a known volume
of water from the solid material to dryness and weighing the residue. However,
this measurement is variable since in a particular sample various salts exist
in varying hydration states, depending on the amount of drying. Thus, if
different conditions are employed, different values for TDS will result (Bresler
et al., 1982).
TDS is a useful parameter for measuring the osmotic potential, –τ
o
, an
index of the salt tolerance of crops. For irrigation waters in the range of
5–1000 mg liter
–1
TDS, the relationship between osmotic potential and TDS
is (Bresler et al., 1982)
–τ
o
≈ –5.6 × 10
–4
× TDS (mg liter
–1
). (10.1)
Without the minus sign for osmotic potential in Eq. (10.1), one could also
use the same equation to determine osmotic pressure (τ
o
) values. Further
details on osmotic potential and osmotic pressure, as they affect plant growth,
will be discussed later in this chapter.
The TDS (in mg liter
–1
) can also be estimated by measuring an extremely
important salinity index, electrical conductivity (EC), which is discussed below,
to determine the effects of salts on plant growth. The TDS may be estimated
by multiplying EC (dS m
–1
) by 640 (for EC between 0.1 and 5.0 dS m
–1
) for
lesser saline soils and a factor of 800 (for EC > 5.0 dS m
–1
) for hypersaline
samples. The 640 and 800 are factors based on large data sets relating EC to
TDS. To obtain the total concentration of soluble cations (TSC) or total con-
centration of soluble anions (TSA), EC (dS m
–1
) is usually multiplied by a
factor of 0.1 for mol liter
–1
and a factor of 10 for mmol liter
–1
(Tanji, 1990b).
Important Salinity and Sodicity Parameters 289
TABLE 10.2. Salinity Parameters
Salinity index Units of measurement
Total dissolved solids (TDS) or total mg liter
–1
soluble salt concentration (TSS)
Total concentration of soluble cations mol
c
liter
–1
(TSC)
Total concentration of soluble anions mol
c
liter
–1
(TSA)
Electrical conductivity (EC) dS m
–1
= mmhos cm
–1
(higher saline soils);
dS m
–1
× 10
–3
or μS cm
–1
= μmhos cm
–1
(lower saline soils)
Electrical Conductivity (EC)
The preferred index to assess soil salinity is electrical conductivity. Electrical
conductivity measurements are reliable, inexpensive to do, and quick. Thus,
EC is routinely measured in many soil testing laboratories. The EC is based
on the concept that the electrical current carried by a salt solution under
standard conditions increases as the salt concentration of the solution increases.
A sample solution is placed between two electrodes of known geometry; an
electrical potential is applied across the electrodes, and the resistance (R) of
the solution between the electrodes is measured in ohms (Bresler et al., 1982).
The resistance of a conducting material (e.g., a salt solution) is inversely propor-
tional to the cross-sectional area (A) and directly proportional to the length
(L) of the conductivity cell that holds the sample and the electrodes. Specific
resistance (R
s
) is the resistance of a cube of a sample volume 1 cm on edge.
Since most commercial conductivity cells are not this large, only a portion of
R
s
is measured. This fraction is the cell constant (K = R/R
s
). The reciprocal of
resistance is conductance (C). It is expressed in reciprocal ohms or mhos. When
the cell constant is included, the conductance is converted, at the temperature
of the measurement, to specific conductance or the reciprocal of the specific
resistance (Rhoades, 1993). The specific conductance is the EC (Rhoades,
1993), expressed as
EC = 1/R
s
= K/R. (10.2)
Electrical conductivity is expressed in micromhos per centimeter (μmho cm
–1
)
or in millimhos per centimeter (mmho cm
–1
). In SI units the reciprocal of
the ohm is the siemen (S) and EC is given as S m
–1
or as decisiemens per
meter (dS m
–1
). One dS m
–1
is one mmho cm
–1
. The EC at 298 K can be
measured using the equation
EC
298
= EC
t
ƒ
t
, (10.3)
where ƒ
t
is a temperature coefficient that can be determined from the relation
ƒ
t
= 1 + 0.019 (t-298 K) and t is the temperature at which the experimental
measurement is made in degrees Kelvin (Richards, 1954).
A number of EC values can be expressed according to the method
employed: EC
e
, the EC of the extract of a saturated paste of a soil sample;
EC
p
, the EC of the soil paste itself; EC
w
, the EC of a soil solution or water
sample; and EC
a
, the EC of the bulk field soil (Rhoades, 1990).
The electrical conductivity of the extract of a saturated paste of a soil
sample (EC
e
) is a very common way to measure soil salinity. In this method,
a saturated soil paste is prepared by adding distilled water to a 200- to 400-g
sample of air-dry soil and stirring. The mixture should then stand for several
hours so that the water and soil react and the readily soluble salts dissolve.
This is necessary so that a uniformly saturated and equilibrated soil paste
results. The soil paste should shine as it reflects light, flow some when the
beaker is tipped, slide easily off a spatula, and easily consolidate when the
container is tapped after a trench is formed in the paste with the spatula. The
290 10 The Chemistry of Saline and Sodic Soils
extract of the saturation paste can be obtained by suction using a Büchner
funnel and filter paper. The EC and temperature of the extract are measured
using conductance meters/cells and thermometers and EC
298
is calculated
using Eq. (10.3).
The EC
w
values for many waters used in irrigation in the western United
States are in the range 0.15–1.50 dS m
–1
. Soil solutions and drainage waters
normally have higher EC
w
values (Richards, 1954). The EC
w
of irrigation water
< 0.7 dS m
–1
is not a problem, but an EC
w
> 3 dS m
–1
can affect the growth
of many crops (Ayers and Westcot, 1976).
It is often desirable to estimate EC based on soil solution data. Marion
and Babcock (1976) developed a relationship between EC
w
(dS m
–1
) to total
soluble salt concentration (TSS in mmol liter
–1
) and ionic concentration (C in
mmol liter
–1
), where C is corrected for ion pairs. If there is no ion complexation,
TSS = C (Jurinak and Suarez, 1990). The equations of Marion and Babcock
(1976) are
log C = 0.955 + 1.039 log EC
w
(10.4)
log TSS = 0.990 + 1.055 log EC
w
. (10.5)
These work well to 15 dS m
–1
, which covers the range of EC
e
and EC
w
for
slightly to moderately saline soils (Bresler et al., 1982).
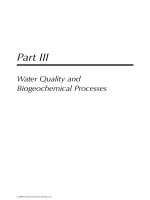
Griffin and Jurinak (1973) also developed an empirical relationship between
EC
w
and ionic strength (I) at 298 K that corrects for ion pairs and complexes
I = 0.0127 EC
w
(10.6)
where EC
w
is in dS m
–1
at 298 K. Figure 10.2 shows the straight line rela-
tionship between I and EC
w
predicted by Eq. (10.6), as compared to actual
values for river waters and soil extracts.
Important Salinity and Sodicity Parameters 291
0.50
0.46
0.42
0.38
0.34
0.30
0.26
0.22
0.18
0.14
0.10
0.06
0.02
0
0 2 4 6 8 10 12 14 16 18 20 22 24 26 28 30 32 34
River waters
Soil extracts
I = 0.0127 EC
r = 0.996
Electrical conductivity, dS m
-1
Ionic strength, mol L
-1
FIGURE 10.2. Relationship between ionic strength and electrical
conductivity of natural aqueous solutions. •, River waters; +, soil
extracts. From Griffin and Jurinak (1973), with permission.
In addition to measuring EC and other salinity indices in the laboratory,
it is often important in the management of salt-affected soils, particularly those
that are irrigated, to measure, monitor, and map soil salinity of large soil areas
(Rhoades, 1993). This would assist in ascertaining the degree of salinity, in
determining areas of under- and overirrigation, and in predicting trends in
salinity. There are a number of rapid instrumental techniques for determining
EC and computer-based mapping techniques that allow one to measure soil
salinity over large areas. The use of geographic information systems (GIS) and
remote sensing techniques will also augment these techniques.
There are three types of soil conductivity sensors that can measure bulk
soil electrical conductivity (EC
a
): a four-electrode sensor, an electromagnetic
induction sensor, and a sensor based on time domain reflectometry technology.
These are comprehensively discussed in Rhoades (1993).
Parameters for Measuring the Sodic Hazard
There are several important parameters commonly used to assess the status
of Na
+
in the solution and on the exchanger phases. These are the sodium
adsorption ratio (SAR), the exchangeable sodium ratio (ESR), and the
exchangeable sodium percentage (ESP). The SAR is commonly measured
using the equation
SAR = [Na
+
]/[Ca
2+
+ Mg
2+
]
1/2
, (10.7)
where brackets indicate the total concentration of the ions expressed in mmol
liter
–1
in the solution phase.
Total concentrations, not activities, are used in Eq. (10.7), and thus the
SAR expression does not consider decreases in free ion concentrations and
activities due to ion pair or complex formation (Sposito and Mattigod, 1977),
which can be significant with Ca
2+
and Mg
2+
.
One also notes that in Eq. (10.7) Ca
2+
and Mg
2+
are treated as if they
were the same species. There is not a theoretical basis for this other than the
observation that ion valence is more important in predicting ion exchange
phenomena than ion size. The concentration of Ca
2+
is much higher than that
of Mg
2+
in many waters (Bresler et al., 1982).
Equation (10.7) can be simplified since Na
+
, Ca
2+
, and Mg
2+
are the most
common exchangeable ions in arid soils (Jurinak and Suarez, 1990) to
[Na-soil]
= k′
G
SAR = ESR,
(10.8)
CEC – [Na-soil]
where the concentration of the ions on the exchanger phase and CEC are
expressed in mol
c
kg
–1
, k′
G
, is the modified Gapon selectivity coefficient (see
Chapter 6), and ESR is the exchangeable Na
+
ratio (Richards, 1954). The
k′
G
, expressed in (mmol liter
–1
)
–1/2
, is
[Na-soil][Ca
2+
+ Mg
2+
]
1/2
,
(10.9)
[Ca-soil + Mg-soil][Na
+
]
292 10 The Chemistry of Saline and Sodic Soils
Important Salinity and Sodicity Parameters 293
where the concentrations of Ca
2+
and Mg
2+
on the exchanger phase are
expressed in cmol
c
kg
–1
.
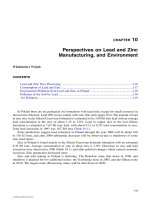
The U.S. Salinity Lab (Richards, 1954) reported a linear regression equation
between ESR and SAR as ESR = –0.0126 + 0.014645 SAR with a correlation
coefficient for 59 soils from the western United States of 0.923 (Fig. 10.3).
Bower and Hatcher (1964) improved the relationship by adding ranges in the
saturation extract salt concentration. The value of k′
G
can be determined from
the slope of the ESR–SAR linear relationship (Richards, 1954). The k′
G
describes
Na–Ca exchange well over the range of 0–40% exchangeable sodium percent-
age (ESP) where ESP = [Na-soil] × 100/CEC and has an average value of 0.015
for many irrigated soils from the western United States (Richards, 1954).
In terms of the ESP, Eq. (10.8) is (Richards, 1954; Jurinak and Suarez, 1990)
ESP/100 – ESP = k′
G
SAR = ESR. (10.10)
Soils with an ESP >30 are very impermeable, which seriously affects plant
growth. For many soils the numerical values of the ESP of the soil and the
SAR of the soil solution are approximately equal up to ESP levels of 25 to 30.
While the ESP is used as a criterion for classification of sodic soils with
an ESP of <15, indicating a nonsodic soil, and an ESP >15, indicating a sodic
soil, the accuracy of the number is often a problem due to errors that may
arise in measurement of CEC and exchangeable Na
+
. Therefore, the more
easily obtained SAR of the saturation extract should be used to diagnose the
sodic hazard of soils. Although ESP and SAR are not precisely equal numeri-
cally, an SAR of 15 has also been used as the dividing line between sodic and
nonsodic soils. However, the quantity and type of clay present in the soil are
considerations in assessing how SAR and ESP values affect soil sodicity. For
1.00
0.75
0.50
0.25
0
10 20
30
40 50 60
Exchangeable Sodium Ratio, ES/(CEC-ES)
Sodium Adsorption Ratio, SAR
y = -0.0126 + 0.01475x
r = 0.923 r
2
= 0.852
FIGURE 10.3. Exchangeable sodium ratio
(ESR) as related to the sodium adsorption
ratio (SAR) of the saturation extract.
ES, exchangeable sodium; CEC, cation
exchange capacity. From Richards (1954).
294 10 The Chemistry of Saline and Sodic Soils
example, a higher SAR value may be of less concern if the soil has a low clay
content or contains low quantities of smectite.
Classification and Reclamation of Saline and
Sodic Soils
Saline Soils
Saline soils have traditionally been classified as those in which the EC
e
of the
saturation extract is >4 dS m
–1
and ESP <15%. Some scientists have recom-
mended that the EC
e
limit for saline soils be lowered to 2 dS m
–1
as many
crops, particularly fruits and ornamentals, can be harmed by salinity in the
range of 2–4 dS m
–1
.
The major problem with saline soils is the presence of soluble salts, primarily
Cl
–
, SO
2–
4
, and sometimes NO
–
3
. Salts of low solubility, such as CaSO
4
and
CaCO
3
, may also be present. Because exchangeable Na
+
is not a problem, saline
soils are usually flocculated and water permeability is good (Richards, 1954).
Saline soils can be reclaimed by leaching them with good-quality (low
electrolyte concentration) water. The water causes dissolution of the salts and
their removal from the root zone. For successful reclamation, salinity should
be reduced in the top 45 to 60 cm of the soil to below the threshold values
for the particular crop being grown (Keren and Miyamoto, 1990). Reclama-
tion can be hampered by several factors (Bresler et al., 1982): restricted
drainage caused by a high water table, low soil hydraulic conductivity due to
restrictive soil layers, lack of good-quality water, and the high cost of good-
quality water.
Sodic Soils
Sodic soils have an ESP >15, the EC
e
is <4 dS m
–1
, and the lower limit of the
saturation extract SAR is 13. Consequently, Na
+
is the major problem in
these soils. The high amount of Na
+
in these soils, along with the low EC
e
,
results in dispersion. Clay dispersion occurs when the electrolyte concentration
decreases below the flocculation value of the clay (Keren and Miyamoto,
1990). Sodium-affected soils, which contain low levels of salt, have weak
structural stability, and low hydraulic conductivities (HC) and infiltration rates
(IR). These poor physical properties result in decreased crop productivity
caused by poor aeration and reduced water supply. Low infiltration rates can
also cause severe soil erosion (Sumner et al., 1998). Sodic soils have a pH
between 8.5 and 10. The high pH is due to hydrolysis of Na
2
CO
3
. The
major anions in the soil solution of sodic soils are Cl
–
, SO
–
4
, and HCO
–
3
,
with lesser amounts of CO
2–
3
. Since the pH is high and CO
2–
3
is present,
Ca
2+
and Mg
2+
are precipitated, and therefore soil solution Ca
2+
and Mg
2+
are low. Besides Na
+
, another exchangeable and soluble cation that may occur
in these soils is K
+
(Richards, 1954).
Effects of Soil Salinity and Sodicity on Soil Structural Properties 295
Historically, sodic soils were often called black alkali soils, which refers
to the dispersion and dissolution of humic substances, resulting in a dark
color. Sodic soils may be coarser-textured on the surface and have higher clay
contents in the subsurface horizon due to leaching of clay material that is
Na
+
-saturated. Consequently, the subsoil is dispersed, permeability is low, and
a prismatic soil structure may result.
In sodic soils reclamation is effected by applying gypsum (CaSO
4
· 2H
2
O)
or CaCl
2
to remove the exchangeable Na
+
. The Ca
2+
exchanges with the Na
+
,
which is then leached out as a soluble salt, Na
2
SO
4
or NaCl. The CaSO
4
and
CaCl
2
also increase permeability by increasing electrolyte concentration. Sulfur
can also be applied to correct a sodium problem in calcareous soils (where
CaCO
3
is present). Sulfuric acid can also be used to correct sodium problems
in calcareous soils.
Saline–Sodic Soils
Saline–sodic soils have an EC
e
>4 dS m
–1
and an ESP >15. Thus, both soluble
salts and exchangeable Na
+
are high in these soils. Since electrolyte concen-
tration is high, the soil pH is usually <8.5 and the soil is flocculated. However,
if the soluble salts are leached out, usually Na
+
becomes an even greater
problem and the soil pH rises to >8.5 and the soil can become dispersed
(Richards, 1954).
In saline–sodic soils reclamation involves the addition of good-quality
water to remove excess soluble salts and the use of a Ca
2+
source (CaSO
4
·
2H
2
O or CaCl
2
) to exchange Na
+
from the soil as a soluble salt, Na
2
SO
4
. In
saline–sodic soils a saltwater-dilution method is usually effective in reclama-
tion. In this method the soil is rapidly leached with water that has a high elec-
trolyte concentration with large quantities of Ca
2+
and Mg
2+
. After leaching,
and the removal of Na
+
from the exchanger phase of the soil, the soil is leached
with water of lower electrolyte concentration to remove the excess salts.
In both saline–sodic and sodic soils the cost and availability of a Ca
2+
source
are major factors in reclamation. It is also important that the Ca
2+
source fully
react with the soil. Thus, it is better to incorporate the Ca
2+
source into the
soil rather than just putting it on the surface so that Na
+
exchange from the
soil exchanger phase is enhanced. Gypsum can also be added to irrigation
water to increase the Ca/Na ratio of the water and improve reclamation
(Keren and Miyamoto, 1990).
Effects of Soil Salinity and Sodicity on Soil
Structural Properties
Soil salinity and sodicity can have a major effect on the structure of soils. Soil
structure, or the arrangement of soil particles, is critical in affecting permeability
and infiltration. Infiltration refers to the “downward entry of water into the
296 10 The Chemistry of Saline and Sodic Soils
soil through the soil surface” (Glossary of Soil Science Terms, 1997). If a soil
has high quantities of Na
+
and the EC is low, soil permeability, hydraulic
conductivity, and the infiltration rate are decreased due to swelling and disper-
sion of clays and slaking of aggregates (Shainberg, 1990). Infiltration rate can
be defined as “the volume flux of water flowing into the soil profile per unit
of surface area” (Shainberg, 1990). Typically, soil infiltration rates are initially
high, if the soil is dry, and then they decrease until a steady state is reached.
Swelling causes the soil pores to become more narrow (McNeal and Coleman,
1966), and slaking reduces the number of macropores through which water
and solutes can flow, resulting in the plugging of pores by the dispersed clay.
The swelling of clay has a pronounced effect on permeability and is affected
by clay mineralogy, the kind of ions adsorbed on the clays, and the electrolyte
concentration in solution (Shainberg et al., 1971; Oster et al., 1980; Goldberg
and Glaubig, 1987). Swelling is greatest for smectite clays that are Na
+
-saturated.
As the electrolyte concentration decreases, clay swelling increases.
As ESP increases, particularly above 15, swelling clays like montmorillonite
retain a greater volume of water (Fig. 10.4). Hydraulic conductivity and perme-
ability decrease as ESP increases and salt concentration decreases (Quirk and
Schofield, 1955; McNeal and Coleman, 1966). Permeability can be maintained
if the EC of the percolating water is above a threshold level, which is the
concentration of salt in the percolating solution, which causes a 10 to 15%
decrease in soil permeability at a particular ESP (Shainberg, 1990).
Effects of Soil Salinity on Plant Growth
Salinity and sodicity have pronounced effects on the growth of plants
(Fig. 10.5). Sodicity can cause toxicity to plants and create mineral nutrition
6.0
5.0
4.0
3.0
2.0
1.0
0
0 20406080100
3.45 x 10
4
Pa
6.90 x 10
4
Pa
1.38 x 10
5
Pa
2.76 x 10
5
Pa
5.52 x 10
5
Pa
Moisture Retained, cm
3
g
-1
Exchangeable Sodium Percentage, ESP
Ca
Na
FIGURE 10.4. Water retention as a function
of ESP and pressure applied on montmorillonite.
From Shainberg et al. (1971), with permission.
problems such as Ca
2+
deficiencies. In saline soils soluble ions such as Cl
–
,
SO
2–
4
, HCO
–
3
, Na
+
, Ca
2+
, Mg
2+
, and sometimes NO
–
3
and K
+
can harm plants
by reducing the osmotic potential. However, plant species, and even different
varieties within a particular species, will differ in their tolerance to a particular
ion (Bresler et al., 1982).
Soil water availability can be expressed as the sum of the matric and
osmotic potentials. As the water content decreases, through evaporation and
transpiration, both the matric and osmotic potentials decrease and are more
negative (Läuchli and Epstein, 1990). The soluble ions cause an osmotic pres-
sure effect. The osmotic pressure of the soil solution (τ
o
) in kPa, which is a
useful index for predicting the effect of salinity on plant growth, is calculated
from (Jurinak and Suarez, 1990)
τ
o
= 2480 Σ
i
m
i
v
i
φ
i
, (10.11)
where m
i
is the molal concentration of the ith ion, φ
i
is the osmotic coeffi-
cient of the ith salt, and v
i
is the stoichiometric number of ions yielded by
the ith salt. The relationship between τ
o
and EC at 298 K is (Jurinak and
Suarez, 1990)
τ
o
(kPa) = 40EC. (10.12)
At 273 K, the proportionality constant in Eq. (10.12) is 36 (Richards, 1954).
The tolerance of plants to salts can be expressed as (Maas, 1990;
Rhoades, 1990)
Y
r
= 100 – b(EC
e
– a), (10.13)
Effects of Soil Salinity on Plant Growth 297
FIGURE 10.5. Effects of salinity and sodicity on plants. From Läuchli, A.,
and Epstein, E. (1990a), Plant response to saline and sodic conditions,
in “Agricultural Salinity Assessment and Management” (K. K. Tanji, Ed.),
pp. 113–137. Am. Soc. Civ. Eng., New York. Reprinted by permission of the ASCE.
Salinity
Specific ion
effects
Toxicity Essentiality
for growth;
specific
functions
Disturbed
mineral
nutrition
Disturbed
water
relations
Osmotic
effects
Succulence;
growth
stimulation;
high total
dissolved
solids in
fruit
Sodicity
where Y
r
is the percentage of the yield of the crop grown under saline condi-
tions compared to that obtained under nonsaline, but otherwise comparable
conditions, a is the threshold level of soil salinity at which yield decreases
begin, and b is the percentage yield loss per increase of salinity in excess of a.
The effect of salinity on plant growth is affected by climate, soil condi-
tions, agronomic practices, irrigation management, crop type and variety, stage
of growth, and salt composition (Maas and Hoffman, 1977; Rhoades, 1990).
Salinity does not usually affect the yield of a crop until the EC
e
exceeds a
certain value for each crop. This is known as the threshold salinity level or
the threshold EC
e
value, which differs for various crops (Table 10.3). The
yields of many crops, for example, most food and fiber crops, will linearly
decrease as EC
e
increases. Maas and Hoffman (1977) divided plants into five
different tolerance categories based on EC
e
(Fig. 10.6).
Effects of Sodicity and Salinity on Environmental
Quality
Degradation of soils by salinity and sodicity profoundly affects environmental
quality. In particular, the dispersive behavior of sodic soils, coupled with human
activities such as agriculture, forestry, urbanization, and soil contamination,
can have dire effects on the environment and humankind. The enhanced
dispersion promotes surface crusts or seals, which lead to waterlogging,
298 10 The Chemistry of Saline and Sodic Soils
FIGURE 10.6. Divisions for classifying crop tolerance to salinity.
From Maas, E. V., and Hoffman, G. J. (1977), Crop salt tolerance—
Current assessment, J. Irrig. Drain Div., Am. Soc. Civ. Eng. 103(IR 2),
114–134. Reprinted by permission of the ASCE.
100
80
60
40
20
0
0 5 10 15 20 25 30 35
Relative Crop Yield (%)
EC
e
, dS m
-1
Sensitive Moderately
Sensitive
Moderately
Tolerant
Tolerant Unsuitable
for Crops
Crop Selection
surface runoff, and erosion. Consequently, high levels of inorganic and organic
colloids can be mobilized, which can transport organic and inorganic contami-
nants such as pesticides, metals, and radionuclides in soils and waters (Sumner
et al., 1998).
The enhanced erosion potential of sodic soils also results in increased
sediments that can contaminate waters. Suspended sediments in water increase
turbidity. This causes less light to pass through, which negatively affects
aquatic life. Additionally, increased levels of dissolved organic carbon (DOC)
generated in sodic soils can discolor water (Sumner et al., 1998).
Salinization of soils results in soluble salts that can be mobilized in soil
profiles, causing land and water degradation. The salts can also effect release
and solubilization of heavy metals into solution, with potential adverse effects
on water quality and plant growth (Gambrell et al., 1991; McLaughlin and
Tiller, 1994).
Suggested Reading
Ayers, R. S., and Westcot, D. W. (1976). “Water Quality for Agricultural,”
Irrig. Drain. Pap. 29. Food and Agriculture Organization of the United
Nations, Rome.
Bresler, E., McNeal, B. L., and Carter, D. L. (1982). “Saline and Sodic Soils.
Principles-Dynamics-Modeling.” Springer-Verlag, Berlin.
Effects of Sodicity and Salinity on Environmental Quality 299
TABLE 10.3. Salt Tolerance of Agronomic Crops
a
Threshold EC
e
Tolerance to
Crop (dS m
–1
) salinity
b
Reference
Fiber, grain, and special crops
Barley 8.0 T Maas and Hoffman (1977)
Corn 1.7 MS Maas and Hoffman (1977)
Cotton 7.7 T Maas and Hoffman (1977)
Peanut 3.2 MS Maas and Hoffman (1977)
Rice, paddy 3.0 S Maas and Hoffman (1977)
Rye 11.4 T François et al. (1989a)
Sorghum 6.8 MT François et al. (1984)
Soybean 5.0 MT Maas and Hoffman (1977)
Wheat 6.0 MT Maas and Hoffman (1977)
Grasses and forage crops
Alfalfa 2.0 MS Maas and Hoffman (1977)
Clover, red 1.5 MS Maas and Hoffman (1977)
Fescue, tall 3.9 MT Maas and Hoffman (1977)
Orchardgrass 1.5 MS Maas and Hoffman (1977)
Vetch 3.0 MS Maas and Hoffman (1977)
a
Adapted from Maas (1990).
b
These data serve only as a guideline to relative tolerances among crops. Absolute tolerances vary, depending on climate, soil conditions, and
cultural practices; S, sensitive; MS, moderately sensitive; MT, moderately tolerant; and T, tolerant.
Rhoades, J. D. (1993). Electrical conductivity methods for measuring and
mapping soil salinity. Adv. Agron. 49, 201–251.
Richards, L. A., Ed. (1954). “Diagnosis and Improvement of Saline and Sodic
Soils,” USDA Agric. Handb. 60. USDA, Washington, DC.
Sumner, M. E., and Naidu, R. (1998). “Sodic Soils: Distribution, Properties,
Management and Environmental Consequences.” Oxford Univ. Press,
New York.
Tanji, K. K., Ed. (1990). “Agricultural Salinity Assessment and Management,”
ASCE Manuals Rep. Eng. Pract. 71. Am. Soc. Civ. Eng., New York.
Yaron, D., Ed. (1981). “Salinity in Irrigation and Water Resources.” Dekker,
New York.
300 10 The Chemistry of Saline and Sodic Soils
He
Ne
Ar
Kr
Xe
Rn
F
Cl
Br
I
At
O
S
Se
Te
Po
N
P
As
Sb
Bi
C
Si
Ge
Sn
Pb
B
Al
Ga
In
Tl
Zn
Cd
Hg
Cu
Ag
Au
Ni
Pd
Pt
Co
Rh
Ir
Fe
Ru
Os
Mn
Tc
Re
Cr
Mo
W
V
Nb
Ta
Ti
Zr
Hf
Sc
Y
La
Be
Mg
Ca
Sr
Ba
Li
Na
K
Rb
Cs
H
AcRaFr
24 25 26 27 28 29 30 31 32 33 34 35 36
42 43 44 45 46 47 48 49 50 51 52 53 54
74 75 76 77 78 79 80 81 82 83 84 85 86
19 20 21 22 23
37 38 39 40 41
55 56 57 72 73
87 88 89
UnhUnpUnq
104 105 106
Uns
107
13 14 15 16 17 18
5678910
2
11 12
34
1
1.0079
6.941
22.9898
39.0983
85.4678
132.905
(223)
9.01218
24.305
40.08
87.62
137.33
226.025
44.9559
88.9059
138.906
227.028
47.88
91.224
178.49
(261)
50.9415
92.9064
180.948
(262)
51.996
95.94
183.85
(263)
54.9380
(98)
186.207
(262)
55.847
101.07
190.2
58.9332
102.906
192.22
58.69
106.42
195.08
63.546
107.868
196.967
65.38
112.41
200.59
10.81
26.9815
69.72
114.82
204.383
12.011
28.0855
72.59
118.71
207.2
14.0067
30.9738
74.9216
121.75
208.980
15.9994
32.06
78.96
127.60
(209)
18.9984
35.453
79.904
126.905
(210)
20.179
39.948
83.80
131.29
(222)
4.00260
aaaa
Lanthanide
series
Actinide
series
NdPrCe EuSmPm Gd
140.12 140.908 144.24 (145) 150.36 151.96 157.25
58 59 60 61 62 63 64
HoDyTb YbTmEr Lu
158.925 162.50 164.930 167.26 168.934 173.04 174.967
65 66 67 68 69 70 71
UPaTh AmPuNp Cm
232.038 231.036 238.029 237.048 (244) (243) (247)
90 91 92 93 94 95 96
EsCfBk NoMdFm Lr
(247) (251) (252) (257) (258) (259) (260)
97 98 99 100 101 102 103
1
IA
Group
2
IIA
3
IIIB
IIIA
4
IVB
IVA
5
VB
VA
6
VIB
VIA
7
VIIB
VIIA
89
VIII
VIIIA
10 11
IB
12
IIB
13
IIIA
IIIB
14
IVA
IVB
15
VA
VB
16
VIA
VIB
17
VIIA
VIIB
18
VIIIA
New notation
Previous IUPAC form
CAS version
NOTE: Atomic masses shown here are the 1983 IUPAC values (maximum of six significant figures).
a Symbols based on IUPAC systematic names.
Source: F.A. Cotton and G.W. Wilkinson, Advanced Inorganic Chemistry, 5th ed., Wiley, New York, 1988, endpapers.
Appendix A: Periodic Table of the Elements
301
This Page Intentionally Left Blank
303
References
Abendroth, R.P. (1970). Behavior of a pyrogenic silica in simple electrolytes. J. Colloid
Interface Sci. 34, 591–596.
Acton, C.J., Paul, E.A., and Rennie, D.A. (1963). Measurements of the polysaccharide
content of soils. Can. J. Soil Sci. 43, 141–150.
Adams, F. (1971). Ionic concentrations and activities in the soil solution. Soil Sci. Soc.
Am. Proc. 35, 420–426.
Adams, F., ed. (1984). “Soil Acidity and Liming.” Agronomy 12. Am. Soc. Agron.,
Madison, WI.
Adriano, D.C. (1986). “Trace Elements in the Terrestrial Environment.” Springer-Verlag,
New York.
Aharoni, C. (1984). Kinetics of adsorption: The S-shaped Z(t) plot. Adsorpt. Sci.
Technol. 1, 1–29.
Aharoni, C., and Sparks, D.L. (1991). Kinetics of soil chemical reactions: A theoretical
treatment. In “Rates of Soil Chemical Processes” (D.L. Sparks and D.L. Suarez,
eds.), SSSA Spec. Publ. No. 27, pp. 1–18, Soil Sci. Soc. Am., Madison, WI.
Aharoni, C., and Suzin, Y. (1982a). Application of the Elovich equation to the kinetics
of occlusion: Part 1. Homogenous microporosity. J. Chem. Soc., Faraday Trans. 1
78, 2313–2320.
Aharoni, C., and Suzin, Y. (1982b). Application of the Elovich equation to the kinetics
of occlusion: Part 3. Heterogenous microporosity. J. Chem. Soc., Faraday Trans. 1
78, 2329–2336.
Aharoni, C., and Ungarish, M. (1976). Kinetics of activated chemisorption. Part 1. The
non-Elovichian part of the isotherm. J. Chem. Soc., Faraday Trans. 172, 400–408.
Aiken, G.R., McKnight, D.M., and Wershaw, R.L., eds. (1985a). “Humic Substances
in Soil, Sediments, and Water.” John Wiley & Sons (Interscience), New York.
Aiken, G.R., McKnight, D.M., Wershaw, R.L., and MacCarthy, P. (1985b).
An introduction to humic substances in soil, sediment, and water. In “Humic
Substances in Soil, Sediments, and Water” (G.R. Aiken, D.M. McKnight,
R.L. Wershaw, eds.), pp. 1–9. John Wiley & Sons (Interscience), New York.
Ainsworth, C. C., Pilou, J. L., Gassman, P. L., and Van Der Sluys, W. G. (1994).
Cobalt, cadmium, and lead sorption to hydrous iron oxide: Residence time effect.
Soil Sci. Soc. Am. J. 58, 1615–1623.
Alexander, M. (1995). How toxic are toxic chemicals in soils? Environ. Sci. Technol. 29,
2713–2717.
Alexander, M. (2000). Aging, bioavailability, and overestimation of risk from
environmental pollutants. Environ. Sci. Technol. 34, 4259–4265.
Allmann, R. (1970). Doppelschichtstrukturen mit brucitaehnlichen Schichtionen
[Me(II)
1-x
Me(III)
x
(OH)
2
]
x+
. Chimia 24, 99–108.
Altaner, S.P., Weiss, C.A. and Kirkpatrick, R.J. 1988. Evidence from
29
Si NMR for the
structure of mixed-layer illite/smectite clay minerals. Nature 331: 699–702.
Altug, I., and Hair, M.L. (1967). Cation exchange in porous glass. J. Phys. Chem. 71,
4260–4263.
Amacher, M.C. (1991). Methods of obtaining and analyzing kinetic data. In “Rates of
Soil Chemical Processes” (D.L. Sparks and D.L. Suarez, eds.) SSSA Spec. Publ.
No. 27, pp. 19–59. Soil Sci. Soc. Am., Madison, WI.
Amacher, M.C., and Baker, D.E. (1982). “Redox Reactions Involving Chromium,
Plutonium, and Manganese in Soils,” DOE/DP/04515-1. Penn. State University,
University Park, PA.
Anderson, M.A., and Rubin, A.J., eds. (1981). “Adsorption of Inorganics at Solid-Liquid
Interfaces.” Ann Arbor Sci., Ann Arbor, MI.
Arai, Y., Elzinga, E.J., and Sparks, D.L. (2001). X-ray absorption spectroscopic
investigation of arsenite and arsenate adsorption at the aluminum oxide-water
interface. J. Colloid Interf. Sci. 235, 80–88.
Arai, Y., and Sparks, D.L. (2001). ATR-FTIR spectroscopic investigation on phosphate
adsorption mechanisms at the ferrihydrite-water interface. J. Colloid Interf. Sci.
241, 317–326.
Argersinger, W.J., Davidson, A.W., and Bonner, O.D. (1950). Thermodynamics and
ion exchange phenomena. Trans. Kans. Acad. Sci. 53, 404–410.
Arshad, M.A., Ripmeester, J.A., and Schnitzer, M. (1988). Attempts to improve solid-
state
13
C NMR spectra of whole mineral soils. Can J. Soil. Sci. 68, 593–602.
Atkinson, R.J., Hingston, F.J., Posner, A.M., and Quirk, J.P. (1970). Elovich equation
for the kinetics of isotope exchange reactions at solid-liquid interfaces. Nature
(London) 226, 148–149.
Axe, L., Bunker, G.B., Anderson, P.R., and Tyson, T.A. (1997). An XAFS analysis of
strontium at the hydrous ferric oxide surface. J. Colloid Interf. Sci. 199, 44–52.
Ayers, R.S., and Westcot, D.W. (1976). “Water Quality for Agriculture,” Irrig. Drain.
Pap. No. 29, Food and Agriculture Organization of the United Nations, Rome.
Baas Becking, L.G.M., Kaplan, I.R., and Moore, D. (1960). Limits of the natural
environment in terms of plant and oxidation-reduction potentials. J. Geol. 68,
243–284.
Babcock, K.L. (1963). Theory of the chemical properties of soil colloidal systems at
equilibrium. Hilgardia 34, 417–542.
Babcock, K.L., and Doner, H.E. (1981). A macroscopic basis for soil chemistry.
Soil Sci. 131, 276–283.
Backes, C. A., McLaren , R. G., Rate, A. W., and Swift, R. S. (1995). Kinetics of
cadmium and cobalt desorption from iron and manganese oxides. Soil Sci. Soc.
Am. J. 59, 778–785.
Baes, C.F., Jr., and Mesmer, R.E. (1976). “The Hydrolysis of Cations.” John Wiley &
Sons, New York.
Baham, J. (1984). Prediction of ion activities in soil solutions: Computer equilibrium
modeling. Soil Sci. Soc. Am. J. 48, 523–531.
Bailey, G.W., and White, J.L. (1970). Factors influencing the adsorption, desorption,
and movement of pesticides in soil. Residue Rev. 32, 29–92.
304 References
Baker, W.E. (1973). The role of humic acids from Tasmania podzolic soils in mineral
degradation and metal mobilization. Geochim. Cosmochim. Acta 37, 269–281.
Ball, J.W., Jenne, E.A., and Nordstrom, D.K. (1979). WATEQ2 – a computerized
chemical model for trace and major element speciation and mineral equilibria of
natural waters. In “Chemical Modeling in Aqueous Systems” (E.A. Jenne, ed.), Am.
Chem. Soc. Symp. Series No. 93, pp. 815–835. Am. Chem. Soc., Washington, D.C.
Ball, J.W., Jenne, E.A., and Cantrell, M.W. (1981). “WATEQ3: A geochemical model
with uranium added,” US Geol. Surv. Open-File Rep. 81–1183.
Ball, W.P. (1989). Equilibrium sorption and diffusion rate studies with halogenated
organic chemicals and sandy aquifer materials. Ph.D. Dissertation, Stanford
University, Palo Alto, CA.
Ball, W.P., and Roberts, P.V. (1991). Long-term sorption of halogenated organic
chemicals by aquifer material: 1. Equilibrium. Environ. Sci. Technol. 25[7],
1223–1236.
Ballard, T.M. (1971). Role of humic carrier substances in DDT movement through
forest soil. Soil Sci. Soc. Am. Proc. 35, 145–147.
Bargar, J.R., Brown, G.E., Jr., and Parks, G.A. (1997a). Surface complexation of Pb(II)
at oxide-water interfaces: I. XAFS and bond-valence determination of
mononuclear and polynuclear Pb(II) sorption products on aluminum oxides.
Geochim. Cosmochim. Acta. 61(13), 2617–2637.
Bargar, J.R., Brown, G.E., Jr., and Parks, G.A. (1997b). Surface complexation of Pb(II)
at oxide-water interfaces: II. XAFS and bond-valence determination of
mononuclear Pb(II) sorption products and surface functional groups on iron
oxides. Geochim. Cosmochim. Acta 61(13), 2639–2652.
Bargar, J.R., Towle, S.N., Brown, G.E., Jr., and Parks, G.A. (1996). Outer-sphere
Pb(II) at specific surface sites on single crystal α-alumina. Geochim. Cosmochim.
Acta. 60(18), 3541–3547.
Barnes, I., and Clarke, F.E. (1969). “Chemical properties of ground water and their
corrosion and encrustation effects on wells,” US Geol. Surv. Prof. Pap. 498-D.
Barrer, R.M., and Klinowski, J. (1974). Ion-exchange selectivity and electrolyte
concentration. J. Chem. Soc., Faraday Trans. 1 70, 2080–2091.
Barrow, N. J. (1986). Testing a mechanistic model: II. The effects of time and
temperature on the reaction of zinc with a soil. J. Soil Sci. 37, 277–286.
Barrow, N.J. (1985). Reactions of anions and cations with variable-charged soils.
Adv. Agron. 38, 183–230.
Barrow, N.J., Bowden, J.W., Posner, A.M., and Quirk, J.P. (1980). An objective
method for fitting models of ion adsorption on variable charge surfaces.
Aust. J. Soil Res. 18, 37–47.
Barrow, N.J., Bowden, J.W., Posner, A.M., and Quirk, J.P. (1981). Describing the
adsorption of copper, zinc and lead on a variable charge mineral surface.
Aust. J. Soil Res. 19, 309–321.
Bar-Tal, A., Sparks, D.L., Pesek, J.D., and Feigenbaum, S. (1990). Analyses of
adsorption kinetics using a stirred-flow chamber: I. Theory and critical tests.
Soil Sci. Soc. Am. J. 54, 1273–1278.
Bartell, F.E., and Fu, Y. (1929). Adsorption from aqueous solutions by silica.
J. Phys. Chem. 33, 676–687.
References 305
Bartlett, R.J. (1981). Nonmicrobial nitrite-to-nitrate transformation in soils.
Soil Sci. Soc. Am. J. 45, 1054–1058.
Bartlett, R.J. (1986). Soil redox behavior. In “Soil Physical Chemistry” (D.L. Sparks,
ed.), pp. 179–207. CRC Press, Boca Raton, FL.
Bartlett, R.J., and James, B.R. (1979). Behavior of chromium in soils. III. Oxidation.
J. Environ. Qual. 8, 31–35.
Bartlett, R.J., and James, B.R. (1993). Redox chemistry of soils. Adv. Agron. 50,
151–208.
Batjes, N.H. (1996). Total C and N in the soils of the world. Eur. J. Soil. Sci. 47,
151–163.
Bell, L.C., Posner, A.M., and Quirk, J.P. (1973). The point of zero charge of
hydroxyapatite and fluorapatite in aqueous solutions. J. Colloid Interf.
Sci. 42, 250–261.
Bell, A.T. (1980). Applications of fourier transform infrared spectroscopy to studies of
adsorbed species. In “Vibrational Spectroscopies for Adsorbed Species” (A.T. Bell
and M.L. Hair, eds.), ASC Symp. Ser. 37:13–35. Washington, DC.
Belot, Y., Gailledreau, C., and Rzekiecki, R. (1966). Retention of strontium-90,
calcium-45, and barium-140 by aluminum oxide of large area. Health Phys.
12, 811–823.
Berggren, B., and Oden, S. (1972). “Analysresultat Rorande Fungmetaller Och Kloerade
Kolvaten I Rotslam Fran Svenska Reningsverk 1968-1971.” Institutione fur
Markvetenskap Lantbrukshogskolan, Uppsala, Sweden.
Bernasconi, E.C. (1976). “Relaxation Kinetics.” Academic Press, New York.
Berrow, M.L., and Webber, J. (1972). Trace elements in sewage sludges. J. Sci. Food
Agric. 23[1], 93–100.
Berry, L.G., and Mason, B. (1959). “Mineralogy-Concepts, Descriptions,
Determinations.” Freeman, San Francisco.
Bertsch, P.M. (1987). Conditions for Al
13
polymer formation in partially neutralized Al
solutions. Soil Sci. Soc. Am. J. 51, 825–828.
Bertsch, P.M. (1989). Aqueous polynuclear aluminum species. In “The Environmental
Chemistry of Aluminum” (G. Sposito, ed.), pp. 87–115. CRC Press, Boca Raton,
FL.
Bertsch, P.M., and Bloom, P.R. (1996). Aluminum. In “Methods of Soil Analysis,
Part 3 – Chemical Methods” (D.L. Sparks, ed.), pp. 517–550. Soil Sci. Soc. Am.
Book Series 5, SSSA, Madison, WI.
Bertsch, P.M., and Hunter, D. B., (1998). Elucidating fundamental mechanisms in soil
and environmental chemistry. The role of advanced analytical, spectroscopic and
microscopic methods. In “Future Prospects for Soil Chemistry” (P.M. Huang,
D. L. Sparks and S.A. Boyd, eds.), Soil Sci. Soc. Amer. Spec. Publ. No. 55,
pp. 103–122, SSSA, Madison, WI.
Bertsch, P.M. and Parker, D.R. (1996). Aqueous polynuclear aluminum species.
In “The Environmental Chemistry of Aluminum” 2
nd
ed. (G. Sposito, ed.),
pp. 117–168. CRC Press, Boca Raton, FL.
Bérubé, Y.G., and de Bruyn, P.L. (1968). Adsorption at the rutile solution interface.
I. Thermodynamic and experimental study. J. Colloid Interf. Sci. 27, 305–318.
306 References
Bleam, W.F., and McBride, M.B. (1986). The chemistry of adsorbed Cu (II) and Mn
(II) in aqueous titanium dioxide suspensions. J. Colloid Interf. Sci. 110, 335–346.
Bleam, W.F., Pfeffer, P.E., Goldberg, S., Taylor, R.W., and Dudley, R. (1991). A
31
P
solid-state nuclear magnetic resonance study of phosphate adsorption at the
boehmite/aqueous solution. Langmuir 7, 1702–1712.
Bloom, P.R., and Erich, M.S. (1987). Effect of solution composition on the rate and
mechanism of gibbsite dissolution in acid solutions. Soil Sci. Soc. Am. J. 51,
1131–1136.
Bochatay, L., Persson, P., and Sjöberg, S. (2000a). Metal ion coordination at the water-
manganite (γ-MnOOH) interface. I. An EXAFS study of cadmium(II). J. Colloid
Interf. Sci. 229, 584–592.
Bochatay, L., and Persson, P. (2000b). Metal ion coordination at the water-manganite
(γ-MnOOH) interface. II. An EXAFS study of zinc(II). J. Colloid Interf. Sci. 229,
593–599.
Bohn, H.L. (1968). Electromotive force of inert electrodes in soil suspensions. Soil Sci.
Soc. Am. Proc. 32, 211–215.
Bohn, H.L., McNeal, B.L., and O’Conner, G.A. (1985). “Soil Chemistry.” 2
nd
ed.
John Wiley & Sons, New York.
Bolt, G.H., ed. (1979). “Soil Chemistry. B: Physico-Chemical Models.” Elsevier,
Amsterdam.
Bolt, G.H., de Boodt, M.E., Hayes, M.H.B., and McBride, M.B., eds. (1991).
“Interactions at the Soil Colloid-Soil Solution Interface.” NATO ASI Ser. E.
Vol. 190. Kluwer Academic Publishers, Dordrecht, The Netherlands.
Bolt, G.H., and van Riemsdijk, W.H. (1982). Ion adsorption on inorganic variable
charge constituents. In “Soil Chemistry. Part B. Physico-Chemical Methods”
(G.H. Bolt, ed.), pp. 459–503. Elsevier, Amsterdam.
Bowden, J.W., Posner, A.M., and Quirk, J.P. (1977). Ionic adsorption on variable
charge mineral surfaces. Theoretical charge development and titration curves.
Aust. J. Soil Res. 15, 121–136.
Bowden, J.W., Nagarajah, S., Barrow, N.J., Posner, A.M., and Quirk, J.P. (1980).
Describing the adsorption of phosphate, citrate and selenite on a variable charge
mineral surface. Aust. J. Soil Res. 18, 49–60.
Bowen, H.J.M. (1979). “Environmental Chemistry of the Elements.” Academic Press,
London.
Bower, C.A., and Hatcher, J.T. (1964). Estimation of the exchangeable-sodium
percentage of arid zone soils from solution cation composition. In West. Soc.
Soil Sci. Abstr., Vancouver, British Columbia, Canada.
Bradfield, R. (1923). The nature of the acidity of the colloidal clay of acid soils.
J. Am. Chem. Soc. 45, 2669–2678.
Bradfield, R. (1925). The chemical nature of colloidal clay. J. Am. Soc. Agron. 17,
253–370.
Brady, N.C. (1984). “The Nature and Properties of Soils,” 9
th
ed. Macmillan,
New York.
Breeuwsma, A., and Lyklema, J. (1971). Interfacial electrochemistry of hematite
(α-Fe
2
O
3
). Disc. Faraday Soc. 522, 3224–3233.
References 307
Bresler, E., McNeal, B.L., and Carter, D.L. (1982). “Saline and Sodic Soils. Principles-
Dynamics-Modeling.” Springer-Verlag, Berlin.
Bricker, O.P. (1965). Some stability relationships in the system MnO
2
-H
2
O at 25°C
and 1 atm total pressure. Am. Mineral. 50, 1296–1354.
Brindley, G.W., and Brown, G., eds. (1980). “Crystal Structures of Clay Minerals and
Their X-ray Identification.” Monogr. No. 5. Mineralogical Society, London.
Britz, D., and Nancollas, G.H. (1969). Thermodynamics of cation exchange of
hydrous zirconia. J. Inorg. Nucl. Chem. 31, 3861–3868.
Broadbent, F.E., and Bradford, G.R. (1952). Cation exchange groupings in soil organic
fraction. Soil Sci. 74, 447–457.
Brooks, R.R., ed. (1988). “Plants that Hyperaccumulate Heavy Metals.” Cambridge
Univ. Press, Cambridge.
Brown, G. (1980). Associate minerals. In “Clay Structures of Clay Minerals and Their
X-ray Identification” (G.W. Brindley and G. Brown, eds.), Monograph No. 5,
pp. 361–410. Mineralogical Society, London.
Brown, G.E., Jr. (1990). Spectroscopic studies of chemisorption reaction mechanisms
at oxide-water interfaces. In “Mineral-Water Interface Geochemistry” (M.F.
Hochella, Jr. and A.F. White, eds.), Rev. in Mineralogy 23, pp. 309–353. Mineral
Soc. Am., Washington, D.C.
Brown, G.E., Jr., Calas, G., Waychunas, G.A. and Petiau, J. (1988). X-ray absorption
spectroscopy and its applications in mineralogy and geochemistry. In “Spectroscopic
Methods in Mineralogy and Geology” (F. Hawthorne, ed.), Rev. in Mineralogy 18,
pp. 431–512. Mineral Soc. Am., Washington, D.C.
Brown, G.E., Jr., Parks, G.A., and O’Day, P.A. (1995). Sorption at mineral-water
interfaces: Macroscopic and microscopic perspectives. In “Mineral Surfaces”
(D.J. Vaughan and R.A.D. Pattrick, eds.), pp. 129–183. Chapman and Hall,
London.
Bruemmer, G.W., Gerth, J., and Tiller, K.G. (1988). Reaction kinetics of the
adsorption and desorption of nickel, zinc and cadmium by goethite: I.
Adsorption and diffusion of metals. J. Soil Sci. 39, 37–52.
Brunauer, S., Emmett, P.H., and Teller, E. (1938). Adsorption of gases in multi-
molecular layers. J. Am. Chem. Soc. 60, 309–319.
Brunnix, E. (1975). The coprecipitation of Zn, Cd and Hg with ferric hydroxide.
Phillips Res. Repts. 30, 177–191.
Brusseau, M. L. and Rao, P. S. C. (1989). Sorption nonideality during organic
contaminant transport in porous media. CRC Critical Reviews in Environ.
Control. 19, 33–99.
Buffle, J. (1984). Natural organic matter and metal-organic interactions in aquatic
systems. In “Metal Ions in Biological Systems” (H. Sigel, ed.), pp. 165–221.
Dekker, New York.
Buffle, J., and Stumm, W. (1994). General chemistry of aquatic systems. In “Chemical
and Biological Regulation of Aquatic Systems” (J. Buffle and R.R. DeVitre, eds.),
pp. 1–42. CRC Press, Boca Raton, FL.
Bunnett, J.F. (1986). Kinetics in solution. In “Investigations of Rates and Mechanisms
of Reactions” (C.F. Bernasconi, ed.), 4
th
ed., pp. 171–250. John Wiley & Sons,
New York.
308 References
Bunzl, K., Schmidt, W., and Sansoni, B. (1976). Kinetics of ion exchange in soil
organic matter. IV. Adsorption and desorption of Pb
2+
, Cu
2+
, Zn
2+
, and Ca
2+
by peat. J. Soil Sci. 27, 32–41.
Caccavo, F., Jr., Blakemore, R.P., and Lovely, D.R. (1992). A hydrogen-oxidizing,
Fe(III)-reducing micro-organism from the Great Bay Estuary. Appl. Environ.
Microbiol. 58, 3211–3216.
Calas, G., 1988. Electron paramagnetic resonance. In “Spectroscopic Methods in
Mineralogy and Geology” (F.C. Hawthorne, Ed.), Reviews in Mineralogy 18,
513–563. Mineralogical Society of America, Washington, DC.
Carroll, K.M., Harkness, M.R., Bracco, A.A., and Balcarcel, R.B. (1994). Application
of a permeant/polymer diffusional model to the desorption of polychlorinated
biphenyls from Hudson River sediments. Environ. Sci. Technol. 28, 253–258.
Carter, D.L., Mortland, M.M., and Kemper, W.D. (1986). Specific surface. In “Methods
of Soil Analysis, Part 1 – Physical and Mineralogical Methods” (A. Klute, ed.),
2
nd
ed., pp. 413–423. Am. Soc. Agron., Madison, WI.
Casey, W.H., Westrich, H.R., Arnold, G.W., and Banfield, J.F. (1989). The surface
chemistry of dissolving labradorite feldspar. Geochim. Cosmochim. Acta 53, 821–832.
Chakravarti, S.N., and Talibudeen, O. (1961). Phosphate interaction with clay minerals.
Soil Sci. 92[4], 232–242.
Chapman, D.L. (1913). A contribution to the theory of electrocapillarity. Philos. Mag.
25[6], 475–481.
Charberek, S., and Martell, A.E. (1959). “Organic Sequestering Agents.” John Wiley
& Sons, New York.
Charlet, L., and Manceau, A.A. (1992). X-ray absorption spectroscopic study of the
sorption of Cr(III) at the oxide-water interface. II. Adsorption, coprecipitation,
and surface precipitation on hydrous ferric oxide. J. Colloid Interf. Sci. 148(2),
442–458.
Charlet, L., and Manceau, A. (1993). Structure, formation, and reactivity of hydrous
oxide particles: Insights from x-ray absorption spectroscopy. In “Environmental
Particles” (J. Buffle and A.P. vanLeeuwen, eds.), pp. 117–164. Lewis Publishers,
Boca Raton, FL.
Cheah, S.F., Brown, G.E., Jr., and Parks, G.A. (1998). XAFS spectroscopy study of
Cu(II) sorption on amorphous SiO
2
and γ-Al
2
O
3
: Effect of substrate and time on
sorption complexes. J. Colloid Interf. Sci. 208, 110–128.
Chen, Y. and Schnitzer, M. (1976), Scanning electron microscopy of a humic acid and
a fulvic acid and its metal and clay complexes. Soil Sci. Soc. Am. J. 40, 682–686.
Cheng, H.H., ed. (1990). “Pesticides in the Soil Environment: Processes, Impacts, and
Modeling.” Soil Sci. Soc. Am. Book Ser. No. 2. Soil Sci. Soc. Am., Madison, WI.
Chernov, V.A. (1947). “The Nature of Soil Acidity” (English translation furnished by
Hans Jenny-translator unknown), Press of Academy of Sciences, Moscow. Soil Sci.
Soc. Am. (1964).
Chien, S.H., and Clayton, W.R. (1980). Application of Elovich equation to the kinetics
of phosphate release and sorption in soils. Soil Sci. Soc. Am. J. 44, 265–268.
Chiou, C.T., Freed, V.H., Schmedding, D.W., and Kohnert, R.L. (1977). Partition
coefficient and bioaccumulation of selected organic compounds. Environ. Sci.
Technol. 11, 475–478.
References 309