Báo cáo khoa học: "Intracranial pressure monitoring in intensive care: clinical advantages of a computerized system over manual recording" potx
Bạn đang xem bản rút gọn của tài liệu. Xem và tải ngay bản đầy đủ của tài liệu tại đây (454.1 KB, 6 trang )
Open Access
Available online />Page 1 of 6
(page number not for citation purposes)
Vol 11 No 1
Research
Intracranial pressure monitoring in intensive care: clinical
advantages of a computerized system over manual recording
Elisa Roncati Zanier, Fabrizio Ortolano, Laura Ghisoni, Angelo Colombo, Sabina Losappio and
Nino Stocchetti
Neurosurgical Intensive Care Unit, Department of Anesthesia and Critical Care Medicine, Milan University, Ospedale Maggiore Policlinico,
Mangiagalli, e Regina Elena, Fondazione IRCCS, Via Sforza n 35, 20122 Milano, Italy
Corresponding author: Elisa Roncati Zanier,
Received: 19 Oct 2006 Revisions requested: 29 Nov 2006 Revisions received: 20 Dec 2006 Accepted: 18 Jan 2007 Published: 18 Jan 2007
Critical Care 2007, 11:R7 (doi:10.1186/cc5155)
This article is online at: />© 2007 Zanier et al; licensee BioMed Central Ltd.
This is an open access article distributed under the terms of the Creative Commons Attribution License ( />),
which permits unrestricted use, distribution, and reproduction in any medium, provided the original work is properly cited.
Abstract
Introduction The presence of intracranial hypertension (HICP)
after traumatic brain injury (TBI) affects patient outcome.
Intracranial pressure (ICP) data from electronic monitoring
equipment are usually calculated and recorded hourly in the
clinical chart by trained nurses. Little is known, however, about
how precisely this method reflects the real patterns of ICP after
severe TBI. In this study, we compared hourly manual recording
with a validated and continuous computerized reference
standard.
Methods Thirty randomly selected patients with severe TBI and
HICP admitted to the neuroscience intensive care unit
(Policlinico University Hospital, Milan, Italy) were retrospectively
studied. A 24-hour interval with ICP monitoring was randomly
selected for each patient. The manually recorded data available
for analysis covered 672 hours corresponding to 36,492 digital
data points. The two methods were evaluated using the
correlation coefficient and the Bland and Altman method. We
used the proportion test to analyze differences in the number of
episodes of HICP (ICP > 20 mm Hg) detected with the two
methods and the paired t test to analyze differences in the
percentage of time of HICP.
Results There was good agreement between the digitally
collected ICP and the manual recordings of the end-hour values.
Bland and Altman analysis confirmed a mean difference
between the two methods of 0.05 mm Hg (standard deviation
3.66); 96% of data were within the limits of agreement (+7.37
and -7.28). The average percentages of time of ICP greater than
20 mm Hg were 39% calculated from the digital measurements
and 34% from the manual observations. From the continuous
digital recording, we identified 351 episodes of ICP greater than
20 mm Hg lasting at least five minutes and 287 similar episodes
lasting at least ten minutes. Conversely, end-hour ICP of greater
than 20 mm Hg was observed in only 204 cases using manual
recording methods.
Conclusion Although manually recorded end-hour ICP
accurately reflected the computerized end-hour and mean hour
values, the important omission of a number of episodes of high
ICP, some of long duration, results in a clinical picture that is not
accurate or informative of the true pattern of unstable ICP in
patients with TBI.
Introduction
The presence of intracranial hypertension or high intracranial
pressure (HICP) (> 20 mm Hg) after traumatic brain injury
(TBI) affects patient outcome [1] and calls for prompt recogni-
tion and treatment. Accurate monitoring of intracranial pres-
sure (ICP) is therefore essential in neuro-intensive care, and
the utility of different ICP sensors has been explored exten-
sively [2]. In most ICU settings, clinical data from the monitor-
ing equipment are usually summarized hourly in the clinical
chart by trained nursing staff. Early studies of pharmacological
treatment for TBI [3] reported ICP as entered by the investiga-
tors at every end-hour interval, and this policy has been used
in a variety of subsequent pharmacological trials [4,5]. How-
ever, whether this method reflects the real patterns of ICP in
these acute cases involving unstable HICP is poorly under-
stood [6] and whether manually recorded end-hour values are
representative of the real pattern of ICP remains unclear.
CI = confidence interval; CPP = cerebral perfusion pressure; GCS = Glasgow Coma Scale; HICP = intracranial hypertension; ICP = intracranial
pressure; ICU = intensive care unit; SD = standard deviation; TBI = traumatic brain injury; TCDB = Traumatic Coma Data Bank.
Critical Care Vol 11 No 1 Zanier et al.
Page 2 of 6
(page number not for citation purposes)
In our unit, we have been using a comprehensive computer-
ized system specifically designed for ICP analysis, coupled
with traditional manual recording by the nurses, for many
years. This five year retrospective study sought to compare the
accuracy and clinical fidelity of manual hourly ICP recordings
with the computerized data to verify the capability of the two
systems to properly capture ICP increases and to adequately
rank the severity of ICP in single TBI cases.
Materials and methods
Among 293 TBI patients, admitted to the neuroscience inten-
sive care unit (ICU) at the Ospedale Maggiore Policlinico
(Milan, Italy) from 1 January 1997 to 1 December 2002, elec-
tronic recordings available for 170 of those patients were
examined. The inclusion criteria for this study were age of more
than 14 years, severe TBI (post-stabilization Glasgow Coma
Scale [GCS] of less than or equal to 8), ICP and cerebral per-
fusion pressure (CPP) monitoring for at least two days, and
ICP higher than 20 mm Hg for at least 25% of the monitoring
time. Sixty-two cases fulfilled these criteria. These 62 cases
were coded for anonymity and patients were listed in chrono-
logical order. For this retrospective study, one author (FO) ran-
domly chose 30 cases from the list and for each patient,
randomly selected one 24-hour interval of all ICU days with
ICP monitoring documented in the medical chart.
In our unit, trained nurses manually enter the end-hour ICP
value every hour on a form specifically designed for recording
physiological measurements. Concurrently with the manual
recording, a computerized system continuously acquires ICP
and CPP. Briefly, data from the ICP monitoring system are
continuously sent to a Macintosh computer (Apple Computer,
Inc., Cupertino, CA, USA) through an analog-digital converter
(MacLab; ADInstruments Pty Ltd., Castle Hill, Australia).
Therefore, it is possible at any time to write a clinical note on
the computerized chart that is stored together with the ICP
data. The computer records 10 points per minute, so more
than 430,000 points were available for this analysis. To
exclude potentially inaccurate data (such as interruption of
ICP readings due to transducer zeroing, cerebral spinal fluid
sampling, and so on), all traces were visually reviewed and all
artifactual data were removed. This procedure discarded
9.5% of data points.
The manually recorded data available for analysis covered 672
hours. In 48 instances, patients were moved for computed
tomography scans and so on; accordingly, the digital data for
these 48 missing hours were excluded from analysis, leaving
36,492 data points that were averaged per minute and per
hour.
To address the capability of the manual system to properly
capture ICP increases and to adequately rank the severity of
ICP, comparisons with the digital tracing were made and the
digital tracing was analyzed in five ways: (a) The end-hour
minute ICP was identified. (b) The average ICP for each hour
was calculated. (c) Episodes of HICP (> 20 mm Hg) were
identified and their durations were calculated. (d) The number
of five minute electronic HICP episodes per hour was calcu-
lated and each hour was assigned to one of three different cat-
egories: (i) no HICP episodes, (ii) one to five HICP episodes,
or (iii) ICP constantly higher than 20 mm Hg. (e) The percent-
age of time with an ICP of greater than 20 mm Hg was also
calculated by filtering the digital data using proprietary soft-
ware (Super ICP analyzer, author AC).
The two methods were evaluated using the correlation coeffi-
cient and the Bland and Altman method [7]. Because the elec-
tronic system was considered the reference value, it was
entered on the abscissa of the Bland and Altman plot [8]. We
used the proportion test to analyze differences in the number
of episodes of HICP detected with the two methods and the
paired t test to analyze differences in the percentage of time of
HICP.
The hospital ethics committee granted permission for pro-
spective collection, storage, and research analysis of clinical
and electronic data. Each patient's next of kin was informed,
and written consent was obtained with the understanding that
routine clinical and monitoring data were to be collected,
stored in a database, analyzed for research purposes, and
possibly published (once rendered anonymous).
Results
General data
Ten women and 20 men ranging in age from 16 to 54 years
(average 29 ± 12 years) were included in the present analysis.
The post-stabilization GCS was calculated for each patient
and the median was determined to be 5, whereas average ICP
was 20.3 ± 2.9 mm Hg and average CPP was 68 ± 5.7 mm
Hg. For each patient, ICP was monitored for 6 ± 3 days (with
a range of 2 to 10 days). The ICP catheters were placed in the
subdural space in 24 cases, in the ventricles in four cases, and
in the parenchyma in two cases.
End-hour ICP
The ICP entered on the clinical chart was compared with the
corresponding digital recording (average of the last minute for
every hour). The linear correlation between the two techniques
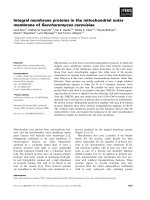
was very good (r = 0.89) (Figure 1). The mean difference
between the two methods was 0.05 mm Hg (standard devia-
tion [SD] 3.66), and 93% of data were within the limits of
agreement (+7.37 and -7.28).
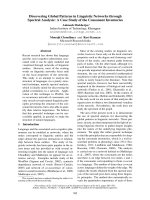
Mean hour ICP
The electronic average for every hourly digital measurement
was compared with the corresponding end-hour value manu-
ally recorded by the nurses. Again, the correlation was good (r
= 0.85) (Figure 2). The mean difference between the two
Available online />Page 3 of 6
(page number not for citation purposes)
methods was -0.08 mm Hg (SD 3.38), and 93% of data were
within the limits of agreement (+6.68 and -6.84).
Episodes of HICP
From the continuous digital recording, we identified 351 epi-
sodes of ICP greater than 20 mm Hg lasting at least five min-
utes and 287 episodes lasting at least ten minutes. However,
end-hour ICP greater than 20 mm Hg was manually recorded
for only 204 episodes. The proportion of missed data was
therefore 42% (95% confidence interval [CI] 36% to 46%) for
episodes longer than five minutes and 29% (95% CI 29% to
39%) for longer-lasting episodes. The proportion test indi-
cated a significant difference (p < 0.0001) between the num-
bers of ICP increases identified by the digital and the manual
systems.
Numbers of five minute electronic HICP episodes per
hour
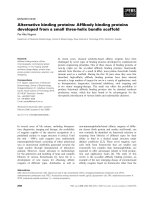
Over the 672 hours, using the digital recording system, we
identified 321 hours with no documentable episodes of HICP,
247 hours containing one to five HICP episodes, and 104
hours with a continuous HICP. Conversely, based on the man-
ual system, 437 hours of no HICP (< 20 mm Hg) were
reported and only 235 hours of HICP were detected and
recorded (Figure 3). Therefore, 116 hours with at least one
episode of HICP documented by the digital recording system
were labeled 'benign' using the manual recording system.
Percentage of time of HICP
The percentage of time of ICP greater than 20 mm Hg was cal-
culated (with proprietary software) from the digital data as
follows:
Figure 1
Bland and Altman's graph for end-hour intracranial pressure (ICP)Bland and Altman's graph for end-hour intracranial pressure (ICP). The
dark line shows the mean difference between manual and digital
recording methods (0.05 mm Hg). The two light lines show the limits of
agreement (-7.28 and +7.37).
Figure 2
Bland and Altman's graph for mean hourly intracranial pressure (ICP)Bland and Altman's graph for mean hourly intracranial pressure (ICP).
The dark line shows the mean difference between manual and digital
recording methods (-0.08 mm Hg). The two light lines show the limits
of agreement (-6.84 and +6.68).
Figure 3
Bar graphs depicting the capabilities of the digital and manual systems to capture increases in intracranial pressure (ICP)Bar graphs depicting the capabilities of the digital and manual systems
to capture increases in intracranial pressure (ICP). The bar on the left
represents the number of hours identified with the digital system; an
ICP always greater than 20 mm Hg (continuous intracranial hyperten-
sion [HICP]) is indicated in black, one to five episodes of ICP greater
than 20 mm Hg in gray, and no HICP (ICP > 20 mm Hg) in white. The
bar on the right represents the number of hours identified with the man-
ual system; an ICP greater than 20 mm Hg is indicated in black and an
ICP less than 20 mm Hg in white.
Critical Care Vol 11 No 1 Zanier et al.
Page 4 of 6
(page number not for citation purposes)
Number of minutes of ICP greater than 20 mm Hg × 100/total
minutes.
Overall, the digital percentage of time of ICP greater than 20
mm Hg was 39%. The digital percentage of time of ICP
greater than 20 mm Hg for each patient is shown in Figure 4a
and was more than 75% in three patients (upper quartile,
black bars), between 50% and 75% in seven patients (gray
bars), between 25% and 50% in eight patients (hatched bars),
and less than 25% in 12 patients (lower quartile, white bars).
The percentage of hours of ICP greater than 20 mm Hg iden-
tified with the manual system was calculated as follows:
Number of hours of ICP greater than 20 mm Hg × 100/total
hours.
Overall, the manual percentage of hours of ICP greater than
20 mm Hg was 34%. Comparisons between the digital and
manual percentages of time spent in which ICP exceeded 20
mm Hg showed that, overall, the manual system dramatically
underestimated ICP severity (p < 0.05 paired t test; Figure
4b).
Furthermore, for each patient studied, the difference between
digitally recorded and manually recorded percentages of time
in which ICP was greater than 20 mm Hg was calculated (Fig-
ure 4c). For example, patient 1 had a digitally recorded per-
centage of time in which ICP was greater than 20 mm Hg of
99.7% and a manually recorded percentage of time in which
ICP was greater than 20 mm Hg of 95.8%, a difference of
3.9%. The agreement between the two methods was fairly
good for patients in the upper (black bars) and lower (white
bars) quartiles, with a mean difference between the two meth-
ods of 6.6% ± 5.6% and 2.7% ± 0.6%, respectively. Con-
versely, the mean difference between the two methods was
19.5% ± 9.4% for the group of patients in the second quartile
(gray bars) and 10% ± 5.8% for the group of patients in the
third quartile (hatched bars). These differences in the data
highlight how patients with a fluctuating ICP are the most
prone to an erroneous detection of ICP severity when only the
manual recording technique is used.
Discussion
The results of the present study demonstrate that there was
good agreement between ICP data collected using continu-
ous digital computerized techniques and those data collected
using traditional manual recording as long as the end-hour
pressure data were analyzed. The limits of agreement were
narrow, and the end-hour data entered from the monitor and
recorded by the computer were markedly similar. The correla-
tion was also good between the mean hourly values and the
end-hour data, even if the 95% limit of agreement of ± 7 mm
Hg in borderline ICP cases could be clinically relevant. More-
over, if we had relied only on the manually obtained values,
more than one third of HICP episodes would have been
missed and not documented. Because the same patients were
recorded with both systems, it is impossible to detect any dif-
ference in treatment, or in outcome, associated with different
methods of ICP data collection. It is very likely that, at the bed-
side, prompt reaction to ICP increase was the rule, irrespec-
tive of the recording method used; what is different is the sum
of the ICP data, and we believe that these findings have impor-
tant implications for ICP-based clinical studies. Because man-
ually recorded end-hour values correlate well with digital
recordings, investigators could use these data to obtain a reli-
able description of ICP over time.
Several papers were published in the 1970s to outline the
importance of continuous monitoring for neurosurgical
patients [9-11]; however, the differences among recording
methods (manual versus digital) are probably expected but
rarely considered when ICP is analyzed in the literature.
In the data collected internationally by the Traumatic Coma
Data Bank (TCDB), ICP recordings were entered [12] using
end-hour values because previous work had shown that 84%
of the measurements recorded by nurses were within 6 mm
Hg of the electronic recording [13]. On the basis of these
same conclusions, the TCDB investigators decided not to
enter subjective estimates of hourly HICP and to use end-hour
values as a robust physiological descriptor. In a neonatal ICU
[14], physiological data (not ICP) stored by computer every
second were compared with the single hourly values noted by
the nurses. Manual and computer observations showed some
significant differences, but they were determined not to be
clinically important.
A recent study conducted on 16 patients with severe TBI [6]
compared a manual recording system of ICP data with a com-
puterized reference that collected only four data points per
hour. In that study, a strong correlation for ICP between the
hourly mean values calculated from the 15-minute measure-
ments and the end-hour value as recorded by the nurse (r
2
=
0.95) was found, and perhaps more importantly, the frequency
of perturbation in ICP detected by the 15-minute values was
no different from that detected by the end-hour values. The
authors concluded that the end-hour ICP was as accurate as
more frequent measurements during the hour [6].
Our data, while confirming the excellent and important corre-
lation between end-hour data, bring to light specific and signif-
icant differences in the capabilities of the two systems to
adequately assess the severity of ICP in individual TBI cases,
in which ICP can fluctuate widely. There was a significant dif-
ference between the number of individual ICP elevations as
identified by the digital versus manual systems, and the
average percentages of time of HICP calculated from the two
methods also differed significantly. A possible explanation for
this which differs from the one previously proposed [6] is that
Available online />Page 5 of 6
(page number not for citation purposes)
Figure 4
Bar graphs depicting the (a) digital and (b) manual percentages of time of intracranial hypertension (HICP) (> 20 mm Hg) for each patient and (c) the difference of digital and manual percentages of time of HICPBar graphs depicting the (a) digital and (b) manual percentages of time of intracranial hypertension (HICP) (> 20 mm Hg) for each patient and (c)
the difference of digital and manual percentages of time of HICP. Based on the digital results, patients are arranged in descending order and are
divided in quartiles. The upper quartile (black bars) consisted of patients with a percentage of time of digital HICP of more than 75%, the third quar-
tile (gray bars) consisted of patients with a percentage of time of digital HICP of 50% to 75%, the second quartile (hatched bars) consisted of
patients with a percentage of time of digital HICP of 25% to 50%, and the lower quartile (white bars) consisted of patients with a percentage of time
of digital HICP of less than 25%. HICP.
Critical Care Vol 11 No 1 Zanier et al.
Page 6 of 6
(page number not for citation purposes)
the data used for the comparison in the aforementioned study
were limited to end-hour measurements compared with four
digital points per hour, whereas our study used 600 data
points for the same interval.
Our findings confirm that although the traditional manual sys-
tem of ICP measurement in the ICU provides an accurate pic-
ture, a continuous, computerized digital system stores the
whole 'movie,' containing details that may be clinically impor-
tant but that are not visible in a single 'snapshot.' However, if
the whole 'movie' is summarized as the average whole-day
ICP, the resulting mean is not far from the one obtained by indi-
vidual 'snapshots' [15]. Moreover, there are specific limitations
concerning the continuous digital recording system, including
the necessity to review and edit the data [14]. This improves
the reliability of the data but is time-consuming and requires
human intervention and judgment, thereby introducing the
possibility of human error.
Conclusion
The end-hour ICP manually recorded by experienced nurses is
reliable and provides a robust description of the general ICP
trend, but on the basis of this measurement alone, a number of
episodes of HICP (some of long duration) may be missed, with
the risk of underestimating the severity of a patient's injury and
the intensity of treatment required. Depending on the purpose
of the data collection, each data system (manual or digital) can
better fit the aim. When a detailed analysis of ICP of individual
cases is desirable, a digital system with proper filtering
appears to be more accurate.
Competing interests
The authors declare that they have no competing interests.
Authors' contributions
ERZ participated in the conception and design of the study
and drafted the manuscript. FO made substantial contribu-
tions to the acquisition, analysis, and interpretation of data and
helped to draft the manuscript. LG and SL made substantial
contributions to the acquisition, analysis, and interpretation of
data. AC participated in the design of the study and performed
the statistical analysis. NS conceived of the study, participated
in its design, and critically revised the manuscript. All authors
read and approved the final manuscript.
References
1. Marmarou A, Anderson RL, Ward J, Choi DW: Impact of ICP
instability and hypotension on outcome in patients with severe
head trauma. J Neurosurg 1991, 75:S59-S66.
2. The Brain Trauma Foundation. The American Association of
Neurological Surgeons. The Joint Section on Neurotrauma
and Critical Care. Indications for intracranial pressure
monitoring. J Neurotrauma 2000, 17:479-491.
3. Knoller N, Levi L, Shoshan I, Reichenthal E, Razon N, Rappaport
ZH, Biegon A: Dexanabinol (HU-211) in the treatment of severe
closed head injury: a randomized, placebo-controlled, phase II
clinical trial. Crit Care Med 2002, 30:548-554.
4. Maas AI, Murray G, Henney H III, Kassem N, Legrand V, Mangelus
M, Muizelaar JP, Stocchetti N, Knoller N: Efficacy and safety of
dexanabinol in severe traumatic brain injury: results of a
phase III randomised, placebo-controlled, clinical trial. Lancet
Neurol 2006, 5:38-45.
5. Juul N, Morris GF, Marshall SB, Marshall LF: Intracranial hyper-
tension and cerebral perfusion pressure: influence on neuro-
logical deterioration and outcome in severe head injury. The
Executive Committee of the International Selfotel Trial. J
Neurosurg 2000, 92:1-6.
6. Venkatesh B, Garrett P, Fraenkel DJ, Purdie D: Indices to quantify
changes in intracranial and cerebral perfusion pressure by
assessing agreement between hourly and semi-continuous
recordings. Intensive Care Med 2004, 30:510-513.
7. Bland JM, Altman DG: Statistical methods for assessing agree-
ment between two methods of clinical measurement. Lancet
1986, 1:307-310.
8. Bland JM, Altman DG: Comparing methods of measurement:
why plotting difference against standard method is
misleading. Lancet 1995, 346:1085-1087.
9. McGraw CP: Continuous intracranial pressure monitoring:
review of techniques and presentation of method. Surg Neurol
1976:149-155.
10. Szewczykowski J, Korsak-Sliwka J, Kunicki A, Sliwka S, Dytko P: A
computerized neurosurgical intensive care system. Eur J
Intensive Care Med 1975, 1:
189-192.
11. Tindall GT, Patton JM, Dunion JJ, O'Brien MS: Monitoring of
patients with head injuries. Clin Neurosurg 1975, 22:332-363.
12. Marmarou A, Anderson RL, Ward JD, Choi SC, Young HF, Trau-
matic Coma Data Bank Research Group. NINDS Traumatic Coma
Data Bank (TCDB): Intracranial pressure monitoring
methodology. J Neurosurg 1991, 75:S21-S27.
13. Turner HB, Anderson RL, Ward JD, Young HF, Marmarou A: Com-
parison of nurse and computer recording of ICP in head
injured patients. J Neurosci Nurs 1988, 20:236-239.
14. Cunningham S, Deere S, Elton RA, McIntosh N: Comparison of
nurse and computer charting of physiological variables in an
intensive care unit. Int J Clin Monit Comput 1996, 13:235-241.
15. Hemphill JC III, Barton CW, Morabito D, Manley GT: Influence of
data resolution and interpolation method on assessment of
secondary brain insults in neurocritical care. Physiol Meas
2005, 26:373-386.
Key messages
• After severe TBI, the end-hour ICP manually recorded is
reliable in describing the general ICP trend.
• To properly capture ICP increases and to adequately
rank the severity of HICP, the computerized ICP moni-
toring shows clinical advantages over manual recording.