Báo cáo khoa học: "Injurious mechanical ventilation in the normal lung causes a progressive pathologic change in dynamic alveolar mechanics" potx
Bạn đang xem bản rút gọn của tài liệu. Xem và tải ngay bản đầy đủ của tài liệu tại đây (821.8 KB, 9 trang )
Open Access
Available online />Page 1 of 9
(page number not for citation purposes)
Vol 11 No 3
Research
Injurious mechanical ventilation in the normal lung causes a
progressive pathologic change in dynamic alveolar mechanics
Lucio A Pavone
1
, Scott Albert
1
, David Carney
2
, Louis A Gatto
3
, Jeffrey M Halter
1
and
Gary F Nieman
1
1
Department of Surgery, SUNY Upstate Medical University, 750 East Adams St Syracuse, NY 13210, USA
2
Memorial Health University Medical Center, 4700 Waters Ave Savannah, GA 31404, USA
3
Department of Biological Sciences, SUNY Cortland, P.O. Box 2000 Cortland, NY 13045, USA
Corresponding author: Scott Albert,
Received: 18 Jan 2007 Revisions requested: 6 Mar 2007 Revisions received: 4 Apr 2007 Accepted: 12 Jun 2007 Published: 12 Jun 2007
Critical Care 2007, 11:R64 (doi:10.1186/cc5940)
This article is online at: />© 2007 Pavone et al., licensee BioMed Central Ltd.
This is an open access article distributed under the terms of the Creative Commons Attribution License ( />),
which permits unrestricted use, distribution, and reproduction in any medium, provided the original work is properly cited.
Abstract
Introduction Acute respiratory distress syndrome causes a
heterogeneous lung injury, and without protective mechanical
ventilation a secondary ventilator-induced lung injury can occur.
To ventilate noncompliant lung regions, high inflation pressures
are required to 'pop open' the injured alveoli. The temporal
impact, however, of these elevated pressures on normal alveolar
mechanics (that is, the dynamic change in alveolar size and
shape during ventilation) is unknown. In the present study we
found that ventilating the normal lung with high peak pressure
(45 cmH
2
0) and low positive end-expiratory pressure (PEEP of
3 cmH
2
O) did not initially result in altered alveolar mechanics,
but alveolar instability developed over time.
Methods Anesthetized rats underwent tracheostomy, were
placed on pressure control ventilation, and underwent
sternotomy. Rats were then assigned to one of three ventilation
strategies: control group (n = 3, P
control
= 14 cmH
2
O, PEEP = 3
cmH
2
O), high pressure/low PEEP group (n = 6, P
control
= 45
cmH
2
O, PEEP = 3 cmH
2
O), and high pressure/high PEEP
group (n = 5, P
control
= 45 cmH
2
O, PEEP = 10 cmH
2
O). In vivo
microscopic footage of subpleural alveolar stability (that is,
recruitment/derecruitment) was taken at baseline and than every
15 minutes for 90 minutes following ventilator adjustments.
Alveolar recruitment/derecruitment was determined by
measuring the area of individual alveoli at peak inspiration (I) and
end expiration (E) by computer image analysis. Alveolar
recruitment/derecruitment was quantified by the percentage
change in alveolar area during tidal ventilation (%I – E
Δ
).
Results Alveoli were stable in the control group for the entire
experiment (low %I – E
Δ
). Alveoli in the high pressure/low PEEP
group were initially stable (low %I – E
Δ
), but with time alveolar
recruitment/derecruitment developed. The development of
alveolar instability in the high pressure/low PEEP group was
associated with histologic lung injury.
Conclusion A large change in lung volume with each breath will,
in time, lead to unstable alveoli and pulmonary damage.
Reducing the change in lung volume by increasing the PEEP,
even with high inflation pressure, prevents alveolar instability
and reduces injury. We speculate that ventilation with large
changes in lung volume over time results in surfactant
deactivation, which leads to alveolar instability.
Introduction
The treatment of acute lung injury and the acute respiratory
distress syndrome remains largely supportive, in the form of
mechanical ventilation. However, mechanical ventilation has
been implicated in the development of ventilator-induced lung
injury (VILI) and is felt to significantly contribute to the high-
mortality-associated acute respiratory distress syndrome [1].
A growing interest in VILI has developed with evidence that
mortality can be reduced when lung-protective ventilatory
strategies are employed [2,3]. VILI is of particular concern in
patients with acute respiratory distress syndrome because of
the heterogeneous pattern of injury, with areas of acutely
injured lung adjacent to areas of normal lung morphology. It is
believed that the injured regions are rendered stiff and
E = end expiration; HP/HP = high pressure and high positive end-expiratory pressure; HP/LP = high pressure and low positive end-expiratory pres-
sure; %I – E
Δ
= percentage change in alveolar area; I = peak inspiration; IMV = injurious mechanical ventilation; P
control
= control pressure; PEEP =
positive end-expiratory pressure; PO
2
= partial pressure of oxygen; VILI = ventilator-induced lung injury.
Critical Care Vol 11 No 3 Pavone et al.
Page 2 of 9
(page number not for citation purposes)
noncompliant due to the accumulation of pulmonary edema
and deactivation of surfactant. The pressures required to
inflate the injured lung areas are consequently much higher
than those needed to inflate the more compliant regions of
healthy lung. This difference results in shunting of excessive
tidal volume into the healthy lung, causing lung injury by either
alveolar overdistension [4-6] or recruitment/derecruitment [7-
11].
To simulate the ventilator-induced injury that occurs in normal
regions of the lung, we employed a commonly used model of
injurious mechanical ventilation (IMV) (high tidal volume and
low positive end-expiratory pressure (PEEP)). Although alveo-
lar recruitment/derecruitment is most commonly associated
with acute lung injury [8-11], it is possible that the large lung
volume excursion created by the high inflation pressures and
the low PEEP might cause repetitive alveolar recruitment/
derecruitment in the normal lung. Indeed, the temporal effects
of IMV on alveolar mechanics are unknown.
In the present study, we utilized in vivo microscopy to directly
measure subpleural alveolar mechanics (that is, dynamic
changes in alveolar size and shape during tidal ventilation) in
the living animal ventilated with high tidal volume and both low
PEEP and high PEEP.
Materials and methods
Surgical preparation
Adult, male Sprague–Dawley rats weighing between 298 g
and 548 g were anesthetized with intraperitoneal ketamine (90
mg/kg) and xylazine (10 mg/kg) at the onset of the procedure
and as needed to maintain surgical anesthesia. A tracheos-
tomy was established with a 2.5 mm pediatric endotracheal
tube. Paralysis was then achieved with intravenous pancuro-
nium (0.8 mg/kg) and the rats were placed on pressure control
ventilation with 50% oxygen delivered via a Galileo ventilator
(Hamilton Medical, Reno, NV, USA). Baseline ventilator set-
tings included a control pressure (P
control
, the pressure applied
above that of the PEEP during the inspiratory phase) of 14
cmH
2
O and a PEEP of 3 cmH
2
O.
A carotid arterial catheter was placed for blood gas analysis
(model ABL5; Radiometer Inc., Copenhagen, Denmark) and
inline measurement of systemic arterial pressure (TruWave™;
Baxter Healthcare Corp., Irvine, CA, USA). The internal jugular
vein was cannulated for fluid and drug infusion. Fluid resusci-
tation was performed with a 1 cm
3
bolus of lactated Ringer's
solution when the mean arterial pressure fell below 60 mmHg.
Rats were then placed on zero PEEP and a midline sternotomy
was performed with removal of the right third to sixth ribs. The
lung volume history was standardized by generating a single
inflation from zero PEEP to a peak pressure of 25 cmH
2
O at a
constant rate of inflation (3 cmH
2
O/s; Galileo Ventilator™ and
PV Tool™; Hamilton Medical, Inc.).
Experimental groups
Following surgical instrumentation, the rats were placed on
the ventilator and assigned to one of three ventilatory strate-
gies: control group (n = 3), maintained on the baseline venti-
latory strategy (P
control
= 14 cmH
2
O, PEEP = 3 cmH
2
O); high
pressure/low PEEP (HP/LP) group (n = 6), P
control
increased
to 45 cmH
2
O and PEEP maintained at 3 cmH
2
O; and high
pressure/high PEEP (HP/HP) group (n = 5), P
control
increased
to 45 cmH
2
O and PEEP increased to 10 cmH
2
O.
Concomitant with the initiation of the experimental ventilatory
strategies, the respiratory rate was set to 20 breaths/min for
all groups. Time 0 was designated as the time immediately fol-
lowing initiation of the experimental ventilatory strategy. Hemo-
dynamic, lung function, and in vivo microscopic data were
recorded at baseline and every 15 minutes after initiation of
the experimental protocol. The protocol was terminated after
90 minutes.
In vivo microscopy
A microscopic coverslip mounted on a ring was lowered onto
the pleural surface and the lung was held in place by gentle
suction (≤5 cmH
2
O) at end inspiration for placement of an in
vivo videomicroscope (epi-objective microscope with epi-illu-
mination, Olympus Model BXFM; (Olympus America Inc.
Melville, NY USA). At each timepoint, the apparatus was reat-
tached to the lung, and thus a different cohort of alveoli was
sampled at each timepoint. The lung tissue in the coverslip
apparatus was filmed field-by field from one edge of the cov-
erslip to the other. Microscopic images of alveoli were viewed
at a final magnification of 130× with a color video camera
(model CCD SSC-S20; SONY, Tokyo, Japan) and recorded
on Pinnacle Studio Plus software (Pagasus Imaging Corpora-
tion Tampa, FL). Each field measured 1.22 × 10
6
μm
2
and was
filmed throughout five complete tidal breaths.
Image analysis of alveoli
We analyzed the alveolar mechanics by replaying the video
frame-by-frame and capturing still images of individual alveoli
at peak inspiration (I) and end expiration (E). For each visual
field, the subset of alveoli analyzed consisted of those that
contacted a vertical line bisecting the visual field, representing
approximately 10 alveoli per field (Figure 1). Five microscopic
fields were analyzed in each animal at each timepoint. A mean
of 38 alveoli (range 8–65) per timepoint per animal was ana-
lyzed. The large range was due to alveolar collapse (atelecta-
sis) in the HP/LP group.
Measurements of alveolar area were made by manually tracing
the outer wall of individual alveoli at both I and E (Figure 2).
Computer image analysis (Empire Imaging Systems; Image
Pro, Syracuse, NY, USA) was then used to measure the cross-
sectional area of each traced alveolus. The degree of alveolar
stability – the change in alveolar size during tidal ventilation
Available online />Page 3 of 9
(page number not for citation purposes)
(from I to E) – was quantified by calculating the percentage
change in alveolar area from I to E (%I – E
Δ
).
Hemodynamic and lung function measurements
Arterial blood gases, systemic arterial pressures, and pulmo-
nary parameters (exhaled tidal volume and peak airway pres-
sure) were recorded at baseline and then at 15-minute
intervals for two hours. Pulmonary parameters were calculated
inline by the Galileo ventilator (Hamilton Medical): the peak air-
way pressure was, by definition, the highest airway pressure
measured during the breath cycle.
Necropsy
At necropsy, the right lung (which was filmed during the pro-
tocol) was excised and its bronchus cannulated. The lung was
inflated with 10% formalin by gravity to a pressure of 25
cmH
2
O. After 24 hours, the tissue was blocked in paraffin and
serial sections were made for staining with hematoxylin and
eosin. The slides were reviewed at high magnification (400×).
Additionally, a tissue sample from the left lung was sharply dis-
sected free of nonparenchymal tissue. The sample was
weighed before and every 24 hours after incubation at 65°C.
This was repeated until there was no weight change over a 24-
hour period, at which time the samples were deemed to be
dry. Lung water was expressed as a wet to dry weight ratio.
Statistics
All values are reported as the mean ± standard error of mean.
Significant differences between groups were determined by
analysis of variance and significant differences within groups
by a repeated-measures analysis of variance. Whenever the F
ratio indicated significance, a Newman–Keul's test was used
to identify the individual differences. Significance was
assumed when the probability of the null hypothesis being true
was less than 5% (P < 0.05).
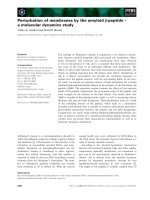
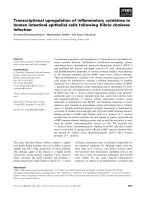
Figure 1
Randomization of alveoli for measurement of alveolar stabilityRandomization of alveoli for measurement of alveolar stability. The per-
centage change in alveolar area between peak inspiration and end expi-
ration. (a) For each microscopic field analyzed, a vertical line bisecting
the field was drawn. (b) Each alveolus that contacted this bisecting line
was chosen for analysis of alveolar stability. Bar = 100 μm.
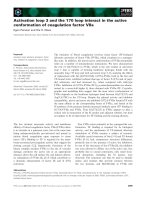
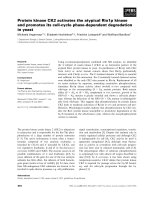
Figure 2
Image analysis measurement of alveolar stabilityImage analysis measurement of alveolar stability. In vivo photomicro-
graphs of the same microscopic field at (a) peak inspiration and (b)
end expiration. Individual alveoli were outlined and the area at peak
inspiration (I) and end expiration (E) was measured using image analy-
sis software. Alveolar stability was assessed by the percentage change
in the area of individual alveoli from I to E (%I – E
Δ
).
Critical Care Vol 11 No 3 Pavone et al.
Page 4 of 9
(page number not for citation purposes)
Vertebrate animals
Experiments described in this study were performed in
accordance with the National Institutes of Health guidelines
for the use of experimental animals in research. The protocol
was approved by the Committee for the Humane Use of Ani-
mals at our institution.
Results
Hemodynamic and pulmonary function
Hemodynamic and pulmonary parameters are presented in
Table 1. The HP/LP group was the only group to develop sig-
nificant hypotension at 90 minutes compared with baseline,
with no difference in fluid administration between the groups
(9.3 ± 0.7 ml in the control group, 12.6 ± 2.9 ml in the HP/LP
group, 9.0 ± 1.9 ml in the HP/HP group, P = not significant).
The peak airway pressure was significantly higher in the HP/
HP and HP/LP groups as compared with the control group
(Table 1). The tidal volume was significantly greater in the HP/
LP group as compared with either the control group or the HP/
HP group (Table 1).
Alveolar mechanics
Alveoli were stable (minimal change in size during tidal ventila-
tion, low %I – E
Δ
) in all groups on baseline ventilator settings
(P
control
= 14 cmH
2
O, PEEP = 3 cmH
2
O) (Figure 3). Alveoli
were also stable in the control group for the entire 90-minute
protocol (see Additional file 1). Alveoli in the HP/LP group
were stable initially but became unstable with time (Figure 3)
(see Additional file 2). The application of additional PEEP (HP/
HP group) prevented alveolar instability through the entire pro-
tocol (Figure 3).
Arterial blood gases
Arterial blood gas values are also presented in Table 1.
Despite the marked alveolar instability (Figure 3) and lung
injury (Figure 4) in the HP/LP group, the arterial PO
2
(partial
pressure of oxygen) was actually higher at 90 minutes than at
Table 1
Hemodynamic and pulmonary parameters
Baseline 15 minutes 30 minutes 45 minutes 60 minutes 75 minutes 90 minutes
Control group
Mean arterial pressure (mmHg) 102 ± 17 111 ± 10 123 ± 7 138 ± 0 143 ± 8 124 ± 10 105 ± 20
pH 7.32 ± 0.05 7.32 ± 0.10 7.30 ± 0.10 7.26 ± 0.01 7.26 ± 0.02 7.26 ± 0.05 7.26 ± 0.02
PCO
2
(mmHg) 28 ± 9 40 ± 1 36 ± 0 37 ± 4 34 ± 5 29 ± 2 23 ± 5
PO
2
(mmHg) 241 ± 81 316 ± 18 325 ± 36 298 ± 16 331 ± 37 334 ± 10 340 ± 12
Tidal volume (ml/kg) 15.0 ± 5.9 7.8 ± 1.3 7.8 ± 1.3 7.8 ± 1.3 6.9 ± 1.6 7.9 ± 1.4 9.9 ± 1.8
Peak pressure (cmH
2
O) 16 ± 0 15 ± 1 16 ± 0 16 ± 0 16 ± 0 16 ± 0 16 ± 0
Intravenous fluid (ml) 9.3 ± 0.7
High pressure/low PEEP group
Mean arterial pressure (mmHg) 92 ± 13 79 ± 10 89 ± 10 86 ± 9* 71 ± 11* 64 ± 11* 55 ± 10
#
pH 7.25 ± 0.06 7.39 ± 0.05
#
7.37 ± 0.04
#
7.33 ± 0.03 7.31 ± 0.04 7.24 ± 0.04 7.20 ± 0.03
PCO
2
(mmHg) 30 ± 6 23 ± 5*
†
22 ± 4 21 ± 4 17 ± 3* 16 ± 3 15 ± 4
PO
2
(mmHg) 187 ± 32 241 ± 37 260 ± 42 240 ± 54 244 ± 59 251 ± 54 232 ± 45
Tidal volume (ml/kg) 12.2 ± 5.9 31.4 ± 5.5*
#†
30.3 ± 3.9*
#†
27.7 ± 2.6*
#†
38.4 ± 10.8*
#†
40.0 ± 13.2
#†
39.0 ± 9.2*
#†
Peak pressure (cmH
2
O) 17 ± 0* 39 ± 4* 45 ± 1* 45 ± 1* 45 ± 1* 45 ± 1* 46 ± 2*
Intravenous fluid (ml) 12.6 ± 2.9
High pressure/high PEEP group
Mean arterial pressure (mmHg) 105 ± 23 94 ± 13 100 ± 16 85 ± 14* 84 ± 20* 83 ± 16 66 ± 14
pH 7.40 ± 0.05 7.27 ± 0.04 7.32 ± 0.08 7.28 ± 0.03 7.27 ± 0.04 7.23 ± 0.06
#
7.22 ± 0.09
#
PCO
2
(mmHg) 32 ± 3 44 ± 3 33 ± 7 26 ± 4 25 ± 3 19 ± 1 15 ± 1
#
PO
2
(mmHg) 263 ± 32 262 ± 40 315 ± 14 307 ± 27 317 ± 20 315 ± 11 317 ± 17
Tidal volume (ml/kg) 12.9 ± 1.4 8.6 ± 2.4
#
9.6 ± 2.5
#
9.6 ± 2.6
#
9.6 ± 2.6
#
9.2 ± 2.4
#
9.2 ± 2.4
#
Peak pressure (cmH
2
O) 17 ± 0* 50 ± 3* 50 ± 6* 50 ± 3* 50 ± 3* 50 ± 3* 50 ± 6*
Intravenous fluid (ml) 9.0 ± 1.9
Data presented as the mean ± standard error. PCO
2
(partial pressure of carbon dioxide); PO
2
(partial pressure of oxygen). *P < 0.05 versus
control group,
#
P < 0.05 versus baseline,
†
P < 0.05 versus the high pressure/high positive end-expiratory pressure (PEEP) group.
Available online />Page 5 of 9
(page number not for citation purposes)
baseline (Table 1). The PCO
2
(partial pressure of carbon diox-
ide) in all groups trended downward throughout the
experiment.
Gross morphology, histology, and lung water
determination
Lungs in the HP/LP group at necropsy appeared cherry red,
with areas of hemorrhagic consolidation evident at the pleural
surface. Lungs in the control and HP/HP groups appeared
pink, without evidence of hemorrhage on the pleural surface.
The histologic assessment was analyzed qualitatively, and the
pictures displayed (Figure 4) were selected by our histologist
(LAG) as representative of each group. The control group
revealed normal morphology with few inflammatory cells and
minimal evidence of pulmonary edema (Figure 4a). The HP/LP
group exhibited thickened alveolar walls, an abundance of
inflammatory cells, and alveolar edema indicated by the pres-
ence of fibrinous material within the alveolar lumen (Figure 4b).
These histopathologic changes were mitigated with the addi-
tion of PEEP in the HP/HP group. Only a moderate amount of
edema and relatively few inflammatory cells were seen in the
pulmonary parenchyma of this group (Figure 4c).
There was a numerically higher, but not statistically different,
increase in lung edema, determined by the lung wet/dry
weight ratio, in the HP/LP group (wet to dry weight ratio: con-
trol group = 5.39 ± 0.72, HP/LP group = 6.35 ± 0.71, HP/HP
group = 5.62 ± 0.21, P = not significant).
Discussion
To our knowledge this is the first study to directly observe and
quantify subpleural alveolar mechanics in healthy lungs
exposed to IMV over time. We found that alveoli were initially
stable but became unstable with time. Increasing PEEP pre-
vented the development of gross pathologic changes and of
alveolar recruitment/derecruitment in spite of high peak airway
pressure and volume. We postulate that the large volume
change with IMV resulted in surfactant deactivation [12-17],
which caused alveolar instability [8,18-21]. Large changes in
lung volume could deactivate surfactant by any of the following
mechanisms: direct inhibition [16,22], increased surfactant
release from type II cells with subsequent removal from the
alveolar surface [12-15,23], and/or increased vascular
permeability resulting in edema-induced surfactant deactiva-
tion [16,24-26]. The PEEP may have prevented alveolar insta-
bility either by reducing surfactant deactivation or by
maintaining end-expiratory pressure above the alveolar col-
lapse point [14,16]. The fact that injury was greater in lungs
with unstable alveoli suggests that alveolar instability (atelec-
trauma) exacerbates the damage caused by high lung volume
(volutrama) [27].
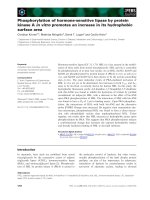
Figure 3
Alveolar stabilityAlveolar stability. Expressed as the percentage change in alveolar area
between peak inspiration and end expiration (%I – E
Δ
). Data are the
mean ± standard error. *P < 0.05 versus control group and high pres-
sure and high positive end-expiratory pressure (PEEP) group, #P <
0.05 versus baseline.
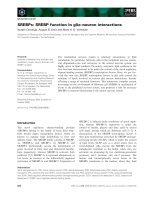
Figure 4
Rat lung stained with hematoxylin and eosinRat lung stained with hematoxylin and eosin. (a) Control group. (b) High pressure and low positive end-expiratory pressure group (arrows indicate
fibrinous deposits in the alveolar lumen). (c) High pressure and high positive end-expiratory pressure group (arrows indicate inflammatory cells in the
vascular compartment). Bar = 50 μm
Critical Care Vol 11 No 3 Pavone et al.
Page 6 of 9
(page number not for citation purposes)
Previous work has demonstrated that normal alveoli do not
change size appreciably during positive pressure ventilation
with either physiologic [8,19,21] or high tidal volumes [20]
and airway pressures. We have demonstrated in surfactant
deactivation animal models of acute respiratory distress syn-
drome that alveoli are unstable even with physiologic tidal vol-
umes and that alveolar recruitment/derecruitment causes lung
damage [8,18,19,21]. Unlike previous studies in which the
lung was injured by Tween instillation (deactivates surfactant)
[8,18,19,21], the present experiment was performed on nor-
mal lungs. In this study we demonstrated that, even with a very
large tidal volume and low PEEP, normal alveoli, at least in the
two dimensions we can see with our in vivo microscopic tech-
nique, do not change size appreciably during ventilation. In the
previous experiments we only maintained high lung volume for
a very short period of time [20,28]. In contrast, in the present
experiment IMV was maintained for 90 minutes and, eventu-
ally, the lungs developed abnormal alveolar mechanics with
unstable alveoli.
How could a large change in lung volume occur without a
change in either the size or number of alveoli? What is the crit-
ical factor or factors that convert an alveolus with normal sta-
ble alveolar mechanics into an unstable alveolus with abnormal
mechanics? Why was no deterioration in gas exchange asso-
ciated with unstable alveoli and lung injury?
The mechanism by which the normal lung changes volume at
the alveolar level is poorly understood. The following discus-
sion highlights some of the possible mechanisms of lung vol-
ume change that would explain our consistent finding that
normal alveoli do not change size appreciably during tidal
ventilation.
There are substantial data to support the hypothesis that lung
volume change is not simply due to a balloon-like isotropic
change in alveolar volume. Macklin suggested that the alveolar
size changes little during lung volume change and that the
increase in lung volume is accommodated by changes in vol-
ume of the alveolar ducts [29]. Daly and colleagues corrobo-
rated these findings utilizing in vivo microscopy, and showed
that the alveolar duct was the anatomical structure that
changes size during tidal ventilation [30]. Carney and col-
leagues demonstrated in normal lungs inflated from functional
residual capacity (FRC) to 80% total lung capacity (TLC) that
the lung volume change was due to 'normal' alveolar recruit-
ment (that is, normal lung volume change is due to alveoli
opening and closing, not to alveoli getting larger and smaller)
[28]; this hypothesis was corroborated by Escolar and col-
leagues using stereologic techniques [31]. Other workers
have shown that the lung volume change is caused by folding
and unfolding of the alveolus, similar to a paper bag [23].
If any or all of these mechanisms are responsible for the
change in lung volume, this could explain our finding that there
is little change in alveolar size even with a large change in lung
volume. If the lung changes volume by changes in the size of
the alveolar duct, this would not be visible due to the limited
depth of field of our in vivo microscope. Likewise, bag-like
folding and unfolding of the alveolus would be in the third
dimension, invisible to our in vivo microscopic view. Regard-
less of the mechanism, our data clearly show a distinct differ-
ence in alveolar mechanics in the normal versus the acutely
injured lung, which leads us to our next question.
What are the critical factors that convert an alveolus with nor-
mal stable alveolar mechanics into an unstable alveolus with
abnormal mechanics? We postulate that the large volume
change deactivates pulmonary surfactant [12-17,22,24,26],
which would cause alveoli to become unstable [8,18-21]. In a
similar study, Verbrugge and colleagues demonstrated that
rats ventilated with high tidal volume and low PEEP had
altered surfactant composition, with a significant decrease in
the ratio of functional to nonfunctional surfactant [16]. This
change in surfactant composition resulted in reduced sur-
factant function as measured by a pulsating bubble surfactom-
eter. In addition to the altered composition of surfactant,
Verbrugge and colleagues also measured a significant
increase in bronchoalveoalar lavage fluid protein concentra-
tion, which can deactivate surfactant directly [16,25,32].
Moreover, those authors demonstrated that the addition of 10
cmH
2
O of PEEP reduced or prevented all of the above
changes [16]. Other workers have suggested that large tidal
volumes increase the rate of surfactant turnover, effectively
'wearing out' the surface film at a very high rate [12-15].
The data demonstrating that high tidal volume and low PEEP
ventilation inhibits pulmonary surfactant [12-17,22,24-26,32],
combined with our data showing that subpleural alveoli
become unstable following surfactant deactivation [8,18-21],
support the hypothesis that surfactant deactivation is the
mechanism of alveolar instability in this study. This brings us to
our final question: why was no deterioration in gas exchange
associated with unstable alveoli and lung injury?
In the present study, oxygenation was not significantly different
at 90 minutes between any of the groups, even though only the
HP/LP group(high pressure/low PEEP) had unstable alveoli.
How can a lung with alveoli that collapse at end expiration oxy-
genate as well as a lung with patent alveoli throughout the ven-
tilatory cycle? We hypothesize that surfactant-deficient,
unstable alveoli are forced open during lung inflation due to
the exceeding large tidal volume and inflation pressure with
IMV. While inflated, these alveoli would exchange gas and
load oxygen into the arterial blood.
Baumgardner and colleagues utilized a fluorescence-quench-
ing PO
2
probe placed inside the distal aorta [33]. They dem-
onstrated that PO
2
fluctuated breath-by-breath; the magnitude
of the PO
2
oscillations was dependent upon the degree of
Available online />Page 7 of 9
(page number not for citation purposes)
alveolar instability (that is, the amount of collapse and re-
expansion with each breath). Adjustments in ventilation (for
example, respiratory rate, PEEP, etc.) that reduced alveolar
instability also reduced PO
2
fluctuation. In a subsequent study,
Syring and colleagues demonstrated that increasing the respi-
ratory rate was as effective as increasing the PEEP to improve
arterial PO
2
in a rabbit saline lavage model of acute respiratory
distress syndrome [34]. Interestingly, a respiratory rate of 24/
minute with a PEEP of 3.5 cmH
2
O was as effective at main-
taining PO
2
as a respiratory rate of 7/minute and a PEEP of 14
cmH
2
O. In our HP/LP group, the respiratory rate was 20/
minute and the PEEP was 3 cmH
2
O, very similar to the venti-
lator settings in the Syring and colleagues study that yielded
good oxygenation.
We hypothesize that high inflation pressure would further
improve oxygenation in noncompliant alveoli by forcing more
collapsed alveoli open. The plateau pressure in Syring and col-
league's study was 28 cmH
2
O, as compared with the peak
inspiratory pressure of 45 cmH
2
O in the present HP/LP group.
We speculate that even though alveoli in our HP/LP group
were very 'stiff', they were recruited during inspiration due to
the high inflation pressure – and the rapid respiratory rate kept
them inflated for a sufficient length of time to adequately oxy-
genate the blood. Although forcing surfactant-deficient unsta-
ble alveoli open with each breath will improve oxygenation in
the short run, it will cause a tremendous amount of mechanical
damage to the pulmonary parenchyma (VILI) and will signifi-
cantly exacerbate morbidity and mortality [18,21].
Critique of the model
Respiratory rate, inspratory:expiratory ratio, and carbon
dioxide
Numerous factors have been implicated in the development of
VILI. For example, it has been shown that alterations in the res-
piratory rate [33,35] and the inspiratory:expiratory ratio [36]
can impact VILI. For this reason, we employed a protocol that
standardized the respiratory rate and inspiratory:expiratory
ratio between the groups (respiratory rate, 20/min; inspira-
tory:expiratory ratio, 1:2). Additionally, it has been shown that
hypercapnic acidosis protects against VILI [37,38] and that,
conversely, hypocapnic alkalosis can injure isolated rabbit
lungs [39]. There was no significant difference in the pH or
partial pressure of carbon dioxide values between the groups
at the end of the protocol (Table 1). The development of alve-
olar instability, as well as gross and histologic changes, is
therefore reflective of the differences in ventilatory pressures
and volumes, not of the acid–base status.
Microscopic artifact
Although there are methodologic problems with our in vivo
microscopic technique, it is the only tool available to directly
observe the behavior of alveoli in a living animal. Utilizing elec-
tron microscopy, we have previously confirmed that the subp-
leural structures measured are true alveoli [19]. Concern
exists, however, regarding whether subpleural alveolar
mechanics might differ from those in other regions of the lung.
Subpleural alveoli are, indeed, structurally different from alveoli
in deeper regions of the lung, in that they are not completely
surrounded by other alveoli. In other words, one wall of a sub-
pleural alveolus is always adjacent to the visceral pleura rather
than another alveolus. This anatomic arrangement may serve
to lessen the structural support provided by alveolar interde-
pendence, causing subpleural alveoli to become unstable
sooner than those within the interior of the lung.
Our microscope's limited depth of field (70 μm) restricts our
analysis of alveolar mechanics to only two dimensions.
Regardless of this limitation, we clearly demonstrate that alve-
olar mechanics are dramatically altered in two dimensions fol-
lowing exposure to IMV.
To maintain the same microscopic field during tidal ventilation,
gentle suction (≤5 cmH
2
O) must be applied to hold the lung
tissue under the coverslip. This amount of suction is within the
range of normal intrapleural and transpulmonary pressures. In
a previous study we compared the alveolar size at E and I as
well as the stability of normal alveoli during mechanical
ventilation with and without suction [19]. We demonstrated
that suction slightly but significantly increased the alveolar size
at both I and E and stabilized the alveolus. These changes
were very subtle, with %I – E
Δ
being 1.1% in the suction
group and 8.3% in the nonsuction group [19]. This slight
change in alveolar size with ventilation was in stark contrast to
the marked change in alveolar size that occurred following pro-
longed exposure in the HP/LP group. These data therefore
demonstrate that suction did not fix the alveolar volume, dem-
onstrate that normal alveolar stability is not an artifact of suc-
tion, and demonstrate that suction does not prevent the
development of alveolar instability.
Image analysis of alveoli
The measurement was performed in a nonblinded fashion.
Unfortunately, this may have introduced some bias. If minimal
bias were introduced, however, we feel very confident that this
would not change our results significantly since there was
such a large difference in %I – E
Δ
between groups.
Key messages
• A large change in lung volume with each breath will, in
time, lead to unstable alveoli and pulmonary damage.
• Reducing the change in lung volume by increasing the
PEEP, even with high inflation pressure, prevents alveo-
lar instability and reduces lung injury.
• We speculate that ventilation with large changes in lung
volume over time results in surfactant deactivation,
which leads to alveolar instability.
Critical Care Vol 11 No 3 Pavone et al.
Page 8 of 9
(page number not for citation purposes)
Competing interests
The authors declare that they have no competing interests.
Authors' contributions
LAP conducted the experiments, analyzed and graphed the
data, and wrote the first draft of the paper. JMH assisted LAP
in conducting the experiments and editing the manuscript.
LAG contributed to the experimental design, data analysis and
interpretation, and performed the histologic analysis. DC con-
tributed to the experimental design of the study, data analysis,
and interpretation. SA assisted with manuscript drafting, data
analysis and extensive editing. GFN contributed to the design
and development of the protocol, data analysis and interpreta-
tion, and writing of the manuscript.
Additional files
Acknowledgements
The authors would like to thank Ms Kathy Snyder for her expert technical
assistance. This study was funded in part by a grant from Hamilton Med-
ical, Inc.
References
1. Ware LB, Matthay MA: The acute respiratory distress
syndrome. N Engl J Med 2000, 342:1334-1349.
2. Ventilation with lower tidal volumes as compared with tradi-
tional tidal volumes for acute lung injury and the acute respi-
ratory distress syndrome. The Acute Respiratory Distress
Syndrome Network. N Engl J Med 2000, 342:1301-1308.
3. Amato MB, Barbas CS, Medeiros DM, Magaldi RB, Schettino GP,
Lorenzi-Filho G, Kairalla RA, Deheinzelin D, Munoz C, Oliveira R, et
al.: Effect of a protective-ventilation strategy on mortality in the
acute respiratory distress syndrome. N Engl J Med 1998,
338:347-354.
4. Corbridge TC, Wood LD, Crawford GP, Chudoba MJ, Yanos J,
Sznajder JI: Adverse effects of large tidal volume and low PEEP
in canine acid aspiration. Am Rev Respir Dis 1990,
142:311-315.
5. Dreyfuss D, Saumon G: Role of tidal volume, FRC, and end-
inspiratory volume in the development of pulmonary edema
following mechanical ventilation. Am Rev Respir Dis 1993,
148:1194-1203.
6. Dreyfuss D, Soler P, Basset G, Saumon G: High inflation pres-
sure pulmonary edema. Respective effects of high airway
pressure, high tidal volume, and positive end-expiratory
pressure. Am Rev Respir Dis 1988, 137:1159-1164.
7. Cheng KC, Zhang H, Lin CY, Slutsky AS: Ventilation with nega-
tive airway pressure induces a cytokine response in isolated
mouse lung. Anesth Analg 2002, 94:1577-1582. table of
contents
8. Schiller HJ, McCann UG 2nd, Carney DE, Gatto LA, Steinberg JM,
Nieman GF: Altered alveolar mechanics in the acutely injured
lung. Crit Care Med 2001, 29:1049-1055.
9. Suh GY, Koh Y, Chung MP, An CH, Kim H, Jang WY, Han J, Kwon
OJ: Repeated derecruitments accentuate lung injury during
mechanical ventilation. Crit Care Med 2002, 30:1848-1853.
10. Taskar V, John J, Evander E, Robertson B, Jonson B: Surfactant
dysfunction makes lungs vulnerable to repetitive collapse and
reexpansion. Am J Respir Crit Care Med 1997, 155:313-320.
11. Williams EM, Viale JP, Hamilton RM, McPeak H, Sutton L, Hahn
CE: Within-breath arterial PO
2
oscillations in an experimental
model of acute respiratory distress syndrome. Br J Anaesth
2000, 85:456-459.
12. Faridy EE, Permutt S, Riley RL: Effect of ventilation on surface
forces in excised dogs' lungs. J Appl Physiol 1966,
21:1453-1462.
13. Forrest JB: The effect of hyperventilation on pulmonary surface
activity. Br J Anaesth 1972, 44:313-320.
14. Massaro GD, Massaro D: Morphologic evidence that large infla-
tions of the lung stimulate secretion of surfactant. Am Rev
Respir Dis 1983, 127:235-236.
15. McClenahan JB, Urtnowski A: Effect of ventilation on surfactant,
and its turnover rate. J Appl Physiol 1967, 23:215-220.
16. Verbrugge SJ, Bohm SH, Gommers D, Zimmerman LJ, Lachmann
B: Surfactant impairment after mechanical ventilation with
large alveolar surface area changes and effects of positive
end-expiratory pressure. Br J Anaesth 1998, 80:360-364.
17. Wyszogrodski I, Kyei-Aboagye K, Taeusch HW Jr, Avery ME: Sur-
factant inactivation by hyperventilation: conservation by end-
expiratory pressure. J Appl Physiol 1975, 38:461-466.
18. Halter JM, Steinberg JM, Gatto LA, Dirocco JD, Pavone LA, Schiller
HJ, Albert S, Lee HM, Carney D, Nieman GF: Effect of positive
end-expiratory pressure and tidal volume on lung injury
induced by alveolar instability. Crit Care 2007, 11:R20.
19. Nieman GF, Bredenberg CE, Clark WR, West NR: Alveolar func-
tion following surfactant deactivation. J Appl Physiol 1981,
51:895-904.
20. Steinberg J, Schiller HJ, Halter JM, Gatto LA, Dasilva M, Amato M,
McCann UG, Nieman GF: Tidal volume increases do not affect
alveolar mechanics in normal lung but cause alveolar overdis-
tension and exacerbate alveolar instability after surfactant
deactivation. Crit Care Med 2002, 30:2675-2683.
21. Steinberg JM, Schiller HJ, Halter JM, Gatto LA, Lee HM, Pavone
LA, Nieman GF: Alveolar instability causes early ventilator-
induced lung injury independent of neutrophils. Am J Respir
Crit Care Med 2004, 169:
57-63.
22. Veldhuizen RA, Welk B, Harbottle R, Hearn S, Nag K, Petersen N,
Possmayer F: Mechanical ventilation of isolated rat lungs
changes the structure and biophysical properties of
surfactant. J Appl Physiol 2002, 92:1169-1175.
23. Tschumperlin DJ, Margulies SS: Alveolar epithelial surface
area–volume relationship in isolated rat lungs. J Appl Physiol
1999, 86:2026-2033.
The following Additional files are available online:
Additional file 1
A movie file illustrating stable subpleural alveoli in the
normal rat lung during dynamic tidal ventilation. Each
sphere-shaped object is an inflated individual alveolus
and there is minimal atelectasis (that is, the entire field is
covered by inflated alveoli). Notice there is minimal
alveolar movement (that is, alveoli are stable) during tidal
ventilation, at least in the two dimensions that can be
seen with our in vivo microscope technique.
See />supplementary/cc5940-S1.mpg
Additional file 2
A movie file demonstrating unstable subpleural alveoli in
the injured rat lung during dynamic tidal ventilation. The
red area without alveoli (that is, individual circles) shows
diffuse atelectasis prior to inspiration. The individual
alveoli (spheres) 'pop' open with inspiration and then
quickly collapse with expiration. Notice that alveoli are
very unstable and there is complete collapse of most
alveoli during deflation and than reinflation during lung
inflation – classic alveolar recruitment/derecruitment.
See />supplementary/cc5940-S2.mpg
Available online />Page 9 of 9
(page number not for citation purposes)
24. Bouvet F, Dreyfuss D, Lebtahi R, Martet G, Le Guludec D, Saumon
G: Noninvasive evaluation of acute capillary permeability
changes during high-volume ventilation in rats with and with-
out hypercapnic acidosis. Crit Care Med 2005, 33:155-160.
discussion 250–252
25. Seeger W, Stohr G, Wolf HR, Neuhof H: Alteration of surfactant
function due to protein leakage: special interaction with fibrin
monomer. J Appl Physiol 1985, 58:326-338.
26. Veldhuizen RA, Tremblay LN, Govindarajan A, van Rozendaal BA,
Haagsman HP, Slutsky AS: Pulmonary surfactant is altered dur-
ing mechanical ventilation of isolated rat lung. Crit Care Med
2000, 28:2545-2551.
27. Tremblay LN, Slutsky AS: Ventilator-induced lung injury: from
the bench to the bedside. Intensive Care Med 2006, 32:24-33.
28. Carney DE, Bredenberg CE, Schiller HJ, Picone AL, McCann UG,
Gatto LA, Bailey G, Fillinger M, Nieman GF: The mechanism of
lung volume change during mechanical ventilation. Am J
Respir Crit Care Med 1999, 160:1697-1702.
29. Macklin C: Alveoli of mamalian lung:anatomical study with clin-
ical correlation. Proc Inst Med Chic 1950:18.
30. Daly BD, Parks GE, Edmonds CH, Hibbs CW, Norman JC:
Dynamic alveolar mechanics as studied by videomicroscopy.
Respir Physiol 1975, 24:217-232.
31. Escolar JD, Escolar MA, Guzman J, Roques M: Pressure volume
curve and alveolar recruitment/de-recruitment. A morphomet-
ric model of the respiratory cycle. Histol Histopathol 2002,
17:383-392.
32. Gunther A, Ruppert C, Schmidt R, Markart P, Grimminger F,
Walmrath D, Seeger W: Surfactant alteration and replacement
in acute respiratory distress syndrome. Respir Res 2001,
2:353-364.
33. Baumgardner JE, Markstaller K, Pfeiffer B, Doebrich M, Otto CM:
Effects of respiratory rate, plateau pressure, and positive end-
expiratory pressure on PaO
2
oscillations after saline lavage.
Am J Respir Crit Care Med 2002, 166:1556-1562.
34. Syring RS, Otto CM, Spivack RE, Markstaller K, Baumgardner JE:
Maintenance of end-expiratory recruitment with increased res-
piratory rate after saline-lavage lung injury. J Appl Physiol
2007, 102:331-339.
35. Hotchkiss JR Jr, Blanch L, Murias G, Adams AB, Olson DA, Wan-
gensteen OD, Leo PH, Marini JJ: Effects of decreased respira-
tory frequency on ventilator-induced lung injury. Am J Respir
Crit Care Med 2000, 161:463-468.
36. Casetti AV, Bartlett RH, Hirschl RB: Increasing inspiratory time
exacerbates ventilator-induced lung injury during high-pres-
sure/high-volume mechanical ventilation. Crit Care Med
2002, 30:2295-2299.
37. Broccard AF, Hotchkiss JR, Vannay C, Markert M, Sauty A, Feihl F,
Schaller MD: Protective effects of hypercapnic acidosis on ven-
tilator-induced lung injury. Am J Respir Crit Care Med 2001,
164:802-806.
38. Sinclair SE, Kregenow DA, Lamm WJ, Starr IR, Chi EY, Hlastala
MP: Hypercapnic acidosis is protective in an in vivo model of
ventilator-induced lung injury. Am J Respir Crit Care Med 2002,
166:403-408.
39. Laffey JG, Engelberts D, Kavanagh BP: Injurious effects of
hypocapnic alkalosis in the isolated lung. Am J Respir Crit
Care Med 2000, 162:399-405.