Sedation and Analgesia for Diagnostic and Therapeutic Procedures – Part 7 pot
Bạn đang xem bản rút gọn của tài liệu. Xem và tải ngay bản đầy đủ của tài liệu tại đây (344.42 KB, 33 trang )
Opioids to Manage Acute Pediatric Pain 187
154. Gourlay, G. K., Kowalski, S. R., Plummer, J. L., Cousins, M. J., and
Armstrong, P. J. (1988) Fentanyl blood concentration-analgesic response
relationship in the treatment of postoperative pain. Anesth. Analg. 67(4),
329–337.
155. Glass, P. S., Estok, P., Ginsberg, B., Goldberg, J. S., and Sladen, R. N. (1992)
Use of patient-controlled analgesia to compare the efficacy of epidural to
intravenous fentanyl administration. Anesth. Analg. 74(3), 345–351.
156. Gronert, B. J., Davis, P. J., and Cook, D. R. (1992) Continuous infusions of
alfentanil in infants undergoing inguinal herniorrhaphy. Paediatr. Anaesth.
2, 105–109.
157. Davis, P. J., Killian, A., Stiller, R. L., Cook, D. R., Guthrie, R. D., and Scierka,
A. M. (1989) Pharmacokinetics of alfentanil in newborn premature infants
and older children. Dev. Pharmacol. Ther. 13(1), 21–27.
158. Kapila, A., Glass, P. S., Jacobs, J. R., Muir, K. T., Hermann, D. J., Shiraishi,
M., et al. (1995) Measured context-sensitive half-times of remifentanil and
alfentanil. Anesthesiology 83(5), 968–975.
159. Robinson, S. and Gregory, G. A. (1981) Fentanyl-air-oxygen anesthesia for
ligation of patent ductus arteriosus in preterm infants. Anesth. Analg. 60(5),
331–334.
160. Yaster, M. (1987) The dose response of fentanyl in neonatal anesthesia. Anes-
thesiology 66(3), 433–435.
161. Stanley, T. H., Leiman, B. C., Rawal, N., Marcus, M. A., van den Nieuwen-
huyzen, M., Walford, A., et al. (1989) The effects of oral transmucosal fenta-
nyl citrate premedication on preoperative behavioral responses and gastric
volume and acidity in children. Anesth. Analg. 69(3), 328–335.
162. Streisand, J. B., Stanley, T. H., Hague, B., van Vreeswijk, H., Ho, G. H., and
Pace, N. L. (1989) Oral transmucosal fentanyl citrate premedication in chil-
dren. Anesth. Analg. 69(1), 28–34.
163. Feld, L. H., Champeau, M. W., van Steennis, C. A., and Scott, J. C. (1989)
Preanesthetic medication in children: a comparison of oral transmucosal fen-
tanyl citrate versus placebo. Anesthesiology 71(3), 374–377.
164. Nelson, P. S., Streisand, J. B., Mulder, S. M., Pace, N. L., and Stanley, T. H.
(1989) Comparison of oral transmucosal fentanyl citrate and an oral solution
of meperidine, diazepam, and atropine for premedication in children. Anes-
thesiology 70(4), 616–621.
165. Bruera, E., Pereira, J., Watanabe, S., Belzile, M., Kuehn, N., and Hanson, J.
(1996) Opioid rotation in patients with cancer pain. A retrospective compari-
son of dose ratios between methadone, hydromorphone, and morphine. Can-
cer 78(4), 852–857.
166. Goodarzi, M. (1999) Comparison of epidural morphine, hydromorphone and
fentanyl for postoperative pain control in children undergoing orthopaedic
surgery. Paediatr. Anaesth. 9(5), 419–422.
167. Caraco, Y., Sheller, J., and Wood, A. J. (1999) Impact of ethnic origin and
quinidine coadministration on codeine’s disposition and pharmacodynamic
effects. J. Pharmacol. Exp. Ther. 290(1), 413–422.
188 Yaster, Maxwell, and Kost-Byerly
168. Caraco, Y., Sheller, J., and Wood, A. J. (1996) Pharmacogenetic determina-
tion of the effects of codeine and prediction of drug interactions. J. Phar-
macol. Exp. Ther. 278(3), 1165–1174.
169. Krane, E. J. and Yaster, M. (1997) Transition to less invasive therapy, in
Pediatric pain management and sedation handbook (Yaster, M., Krane, E. J.,
Kaplan, R. F., Cote, C. J., and Lappe, D. G., eds.), Mosby Year Book, Inc., St.
Louis, MO, pp. 147–162.
170. Heubi, J. E., Barbacci, M. B., and Zimmerman, H. J. (1998) Therapeutic mis-
adventures with acetaminophen: hepatoxicity after multiple doses in children.
J. Pediatr. 132(1), 22–27.
171. Kearns, G. L., Leeder, J. S., and Wasserman, G. S. (1998) Acetaminophen
overdose with therapeutic intent. J. Pediatr. 132(1), 5–8.
172. Rivera-Penera, T., Gugig, R., Davis, J., McDiarmid, S., Vargas, J.,
Rosenthal, P., et al. (1997) Outcome of acetaminophen overdose in pediat-
ric patients and factors contributing to hepatotoxicity. J. Pediatr. 130(2),
300–304.
173. Kirvela, M., Lindgren, L., Seppala, T., and Olkkola, K. T. (1996) The phar-
macokinetics of oxycodone in uremic patients undergoing renal transplanta-
tion. J. Clin. Anesth. 8(1), 13–18.
174. Leow, K. P., Cramond, T., and Smith, M. T. (1995) Pharmacokinetics and
pharmacodynamics of oxycodone when given intravenously and rectally to
adult patients with cancer pain. Anesth. Analg. 80(2), 296–302.
175. Grond, S., Radbruch, L., and Lehmann, K. A. (2000) Clinical pharmacoki-
netics of transdermal opioids: focus on transdermal fentanyl. Clin. Pharma-
cokinet. 38(1), 59–89.
176. Goldstein-Dresner, M. C., Davis, P. J., Kretchman, E., Siewers, R. D., Certo,
N., and Cook, D. R. (1991) Double-blind comparison of oral transmucosal
fentanyl citrate with oral meperidine, diazepam, and atropine as preanesthetic
medication in children with congenital heart disease. Anesthesiology 74(1),
28–33.
177. Stanley, T. H., Hague, B., Mock, D. L., Streisand, J. B., Bubbers, S.,
Dzelzkalns, R. R., et al. (1989) Oral transmucosal fentanyl citrate (lollipop)
premedication in human volunteers. Anesth. Analg. 69(1), 21–27.
178. Ashburn, M. A., Lind, G. H., Gillie, M. H., de Boer, A. J., Pace, N. L., and
Stanley, T. H. (1993) Oral transmucosal fentanyl citrate (OTFC) for the treat-
ment of postoperative pain. Anesth. Analg. 76(2), 377–381.
179. Streisand, J. B., Varvel, J. R., Stanski, D. R., Le Maire, L., Ashburn, M. A.,
Hague, B. I., et al. (1991) Absorption and bioavailability of oral transmucosal
fentanyl citrate. Anesthesiology 75(2), 223–229.
180. Dsida, R. M., Wheeler, M., Birmingham, P. K., Henthorn, T. K., Avram, M.
J., Enders-Klein, C., et al. (1998) Premedication of pediatric tonsillectomy
patients with oral transmucosal fentanyl citrate. Anesth. Analg. 86(1), 66–70.
181. Portenoy, R. K., Payne, R., Coluzzi, P., Raschko, J. W., Lyss, A., Busch, M.
A., et al. (1999) Oral transmucosal fentanyl citrate (OTFC) for the treatment
of breakthrough pain in cancer patients: a controlled dose titration study. Pain
79(2–3), 303–312.
Opioids to Manage Acute Pediatric Pain 189
182. Epstein, R. H., Mendel, H. G., Witkowski, T. A., Waters, R., Guarniari, K.
M., Marr, A. T., et al. (1996) The safety and efficacy of oral transmucosal
fentanyl citrate for preoperative sedation in young children. Anesth. Analg.
83(6), 1200–1205.
183. Elenbaas, R. M., Iacono, C. U., Koellner, K. J., Pribble, J. P., Gratton, M.,
Racz, G., et al. (1991) Dose effectiveness and safety of butorphanol in acute
migraine headache. Pharmacotherapy 11(1), 56–63.
184. Scott, J. L., Smith, M. S., Sanford, S. M., Shesser, R. F., Rosenthal, R. E.,
Smith, J. P., et al. (1994) Effectiveness of transnasal butorphanol for the treat-
ment of musculoskeletal pain. Am. J. Emerg. Med. 12(4), 469–471.
185. Bennie, R. E., Boehringer, L. A., Dierdorf, S. F., Hanna, M. P., and Means, L.
J. (1998) Transnasal butorphanol is effective for postoperative pain relief in
children undergoing myringotomy. Anesthesiology 89(2), 385–390.
186. Zedie, N., Amory, D. W., Wagner, B. K., and O’Hara, D. A. (1996) Compari-
son of intranasal midazolam and sufentanil premedication in pediatric outpa-
tients. Clin. Pharmacol. Ther. 59(3), 341–348.
187. Karl, H. W., Keifer, A. T., Rosenberger, J. L., Larach, M. G., and Ruffle, J.
M. (1992) Comparison of the safety and efficacy of intranasal midazolam or
sufentanil for preinduction of anesthesia in pediatric patients. Anesthesiology
76(2), 209–215.
188. Chandler, S. (1999) Nebulized opioids to treat dyspnea. Am. J. Hosp. Palliat.
Care 16(1), 418–422.
189. Bostwick, D. G., Null, W. E., Holmes, D., Weber, E., Barchas, J. D., and
Bensch, K. G. (1987) Expression of opioid peptides in tumors. N. Engl. J.
Med. 317(23), 1439–1443.
190. Booth, S., Kelly, M. J., Cox, N. P., Adams, L., and Guz, A. (1996) Does
oxygen help dyspnea in patients with cancer? Am. J. Respir. Crit. Care Med.
153(5), 1515–1518.
191. Zempsky, W. T., and Ashburn, M. A. (1998) Iontophoresis: noninvasive drug
delivery. Am. J. Anesthesiol. 25(4), 158–162.
192. Ashburn, M. A., Gauthier, M., Love, G., Basta, S., Gaylord, B., and Kessler,
K. (1997) Iontophoretic administration of 2% lidocaine HCl and 1:100,000
epinephrine in humans. Clin. J. Pain 13(1), 22–26.
193. Ashburn, M. A., Streisand, J., Zhang, J., Love, G., Rowin, M., Niu, S., et al.
(1995) The iontophoresis of fentanyl citrate in humans. Anesthesiology 82(5),
1146–1153.
194. Ashburn, M. A., Stephen, R. L., Ackerman, E., Petelenz, T. J., Hare, B., Pace,
N. L., et al. (1992) Iontophoretic delivery of morphine for postoperative anal-
gesia. J. Pain. Symptom Manage. 7(1), 27–33.
195. Arnold, J. H., Truog, R. D., Scavone, J. M., and Fenton, T. (1991) Changes in
the pharmacodynamic response to fentanyl in neonates during continuous
infusion. J. Pediatr. 119(4), 639–643.
196. Dagan, O., Klein, J., Bohn, D., and Koren, G. (1994) Effects of extracorpo-
real membrane oxygenation on morphine pharmacokinetics in infants. Crit.
Care Med. 22(7), 1099–1101.
190 Yaster, Maxwell, and Kost-Byerly
197. Franck, L. S., Vilardi, J., Durand, D., and Powers, R. (1998) Opioid with-
drawal in neonates after continuous infusions of morphine or fentanyl during
extracorporeal membrane oxygenation. Am. J. Crit. Care 7(5), 364–369.
198. Paronis, C. A. and Holtzman, S. G. (1992) Development of tolerance to the
analgesic activity of mu agonists after continuous infusion of morphine,
meperidine or fentanyl in rats. J. Pharmacol. Exp. Ther. 262(1), 1–9.
199. Sosnowski, M. and Yaksh, T. L. (1990) Differential cross-tolerance between
intrathecal morphine and sufentanil in the rat. Anesthesiology 73(6), 1141–1147.
200. Duttaroy, A. and Yoburn, B. C. (1995) The effect of intrinsic efficacy on
opioid tolerance. Anesthesiology 82(5), 1226–1236.
201. Suresh, S. and Anand, K. J. (1998) Opioid tolerance in neonates: mechanisms,
diagnosis, assessment, and management. Semin. Perinatol. 22(5), 425–433.
Patient Monitoring During Sedation 191
191
From: Contemporary Clinical Neuroscience: Sedation and Analgesia for Diagnostic and Therapeutic Procedures
Edited by: S. Malviya, N. N. Naughton, and K. K. Tremper © Humana Press Inc., Totowa, NJ
8
Patient Monitoring During Sedation
Kevin K. Tremper, MD, PhD
1. INTRODUCTION
Sedation of patients can only be accomplished safely if the physiologic
effects of the sedative agents are continuously evaluated by a trained indi-
vidual who is assisted by data provided by devices, that monitor the cardiop-
ulmonary system (1). Since sedation is on a continuum from the awake and
alert state to general anesthesia, the monitors employed during sedation
should be similar to those used during the provision of anesthesia. More
than 15 years ago, the American Society of Anesthesiologists (ASA) pub-
lished standards for monitoring during anesthesia (2). These guidelines have
been extended into the post-anesthesia care unit, and have more recently
been applied to sedation (1,3). It is important that the safety standards for
monitoring be maintained regardless of the individuals providing sedation
or the specific environment. This chapter reviews the current guidelines for
monitoring during sedation and the specific devices used to monitor patients,
including a brief description of how they work, and concludes with special
recommendations for monitoring during magnetic resonance imaging
(MRI).
2. MONITORING STANDARDS
In 1986, the ASA published standards for basic anesthetic monitoring
(2). At the time, it was considered somewhat revolutionary for a profes-
sional society to publish specific standards for the provision of medical care.
This was done in the interest of patient safety. It had been well-documented
that patients had been harmed by the inability of clinicians to evaluate oxy-
genation and ventilation by observation alone (4). At the same time, two
devices became available that allowed continuous monitoring of both oxy-
genation and ventilation: the pulse oximeter and the capnometer. The ASA
took the position that all patients should be monitored objectively for oxygen-
ation, ventilation, circulation, and temperature (2). The devices recommended
192 Tremper
to accomplish these monitoring standards were the pulse oximeter for oxy-
genation, the capnometer for ventilation, and a pulse plethysmograph, which
is incorporated into a pulse oximeter for circulation. In addition, the ASA
recommended that blood pressure should be monitored every 5 min and that
temperature monitoring should be available whenever changes are antici-
pated in the patient’s temperature. Although there is some controversy relat-
ing to the cause-and-effect relationship, there is no controversy regarding
the improvement of patient safety that was documented over the subsequent
15 yr (5). The standard application of a pulse oximeter to all patients who
are receiving sedative anesthetic agents has been credited by many to be the
primary reason for improved patient safety. In 1988, similar guidelines were
adapted for the care of patients in the post-anesthesia care unit (3). In this
setting, patients recover from sedative agents and receive analgesics, and
are therefore at high risk for cardiopulmonary depression. It should be noted
that these are standards and not guidelines or recommendations—they are
expressed as the minimum acceptable degree of monitoring, except in emer-
gency situations, when lapses in the standard are unavoidable (Table 1).
Although these standards were developed for anesthesia care, that care
encompasses both general anesthesia and intravenous (iv) sedation for
operative procedures. Once anxiolytics or analgesics are given by any route,
the physiologic result is on a continuum from mild sedation to general anes-
thesia, depending on the dose/response of the individual patient. In 1999,
the ASA published an information bulletin describing the continuum of the
depth of sedation (6) (Table 2). This table describes the continuum of seda-
tion from minimal to general anesthesia by its effects on four physiologic
processes: responsiveness of the patient, airway, spontaneous ventilation,
and cardiovascular function. The method of evaluating each of these levels
of sedation relies on a clinical evaluation of the physiologic effects of the
Table 1
Monitoring Standards
I. Qualified personnel
II. Oxygenation, ventilation, circulation and temperature
A. Oxygenation: pulse xximetry, SpO
2
B. Ventilation: respiratory rate, capnography if intubated
C. Circulation: blood pressure every 5 min, NIBP, pulse monitoring
(pulse oximetry)
D. Temperature
Basics of Anesthesia 4th ed., (Stoelting, R. K., and Miller, R. D., eds.), Churchill Livings-
ton, NY, Appendix 2, p. 475.
Patient Monitoring During Sedation 193
Table 2
Continuum of Depth of Sedation
Definition of General Anesthesia and Levels of Sedation/Analgesia
Moderate Sedation/
Minimal sedation Analgesia Deep Sedation/
(anxiolysis) (“Conscious Sedation”) Analgesia General anesthesia
Responsiveness Normal response to Purposeful response to Purposeful response Unarousable even with
verbal stimuli verbal or tactile following repeated or painful stimulus
stimulation painful stimulation
Airway Unaffected No intervention required Intervention may be Intervention often required
required
Spontaneous Unaffected Adequate May be inadequate Frequently inadequate
ventilation
Cardiovascular Unaffected Usually maintained Usually maintained May be impaired
function
193
194 Tremper
agents. As noted in Table 2, the difference between moderate sedation anal-
gesia and deep sedation analgesia may be difficult to assess and may change
very quickly, even when small doses of medications are administered. It
therefore requires continuous observation by a trained individual who is not
specifically involved in the procedure being performed. The ASA published
practice guidelines for sedation and analgesia by non-anesthesiologists in
1996 (4). A practice guideline is not as rigorous a statement as a standard. It
would be difficult for one professional society to invoke standards on all
other health care professionals. Nevertheless, since anesthesiologists are the
specialists most trained and capable of providing sedation analgesia and
managing the complications, it is reasonable that their society should make
judicious recommendations (4). These guidelines are divided into 14 sec-
tions starting with a patient pre-operative evaluation and continuing through
procedure preparation, monitoring, staffing, training required, use of the
medications, recovery, and special situations. These guidelines can be
quickly found on the ASA website under the section entitled “Professional
Information,” which includes a variety of practice guidelines (4). The sec-
tion on monitoring covers the monitored variables as well as the recom-
mended documentation of those parameters. The specifics of the monitoring
are outlined in Table 3, and include level of consciousness, pulmonary ven-
tilation, oxygenation, and hemodynamics. It is recommended that level of
consciousness be monitored by an individual whose primary purpose is to
monitor the patient and not be involved in the procedure, except for minor
tasks that require only brief moments away from direct observation of the
patient. The method of monitoring level of consciousness is by verbal
response, and tactile response as described in Table 3. Although this level of
consciousness monitoring is not objectified in a scale by the ASA, at the
University of Michigan a numerical score has been developed to quantitate
Table 3
Monitoring Guidelines
Level of Consciousness Spoken response and response to painful stimulus
Pulmonary ventilation Observation of respiration. If patient is physically not
in view, then an apnea monitor should be used
Oxygenation Pulse oximetry
Hemodynamics Vital signs: blood pressure, heart rate and pulse,
electrocardiography monitoring in patients with
cardiac disease
Patient Monitoring During Sedation 195
the levels of sedation that have been defined in a very similar way (Table 4).
This scale has been very useful at the University of Michigan for both pedi-
atric and adult patients (7).
Ventilatory depression is the most common serious adverse consequence
of providing sedation by any route. The ASA Task Force recommended that
respiratory rate be monitored by visual observation at all times. When it is
difficult or impossible to observe respiration because of physical limitations
of the location (such as in MRI) the Task Force recommends the use of
apnea monitoring using exhaled carbon dioxide. This technique is described
in Subheading 6., page 210.
The most serious consequence of over-sedation and apnea is hypoxemia.
For this reason, the pulse oximeter has become a ubiquitous device in all
clinical situations in which apnea or hypoxemia is a potential concern. It is
only logical that the Task Force recommends continuous monitoring by
pulse oximeter, to provide continuous assessment of oxygenation as well as
continuous monitoring of the patient’s pulse. This Task Force emphasized
that pulse oximetry does not substitute for monitoring ventilation—i.e., patients
may have adequate hemoglobin saturation—especially when given supple-
mental oxygen—and at the same time become progressively hypercarbic
because of respiratory depression.
The final monitoring recommendation involved methods of assessing
hemodynamic stability. This group recommends that blood pressure be mea-
sured before the procedure, after the analgesics are provided, at “frequent
intervals” during the procedure, at the end of the procedure, and prior to
discharge. There is no specific definition of “frequent intervals”—it is there-
fore left to the judgement of the practitioner. The most recent pediatric sedation
guidelines from the American Academy of Pediatrics (AAP) recommends
that blood pressure be monitored before the procedure and during recovery.
Blood pressure measurement during the procedure is left to the discretion of the
Table 4
University of Michigan Sedation Scale
0 Awake and alert
1 Lightly sedated: Tired/sleepy, appropriate response to verbal
conversation and/or sound
2 Sedated: Somnolent/sleeping, easily aroused with light tactile stimulation
or a simple verbal command
3 Deeply sedated: Deep sleep, arousable only with significant physical
stimulation
4 Unarousable
196 Tremper
monitoring individual because this procedure may rouse a sedated child, thus
interfering with completion of the procedure. The task force also recommends
that electrocardiogram (ECG) monitoring be used in patients with cardiovascu-
lar disease, but this is not required in patients with no cardiovascular disease.
Finally, there are recommendations regarding the recording of these
monitored parameters. The specific frequency of recording these parameters
is again left to the judgement of the practitioner, but the report recommends
that at a minimum all cardio-respiratory parameters be recorded before the
beginning of the procedure, after the administration of the sedative agents, upon
completion of the procedure, during recovery, and at the time of discharge. If
this recording is being accomplished by an automatic device, it should have
alarms set to alert the team of critical changes in the measured parameters.
Even with the availability of a capnometer, pulse oximeter, ECG and a
blood pressure device, safe monitoring of a sedated patient requires an indi-
vidual who is dedicated to that purpose. It is specifically stated that the prac-
titioner who performs the procedure should not be that individual. The
individual dedicated to monitoring the patients may have interruptable tasks
in assisting the practitioner who is performing the procedure, but these inter-
ruptions should be of very short duration. Clearly, the individual monitoring
the patient and recording the physiologic parameters must understand the
consequences of the sedative agents and know how to respond to an adverse
event such as apnea or desaturation. This individual must therefore be trained
in the pharmacology of the agents provided as well as their antagonists, and
must be knowledgeable about the monitoring devices being used and how to
recognize the common physiologic consequences of apnea, desaturation, and
hypotension. At least one of the individuals involved must be capable of
establishing a patent airway and providing positive pressure ventilation if
apnea occurs. There must be an individual immediately available who has
advanced life-support skills.
If the clinician could choose only one monitoring device to be used dur-
ing sedation, it would clearly be pulse oximetry. Since this device continu-
ously provides a measurement of oxygenation and pulse rate, it continuously
evaluates the two essential aspects of cardiopulmonary physiology—oxygenation
and peripheral perfusion. For this reason, the following section provides
great detail, in the clinical as well as the technical aspects of the device.
3. OXYGENATION MONITORING: PULSE OXIMETRY
Since its development in the early 1980s, pulse oximetry has been widely
adopted in clinical medicine (8). It is currently the standard of care for moni-
toring all patients during surgical procedures, in recovery rooms, and criti-
Patient Monitoring During Sedation 197
cal care units, and in any situation in which oxygenation may be in question
or at risk. It has been selected as the primary monitor to assess patients’
physiologic well-being during sedation, and is an ideal technique for moni-
toring these patients because it continuously and noninvasively assesses oxy-
genation and pulse. Pulse oximetry does this without requiring calibration
or technical skill by the user. However, it is important that caregivers using
the technique to assess patient status are knowledgeable of the meaning of
the data provided and the limitations of that data as well as the limitations of the
device. To best understand the limitations of the device, it is useful to under-
stand the fundamental principles that the device employs to determine satu-
ration and pulse. Subheading 3.1. therefore reviews the definition and
meaning of the term “hemoglobin saturation,” the methods of measuring
saturation, how pulse oximeters estimate saturation noninvasively, and finally
situations in which the device may be unable to provide data or provide
misleading data (9).
3.1. Hemoglobin Saturation
Because oxygen is not effectively stored in the human body, aerobic
metabolism depends on a constant supply. The amount of oxygen contained
within blood-perfusing tissue is known as the oxygen content, which is
defined as the number of ccs of oxygen contained within 100 ccs of blood.
CaO
2
= 1.34 × Hb × SaO
2
+ 0.003 × PaO
2
(1)
CaO
2
= Oxygen content mL/dL
1.34 = The number of mL of oxygen contained on one saturated
gram of hemoglobin per 1 dL of blood
Hb = The grams of hemoglobin per dL of blood
SaO
2
= Hemoglobin saturation, %
0.003 = The solubility constant of oxygen in water
PaO
2
= The arterial oxygen partial pressure in mmHg
Since oxygen has a very low solubility in water, the carrying capacity of
blood is dramatically increased with the addition of hemoglobin. One gram
of hemoglobin carries approximately 1
1
/
3
cc of oxygen per dL, so that a
patient with a normal hemoglobin of 15 g could carry approximately 20 cc
of oxygen if the hemoglobin were completely filled (saturated) with oxy-
gen. A hemoglobin molecule can carry four oxygen molecules. These sites
are filled in a cooperative binding method as the oxygen tension surround-
ing the hemoglobin increases. Hemoglobin saturation is defined as the
amount of hemoglobin with oxygen attached divided by the total amount of
hemoglobin present per dL of blood. Hemoglobin with oxygen on it is
198 Tremper
termed oxyhemoglobin (HbO
2
) and hemoglobin without oxygen on it is
termed reduced hemoglobin (Hb).
Hemoglobin Saturation = [HbO
2
/(HbO
2
+ Hb)] × 100% (2)
This definition of hemoglobin saturation has been termed as functional
hemoglobin saturation because it incorporates the two hemoglobin forms
that function in oxygen transport—i.e., HbO
2
and Hb. Other forms of hemo-
globin are present in small concentrations in healthy individuals, which may
be in larger concentrations in pathologic conditions. Carbon monoxide has
800 times the affinity for hemoglobin than oxygen. Thus, if hemoglobin is
exposed to carbon monoxide, it will form carboxyhemoglobin (COHb) and
displace HbO
2
. This form of hemoglobin does not contribute to oxygen
transport. The iron in the heme of the hemoglobin is usually in the ferric
form (Fe
+++
). When it is reduced to the ferrous (Fe
++
), it is called methemo-
globin (metHb), and it will also not transport oxygen. When these hemoglo-
bin species are present, they are part of the total measured hemoglobin and
therefore must be considered when saturation is calculated. The term “frac-
tional hemoglobin saturation” is defined as HbO
2
divided by total hemoglobin.
Fractional Saturation = [HbO
2
/(HbO
2
+ Hb + COHb + MetHb)] × 100% (3)
Looking at Eq. 2 and Eq. 3, it is clear that even if all the reduced hemo-
globin is oxygenated and functional saturation is 100%, the presence of sig-
nificant amounts of metHb and COHb will produce a lower fractional
saturation. It is important to understand the differences between functional
and fractional saturation because the pulse oximeter provides different infor-
mation when either metHb or COHb are present. This information may not
correspond to that provided by saturation measured in the clinical chemistry lab.
Assuming that no metHb or COHb are present, the relationship between
oxygen tension and hemoglobin saturation is represented by the sigmoidal
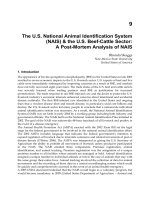
hemoglobin dissociation curve shown in Fig. 1. When the oxygen tension
increases above 90 mmHg, the hemoglobin is nearly 100% saturated. Nor-
mal healthy patients will have a saturation between 95% and 100% while
breathing room air. A saturation of 95% corresponds to approximate PaO
2
of 75 mmHg, and a saturation of 90% corresponds to a PaO
2
of 60 mmHg.
Once the PaO
2
drops below 60, the saturation drops more rapidly. A sim-
plistic algorithm to remember the relationship between PaO
2
and saturation
as the oxygen tension drops below 90 is given below.
PaO
2
Ϸ saturation – 30 (For a PaO
2
from 60 to 45) (4)
Normal mixed venous saturation is approx 75%, corresponding to a mixed
venous oxygen tension (PvO
2
) of 40 mmHg. Note that the body usually ex-
Patient Monitoring During Sedation 199
tracts about 25% of the oxygen attached to the hemoglobin as it passes
through the tissue—i.e., arterial saturation 98%, mixed venous saturation
73%. This allows for some margin of safety. If the arterial saturation de-
clines, additional oxygen may be extracted from the hemoglobin. Unfortu-
nately, this occurs at the expense of lower and lower PO
2
values at the tissue
level.
Another important point on the HbO
2
association curve is the P50. This is
defined as the oxygen tension at which 50% of the hemoglobin is saturated.
The P50 is 26.7 mmHg at 37°C and 7.4 pH. The curve can shift to the right
with increasing temperature, acidosis, and increasing 2–3 DPG (a protein
that affects the affinity of hemoglobin for oxygen). Bank blood loses its
2–3 DPG very quickly and therefore can theoretically decrease the P50 of
hemoglobin after a transfusion. This effect is not usually clinically signifi-
cant, because the 2–3 DPG is quickly reestablished once the blood is in
circulation. Fetal hemoglobin has a much lower P50 (a higher affinity for
oxygen), thus shifting the curve to the left (P50 Ϸ 19 mmHg). This is neces-
sary so that the fetal blood can extract oxygen at a lower oxygen tension
than the maternal blood perfusing the uterus.
Fig. 1. The O
2
dissociation curve relation PO
2
and SaO
2
in man at 37° C, pH = 7.4.
From ref. (36).
200 Tremper
3.2. Measurement of Hemoglobin Saturation
Equation 2 defines functional hemoglobin saturation. To measure this, it
is necessary to measure the concentration of HbO
2
and Hb and then form the
ratio of HbO
2
/(HbO
2
+ Hb). Measuring the concentration of any of the hemo-
globin species in solution can be accomplished by using the principle of
optical absorption or Beer’s Law. This law states that the concentration of a
substance dissolved in a solution can be determined if a light of known wave-
length and intensity is transmitted through a known distance through the
solution. Fig. 2 illustrates this principle. If hemoglobin is placed in a cuvet
of known dimensions and light is shined through the container, the concen-
tration of hemoglobin can be calculated if the incident light intensity and the
transmitted light intensity are both measured.
I
t
=I
i
e
–dcα
(5)
c=1/dx ln I
i
/I
t
(5a)
The above equation is known as Beer’s Law, where:
I
i
= the incident light intensity
I
t
= the transmitted light intensity
d=the path length of light
α = the absorption coefficient for hemoglobin
c=the concentration of hemoglobin that is being determined
Fig. 2. The concentration of a solute dissolved in a solvent can be calculated
from the logarithmic relationship between the incident and transmitted light inten-
sity and the solute concentration. From ref. (36).
Patient Monitoring During Sedation 201
Therefore, if the incident and transmitted light intensity are known and
the path length of light is known, then the concentration of hemoglobin can
be measured if the absorption coefficient α is known. The absorption coeffi-
cient for Hb, HbO
2
and metHb and COHb are presented in Fig. 3. All of
these absorption coefficients vary as a function of the wavelength of light
used. If the light is of a known wavelength, then one hemoglobin concentra-
tion can be measured for each wavelength of light used—i.e., one equation
and one unknown. If we need to measure both HbO
2
and Hb, then it would
require at least two wavelengths of light to form two Beer’s Law equations
and solve for the two unknown concentrations—i.e., Hb and HbO
2
. If met
Hb and COHb are also present we would want to measure fractional satura-
tion (Eq. 3) and require at least four wavelengths of light to produce four
equations to solve for the four concentrations of the hemoglobin species
present. The device that uses this method of measuring hemoglobin concen-
tration and hemoglobin saturation is called a co-oximeter. This optical absorp-
tion technique is used to measure the concentration of many substances in
science and in medicine—for example, the capnometer that will be described
in a later section and bilirubin concentration in the plasma. When an arterial
Fig. 3. Transmitted light absorbance spectra of four hemoglobin species; oxyhe-
moglobin, reduced hemoglobin, carboxyhemoglobin, and methemoglobin. From
ref. (37).
202 Tremper
blood sample is sent to a blood gas laboratory, the PaO
2
, PCO
2
(carbon diox-
ide tension) and pH are measured and the saturation is often presented with
the blood gas results. This saturation is usually not measured but determined
from the HbO
2
dissociation curve, Fig. 1. If the clinician wants to know the
measured saturation—including metHb and COHb concentration, then a
blood saturation measurement must be requested and the results will be pre-
sented in the form of percent saturation for all the constituents—i.e., HbO
2
,
metHb, COHb. These results usually do not present a reduced hemoglo-
bin—it is what is left over after the other hemoglobin saturations are added,
because they all must sum to 100%.
3.3. Pulse Oximeters
Some of the first clinical measurements in hemoglobin saturation were
done noninvasively through human tissue. During World War II, aviation
research needed a device that could determine at what altitude supplemental
oxygen was required. To accomplish this, an oximeter was developed which
transilluminated the human ear. The device effectively used the ear as the
test tube containing hemoglobin. A light source was placed on one side of the
earlobe and a light detector on the opposite side. Since the light was absorbed
not only by hemoglobin in the blood but also by skin and other tissues, the
device needed to be zeroed to the light absorbance of the non-blood tissue.
This was accomplished by compressing the ear to eliminate all the blood
and then measuring the absorbance resulting from the bloodless tissue. This
absorbance was considered the zero point and when the pressure was re-
lieved, the additional absorbance was caused by the blood returning to the
ear. This blood was not only arterial blood, but also venous and capillary
blood. To obtain a signal that was related to arterial hemoglobin saturation,
the device was heated to 40° centigrade, thereby making the ear hyperemic
and producing a signal that was predominately related to arterial blood. This
ear oximeter was used after World War II in clinical physiologic studies
and in early studies monitoring patients in the operating room (8). Unfortu-
nately, this early ear oximeter was difficult to use as a clinical monitor be-
cause it required calibration on each patient, and heating of the ear which
often caused burns if it is left in one place too long.
In the mid 1970s, an engineer working in Japan was using an ear oxime-
ter as a noninvasive method to measure cardiac output. The proposed tech-
nique involved injecting a dye in a vein and then using the ear oximeter to
detect the light absorption caused by that dye as it circulated and perfused
the ear. This noninvasive ear dye dilution cardiac output technique was not
successful, but the engineer noted an interesting phenomena during his stud-
Patient Monitoring During Sedation 203
ies. There was a pulsatile absorbance signal from the oximeter that fluctu-
ated with the heart rate. He then postulated that if this pulsatile component
were analyzed, it would be related to arterial blood, thereby negating the
necessity to compress the ear or to heat the probe when trying to determine
an arterial signal from the oximeter. By the early 1980s, this technique of ana-
lyzing the pulsatile absorbance signal became known as pulse oximetry, and
was being developed as a routine clinical monitor for intra-operative and
postoperative use. Therefore, the basic premise of a pulse oximeter is that
the pulsatile component of the absorption signal must be produced by arte-
rial blood (Fig. 4). Although the pulsatile signal is related to arterial blood,
determining actual arterial saturation from this signal is not easily accom-
plished. Pulse oximeters use two frequencies of light in the red and infrared
range, 660 nm red light and 940 nm infrared light. It was clear that the ampli-
tude of the signal in the red range of light and the infrared range of light
changed as the amount of HbO
2
and Hb changed. The pulse-added absor-
bance in these two frequency changes with the change in arterial saturation,
but the specific relationship must be determined empirically from data de-
rived from human volunteer studies. Pulse oximeters were placed on sub-
jects as they breathed low inspired oxygen and arterial blood samples were
drawn. Samples were analyzed by laboratory co-oximeters to determine the
actual arterial saturation relative to the pulse oximeter reading. Fig. 5 illus-
trates a calibration curve between the ratio of pulse-added red and infrared
absorbance signal (R) from the pulse oximeter and measured arterial blood
saturation.
Fig. 4. Light absorption through living tissue. The alternating current signal is
caused by the pulsatile component of the arterial blood; the direct current signal
comprises all the non-pulsatile absorbers in the tissue, non-pulsatile arterial blood,
non-pulsatile venous and capillary blood and all other tissues (Modified from
Ohmeda Pulse Oximeter Model 3700 Service Manual, 1986, pp. 22.)
204 Tremper
R = ∆Red/∆IR (6)
Note that when the ratio of pulse added red to pulse added infrared light is
one, the saturation is approx 85%. This fact has interesting clinical conse-
quences, which will be noted on page 205 when methemoglobin is discussed.
The principles of pulse oximeters can be summarized with the following
three simple statements. First, the device measures the pulsatile component
of light absorbance in two frequencies. Second, it assumes that that pulsatile
absorbance is produced by the arterial blood pulsations in that tissue. Third,
this ratio of absorbances is empirically calibrated to arterial hemoglobin
saturation (SaO
2
) so that the device can present saturation values, SpO
2
.
3.4. Problems with Pulse Oximetry
Pulse oximeters have become so valuable clinically because they are easy
to use and easy to interpret, and are fairly reliable in providing valuable
information regarding oxygenation and pulse. There are several circum-
Fig. 5. This is a typical pulse oximeter calibration curve. Note that the SaO
2
estimate is determined from the ratio (R) of the pulse-added red absorbance at 660 nm
to pulse-added infrared absorbance at 940 nm. The ratios of red to infrared absor-
bances vary from approx 0.4 at 100% to 3.4 at 0% saturation. Note that the ratio of
red to infrared absorbance is one at a saturation of approx 85%. This curve can be
approximated on a theoretical basis, but for accurate predications of SpO
2
, experi-
mental data are required. Adapted from ref. (38).
Patient Monitoring During Sedation 205
stances in which the device may have difficulty providing an accurate SpO
2
value or may even provide a misleading saturation value. Problem areas can
be divided into three types: the presence of dyes or abnormal hemoglobins
within the blood; low perfusion signals; and artifacts resulting from motion
or light. These last two problems both involve signal-to-noise ratio—i.e.,
either low signal or high noise.
When dye is injected intravenously, it may very likely provide a transient
error in pulse oximetry if that dye absorbs light in the red or infrared range.
The most common dye to produce this problem is methylene blue, which
will cause a transient (few minute) drop in saturation to as low as 50% satu-
ration. Since this is only a transient effect, it is not a significant clinical
issue. Carboxy or methemoglobin poisoning may cause a more significant
and complex problem with pulse oximeters (10,11). COHb is bright red and
is interpreted by the pulse oximeter as HbO
2
. Therefore, in a patient who is
suffering from carbon monoxide poisoning, the pulse oximeter will not be
able to detect the presence of COHb and will give the false impression that
the patient has a normal hemoglobin saturation. The SpO
2
value will present
a value which is the sum of HbO
2
and COHb. Methemoglobin has a more
interesting effect on pulse oximeters. Methemoglobin produces a dark
brownish color of blood, which strongly absorbs light in both the red and
infrared range. Thus, it causes a very large pulsatile absorbance that is
equally distributed in both light ranges and overwhelms the HbO
2
and Hb
signal usually detected by the pulse oximeter. Because this large absorbance
is equal in both the numerator and the denominator (Eq. 6) it forces the ratio
to one, which is interpreted by the pulse oximeter as a saturation of approx
85% (Fig. 5). Therefore, if a patient is suffering from metHb toxicity, the
pulse oximeter usually reads in the mid 80s, regardless of the patient’s actual
saturation (11). This problem has a significant clinical potential because
metHb toxicity can be easily caused by an overdose of the local anesthetic
benzocaine. Benzocaine is the main constituent of the topical spray known
as Hurricane Spray
®
. This anesthetic spray is frequently used to topicalize
the airway during endoscopic procedures. Unfortunately, this spray contains
20% benzocaine—i.e., 200 mg/mL per cc, and can quickly produce high
levels of metHb when systemically absorbed (12).
A low perfusion or low-pulse amplitude signals will make it difficult for a
pulse oximeter to determine an accurate saturation value. The device will go
into a pulse-search mode and ultimately produce no saturation value. Modern
devices have low signal cutoffs that will not allow the device to “guess” at a
saturation if the signal strength is too weak. This can occur when patients have
severe peripheral vascular disease or shock syndrome, or are cold. If pulse
206 Tremper
oximeters cannot produce a signal when placed on a finger, they may derive a
signal on the ear or may work when placed on the bridge of the nose.
Large artifacts resulting from motion are probably the most troublesome
problem for pulse oximetry. When patients move their extremities, they
cause pulsations of the venous blood that are superimposed on the pulsa-
tions of the arterial blood. The pulse oximeter has significant difficulty in
discriminating between the two pulsatile signals, one at a low saturation at
the motion rate and the other at the arterial saturation at the pulse rate. Because
there is more venous blood in tissue than arterial blood, the device may
frequently choose to present a value that is more like the venous saturation
than the arterial saturation. Therefore when patients move their extremities,
it is not uncommon to see the saturation drop to the low 90s and into the 80s
very quickly, but when the extremity stops moving the saturation will
quickly jump back to the 90s. This is most likely a result of the motion
artifact causing venous pulsations. Newer-generation devices are specifi-
cally designed to identify venous pulsations during motion and eliminate
them from the signal (13–15). As these second-generation pulse oximeters
become more readily available, the problems with motion artifact should be
significantly reduced.
Finally, pulse oximeters will have difficulty in detecting the fluctuating
absorbance signal of the red and infrared light if they have a large ambient
background light producing a noise signal. Therefore, whenever the pulse
oximeter probe is in the presence of a bright light that may be fluctuating at
a high frequency, it is best to cover the probe with an opaque material to
eliminate that light “noise” and allow the device to calculate its ratios of
pulsatile absorbances and present a more accurate saturation.
4. BLOOD PRESSURE MONITORING: NONINVASIVE BLOOD
PRESSURE MONITORING (NIBP)
Blood pressure and heart rate are the primary physiologic parameters used
to document hemodynamic stability. A blood pressure reading in the normal
range documents adequate perfusion pressure and implies adequate cardiac
output (assuming a normal systemic vascular resistance). Arterial blood
pressure can be measured in a variety of ways, but unfortunately the results
differ slightly with each technique, whether it is invasive or noninvasive
(16,17). The gold standard is still the manual measurement, using a Riva-
Rocci cuff and listening for Korotkoff sounds. The width of the blood pres-
sure cuff should be 20–30% of the circumference of the limb, and the
pneumatic bladder should span at least half the circumference while it is
centered over the artery (17). If the cuff is too narrow, the blood pressure
values will be too high and vice versa. The deflation rate can affect accu-
Patient Monitoring During Sedation 207
racy. If the pressure in the cuff is deflated too quickly, the estimated blood
pressure is usually too low. The recommended deflation rate is approx 3 mmHg
per s (18,19).
Korotkoff sounds consist of a complex series of audible frequencies that
are produced by turbulent blood flow on the arterial wall and a shock wave
created as the external occluding pressure is reduced on the major artery
being compressed. The Phase I sound (the first sound) is heard as the cuff is
deflated, and is defined as a systolic blood pressure. As the cuff is fully
deflated, the character of the sound changes, becomes muffled, and finally
is absent. The diastolic pressure is recorded as the sound becomes muffled
or becomes absent. Clearly there is significant subjectivity in the measure-
ment as well as patient-to-patient variation and tester-to-tester variation. In
spite of these limitations the manual measurement of blood pressure by aus-
cultating Korotkoff sounds is still considered the gold standard.
4.1. NIBP
In the late 1970s, continuous noninvasive automatic blood pressure devices
became available. The first devices were developed using two different tech-
nologies. One relied upon a small microphone placed within a blood pressure
cuff, which attempted to identify Korotkoff sounds. This method was known as
auscultatory NIBP. Unfortunately, because of a variety of technical problems
and errors associated with multiple artifacts, this technique was not widely
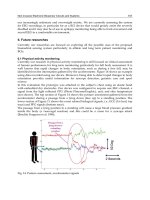
accepted. The second technique, known as oscillometric blood pressure,
has become the standard of NIBP measurement. In this method a cuff is auto-
matically inflated and the pressure oscillations within the cuff are measured as
the pressure is reduced. The onset of oscillation occurs just before the systolic
pressure. As the cuff is deflated further, there is an increase in cuff oscillation
pressure as noted in Fig. 6 (17). These cuff pressure oscillations increase to a
maximum which occurs at the mean arterial pressure (MAP). Further reduction
in cuff pressure reduces the oscillations until they are back to a baseline amplitude
at the point near the diastolic pressure. These devices most accurately measure the
MAP and use sophisticated algorithms programmed into the microprocessors to
predict systolic and diastolic pressure with a high level of consistency. Although
these blood pressure data are not equal to those obtained with a manual method,
they are consistent. Movement of the arm during blood pressure measurement
causes significant error, which will usually result in a non-reported value. The
devices can be programmed for repeating blood pressure measurements at any
time interval down to 1 min. There are concerns that repeated blood pressure
measurements at high frequencies can result in ulnar nerve palsies, superficial
thrombophlebitis, and even compartment syndrome. Fortunately, these are very
rare problems. In general, blood pressure is checked every 5 min during sedation
208 Tremper
or anesthesia and only more frequently when there is hemodynamic instability.
The primary advantages of NIBP devices are their uniformity in data presenta-
tion and their ability to produce a blood pressure measurement while practitio-
ners are free to do other tasks such as treating the patient.
5. ECG MONITORING
It is important to document heart rate in all patients who are receiving
sedation. Generally, this is accomplished continuously by the pulse oxime-
Fig. 6. NIBP, oscillometric blood pressure measurement. The figure illustrates the
method for oscillometric blood pressure measurement. The upper graph measures the
total pressure in the blood pressure cuff, and the lower graph represents the oscillat-
ing pressure within the cuff. Starting on the right depicts the point at which the blood
pressure cuff is fully inflated to a point higher than the systolic blood pressure. As the
pressure in the cuff is progressively lowered at the point, Oscillometric Systolic (145),
systolic pressure oscillations are felt within the cuff. Those oscillations increase as
the total pressure in the cuff decreases to peak oscillations, which occurs at the MAP.
With further cuff deflation the oscillations decrease until they are back to baseline,
the point known as the diastolic blood pressure. The most accurate pressure measure-
ment is the mean pressure; the systolic and diastolic are estimates. The upper portion
of the figure also depicts the point at which Korotkoff sounds are heard, initiating at
the systolic pressure and decreasing at the diastolic pressure. (Reproduced with
permisison from ref. [39], Churchill Livingston, 2000).
Image Not Available
Patient Monitoring During Sedation 209
ter and intermittently by the measurement of NIBP. Both of these devices
generate a pulse rate that is a byproduct of their primary determinations of
saturation and blood pressure, respectively. In patients with a history of car-
diac disease, it is recommended that an ECG also be used to monitor the
patient (4). An in-depth discussion of the ECG and electrocardiographic
monitoring is beyond the scope of this chapter. There are several excellent
texts on this subject (20–22). In the setting of sedation for minor surgical
and medical procedures ECG monitoring should be used for the gross detec-
tion of dysrhythmias and potentially myocardial ischemia. If the patient
becomes symptomatic with chest pain or shortness of breath, the procedure
should be discontinued for a more in-depth evaluation of the patient’s car-
diac status and a 12-lead ECG. A three-electrode system is generally suffi-
cient to monitor patients for these short procedures even if they have a
history of significant cardiac disease. The leads are placed on the right arm
(white), left arm (black), and the left leg (red). Lead two is generally moni-
tored for it provides a good view of the P-wave and the ability to detect
dysrhythmias. Unfortunately, this three-lead system is not sensitive for
detecting myocardial ischemia frequently occurring in the left ventricle. For
this reason, there have been several modifications of lead placement recom-
mended to improve the ability to detect ischemia (22). Most of these modi-
fications attempt to represent a standard V5-lead view of the heart (Fig. 7).
The most popular placement is known as the CS
5
modification. In this situ-
ation, the right arm lead (white lead) is kept at its standard location, while
the left arm lead (the black lead) electrode is placed in the V5 position—i.e.,
the anterior axillary line at the fifth intercostal space (Fig. 8). The left leg
electrode is left in its standard position. This CS
5
modification has been
demonstrated to be as accurate as a V5 lead for detecting left ventricular
ischemia (23).
In patients with a more significant potential of ischemia, it is best to use a
five-lead ECG system illustrated in Fig. 7. With a five-lead configuration, it
is recommended that both leads II and V be monitored continuously to detect
ischemia. It has been reported that 75% of the 12-lead ECG detectable
ischemia is detected by a single V5 lead. This can be increased to 80% if
both lead II and lead V5 are continuously monitored (23,24).
It is important to realize that ECG monitoring only monitors the electrical
activity of the heart and does not ensure oxygenation, ventilation, or hemo-
dynamic stability. It is for this reason that the other monitors—i.e., blood
pressure and pulse oximetry and observation of ventilation—are essential
monitors during sedation, and ECG monitoring is only added when a patient
has a significant history of cardiac disease.
210 Tremper
6. VENTILATION MONITORING—CAPNOGRAPHY
Continuously sampling the carbon dioxide from the airway is known as
capnography, although referred to clinically as end-tidal CO
2
monitoring.
Capnometry is derived the Greek word “kapnos,” meaning smoke, carbon
dioxide (CO
2
) being the “smoke” of cellular metabolism. After it is produced
in the mitochondria, CO
2
is removed from the tissue by diffusion down a
partial pressure gradient to the capillary blood. The venous circulation then
transports carbon dioxide to the right heart, where it is then pumped through
the pulmonary circulation equilibrating with the alveolar gas. It is then venti-
lated to the atmosphere with each expiration. The shape and physiologic
significance of the capnogram had to await the development of rapidly
responding CO
2
analyzers. Today these devices are readily available using
infrared absorption to measure CO
2
. To obtain an accurate capnogram and
avoid contamination with room air, patients must be intubated. Since this is
usually not the case for patients undergoing sedation, the discussion of the
interpretation of the capnogram is beyond the scope of this chapter. The
reader is referred to excellent texts on this topic (25,26). When capnography
is applied to non-intubated patients it is used as a method of measuring res-
Fig. 7. Standard five-lead ECG system consisting of four extremity electrodes
and the V5 lead. The V5 lead detects left ventricular ischemia. RA = right arm,
LA = left arm, RL = right leg, LL = left leg. (Reproduced with permisison from ref.
[40], Mosby Year Book, 1992).
Patient Monitoring During Sedation 211
piratory rate by counting the peaks in the CO
2
wave with each expiration. It
is important to remember that the presence of a capnogram also ensures
pulmonary perfusion and thus cardiac output. A depression in the peak of
the CO
2
tracing can be caused by either a contamination of the expired gas
sample with room air (air has virtually no carbon dioxide) or more impor-
tantly, a depression in cardiac output.
6.1. Capnography in Non-Intubated Patients
When a capnometer is used to monitor ventilation in a non-intubated patient,
there are technical problems in obtaining an accurate continuous sample of
the respiratory gases. In intubated patients the system is “closed,” and there-
fore the expired gas sample at the endotracheal tube is a very accurate mea-
surement of the respiratory gases. In non-intubated patients a sampling
Fig. 8. Modified bipolar standard limb lead system: MCL
1
, CS
5
, CM
5
, CB
5
, CC
5
.
(Reproduced with permisison from ref. [41], Churchill Livingston, 1987).