Báo cáo y học: " The role of the humoral immune response in the molecular evolution of the envelope C2, V3 and C3 regions in chronically HIV-2 infected patients" pdf
Bạn đang xem bản rút gọn của tài liệu. Xem và tải ngay bản đầy đủ của tài liệu tại đây (548.19 KB, 12 trang )
BioMed Central
Page 1 of 12
(page number not for citation purposes)
Retrovirology
Open Access
Research
The role of the humoral immune response in the molecular
evolution of the envelope C2, V3 and C3 regions in chronically
HIV-2 infected patients
Pedro Borrego
1
, José Maria Marcelino
2
, Cheila Rocha
1
, Manuela Doroana
3
,
Francisco Antunes
3
, Fernando Maltez
4
, Perpétua Gomes
5,6
, Carlos Novo
2
,
Helena Barroso
1,6
and Nuno Taveira*
1,6
Address:
1
URIA-CPM, Faculdade de Farmácia de Lisboa, Avenida das Forças Armadas, 1649-019 Lisbon, Portugal,
2
UTPAM, Departamento de
Biotecnologia, Instituto Nacional de Engenharia Tecnologia e Inovação, Estrada Paço Lumiar 22, 1649-038 Lisbon, Portugal,
3
Serviço de Doenças
Infecciosas, Hospital de Santa Maria, Avenida Professor Egas Moniz, 1600-190 Lisbon, Portugal,
4
Serviço de Doenças Infecciosas, Hospital de
Curry Cabral, Rua Beneficência 8, 1050 Lisbon, Portugal,
5
Laboratório de Biologia Molecular, Serviço de Medicina Transfusional, Centro
Hospitalar Lisboa Ocidental, Hospital Egas Moniz, Rua Junqueira 126, 1349-019 Lisbon, Portugal and
6
Instituto Superior de Ciências da Saúde
Egas Moniz, Quinta Granja, Campus Universitário, 2829-511 Caparica, Portugal
Email: Pedro Borrego - ; José Maria Marcelino - ; Cheila Rocha - ;
Manuela Doroana - ; Francisco Antunes - ; Fernando Maltez -
saude.pt; Perpétua Gomes - ; Carlos Novo - ; Helena Barroso - ;
Nuno Taveira* -
* Corresponding author
Abstract
Background: This study was designed to investigate, for the first time, the short-term molecular
evolution of the HIV-2 C2, V3 and C3 envelope regions and its association with the immune
response. Clonal sequences of the env C2V3C3 region were obtained from a cohort of eighteen
HIV-2 chronically infected patients followed prospectively during 2–4 years. Genetic diversity,
divergence, positive selection and glycosylation in the C2V3C3 region were analysed as a function
of the number of CD4+ T cells and the anti-C2V3C3 IgG and IgA antibody reactivity
Results: The mean intra-host nucleotide diversity was 2.1% (SD, 1.1%), increasing along the course
of infection in most patients. Diversity at the amino acid level was significantly lower for the V3
region and higher for the C2 region. The average divergence rate was 0.014 substitutions/site/year,
which is similar to that reported in chronic HIV-1 infection. The number and position of positively
selected sites was highly variable, except for codons 267 and 270 in C2 that were under strong and
persistent positive selection in most patients. N-glycosylation sites located in C2 and V3 were
conserved in all patients along the course of infection. Intra-host variation of C2V3C3-specific IgG
response over time was inversely associated with the variation in nucleotide and amino acid
diversity of the C2V3C3 region. Variation of the C2V3C3-specific IgA response was inversely
associated with variation in the number of N-glycosylation sites.
Conclusion: The evolutionary dynamics of HIV-2 envelope during chronic aviremic infection is
similar to HIV-1 implying that the virus should be actively replicating in cellular compartments.
Convergent evolution of N-glycosylation in C2 and V3, and the limited diversification of V3,
indicates that there are important functional constraints to the potential diversity of the HIV-2
Published: 8 September 2008
Retrovirology 2008, 5:78 doi:10.1186/1742-4690-5-78
Received: 29 May 2008
Accepted: 8 September 2008
This article is available from: />© 2008 Borrego et al; licensee BioMed Central Ltd.
This is an Open Access article distributed under the terms of the Creative Commons Attribution License ( />),
which permits unrestricted use, distribution, and reproduction in any medium, provided the original work is properly cited.
Retrovirology 2008, 5:78 />Page 2 of 12
(page number not for citation purposes)
envelope. C2V3C3-specific IgG antibodies are effective at reducing viral population size limiting the
number of virus escape mutants. The C3 region seems to be a target for IgA antibodies and
increasing N-linked glycosylation may prevent HIV-2 envelope recognition by these antibodies. Our
results provide new insights into the biology of HIV-2 and its relation with the human host and may
have important implications for vaccine design.
Background
The etiologic agents of AIDS, HIV-1 and HIV-2, are two
distinct human lentiviruses with similar structural and
genomic organization but sharing only 50% of genetic
similarity [1]. Compared to HIV-1, the infection by HIV-2
is associated with better prognosis, slower disease progres-
sion and transmission, longer latency period and reduced
mortality rate [2-6]. Moreover, most HIV-2 patients have
normal CD4
+
T cell counts and low or undetectable plas-
matic viral levels [7,8]. Two possible explanations for
these differences may be the slower replication capacity of
HIV-2 and a more efficient immune control of HIV-2 [9-
13].
The env gene codes for the viral envelope glycoproteins,
which are responsible for HIV entry into cells [14]. Rapid
evolutionary changes and high genetic variability are two
major characteristics of the HIV env gene [15]. In HIV-1
infection, conflicting associations have been reported
between disease status and within-patient env gene evolu-
tion. Hence, some studies have shown that genetic diver-
sity and divergence from the infecting strain increase
during HIV-1 infection but become stable or even
decrease in the advanced stage of disease, with the lower
CD4
+
T cell counts and progression to AIDS [16-18].
Other authors have shown that higher genetic diversity
and divergence are found in patients with rapid progres-
sion to disease than in slow- or non-progressors [19,20].
There is also a positive correlation between viral replica-
tion and intrahost HIV-1 evolution in elite controllers and
long-term nonprogressors [21].
The number of studies investigating within-patient HIV-2
molecular evolution and their association with clinical
and immunological evolution is limited. In one transver-
sal study, we have shown that the genetic diversity of the
HIV-2 env may be directly related to the period of infec-
tion [22]. Longitudinal studies performed in Senegal have
shown that higher variability in the env V3 region is gen-
erally found in patients with faster disease progression to
AIDS [23] and that in elite controllers (patients infected
for ≈ 10 years with normal CD4
+
T cell counts without
antiretroviral therapy and with low or undetectable viral
load) the rate of env gene diversification may be positively
associated with the rate of CD4
+
T cell number decrease
[24].
Higher rate of molecular evolution, with predominance of
nonsynonymous amino acid substitutions, tends to occur
in regions of the HIV-1 env gene submitted to strong selec-
tive pressure from the immune system [15,25-28]. A struc-
ture of particular importance in this process is the V3 loop
of the surface glycoprotein which is essential for HIV core-
ceptor usage [29-32] and for inducing the production of
neutralizing and nonneutralizing antibodies in HIV
infected individuals [33]. Neutralizing antibody
responses, both autologous [34-36] and heterologous
[36,37] may be more common in HIV-2 than in HIV-1
infection. Still, little is known about the role of humoral
immunity in the evolution of the HIV-2 env gene. In the
present study we analyze, for the first time, the molecular
evolution of the env C2V3C3 regions in chronically HIV-2
infected patients over a two to four year period in the con-
text of their antibody response (IgG and IgA) against the
same envelope region.
Methods
Patients
Eighteen HIV-2 patients attending different hospitals in
Lisbon, Portugal, were followed prospectively during 2–4
years (Table 1). Fourteen patients were taking reverse tran-
scriptase and/or protease inhibitors. During the follow-up
period three patients (PTHCC20, PTHSM9 and
PTHSM10) had detectable plasma viral load. Eight
patients had < 200 CD4
+
T cells/μl (AIDS defining condi-
tion).
Quantification of HIV-2 plasma viremia
HIV-2 viremia in the plasma was quantified with a quan-
titative-competitive RT-PCR assay as described elsewhere
[38].
DNA extraction, PCR amplification, cloning and
sequencing
PBMCs from all patients were co-cultivated with normal
PBMCs to try to isolate virus [39]. At the end of the culture
period, which is when the culture was positive (mean, 15
days), cells were harvested and DNA was extracted with
the Wizard® Genomic DNA Purification kit (Promega) for
subsequent analysis. A fragment of the C2V3C3 region
(378 bp) of the HIV-2 env gene was amplified in a nested
Polymerase Chain Reaction (PCR) as described previously
[22]. PCR fragments were cloned into pCR
®
4-TOPO
®
vec-
Retrovirology 2008, 5:78 />Page 3 of 12
(page number not for citation purposes)
tor (Invitrogen) and transformed into One Shot
®
Match1™-T1
R
competent cells (Invitrogen). Cloned plas-
mids were extracted [40], purified and sequenced using
BigDye Terminator Cycle sequencing kit (Applied Biosys-
tems), with M13 Forward and Reverse primers, and an
automated sequencer (ABI Prism 3100, Applied Biosys-
tems). For each patient an average of 13 clones (range 7–
21) was sequenced per sampling year.
Sequence analysis and phylogenetic studies
The nucleotide sequences were aligned using Clustal X
[41] and manual adjustments were made using Genedoc
[42]. Genetic distances between sequences were calcu-
lated using the maximum composite likelihood method
implemented in the MEGA version 4 [43]. Inter- and
intra-sample synonymous (dS) and nonsynonymous
(dN) distances were estimated using the modified Nei-
Gojobory method with the Jukes-Cantor correction, also
implemented in the MEGA software package.
Maximum likelihood analyses [44] were performed using
the best-fit model of molecular evolution estimated by
Modeltest under the Akaike information criterion [45].
The chosen model was TVM+G+I. Tree searches were con-
ducted in PAUP version 4.0 using the nearest-neighbor
interchange (NNI) and tree bisection and reconnection
(TBR) heuristic search strategies [46], and bootstrap resa-
mpling [47]. The nucleotide divergence rate was estimated
using an adaptation of the methodology previously
described by Salazar-Gonzalez et al. [48]. Firstly, maxi-
mum likelihood trees were constructed for each patient
using all clonal sequences from each time point and
rooted with the consensus sequences from other patients.
Then, assuming a molecular clock, the branch lengths
Table 1: Virological and immunological characterization of the patients
Patient Year of diagnosis Sample CD4
+
T cells/μl RNA copies/ml Antiretroviral
therapy
Antibody reactivity against C2V3C3
(OD/cut-off)
IgG IgA
PTHCC1 2001 2003 308 <200 + 14.4 1.41
2005 319 na 13.3 1.49
PTHCC2 2003 2003 358 <200 + 24.3 1.69
PTHCC4 2000 2003 240 <200 + 9.6 3.26
PTHCC5 1993 2003 480 <200 + 20.1 2.40
2004 na <200 22.4 2.14
PTHCC7 2002 2003 144 <200 + 22.9 1.93
2005 43 <200 22.1 2.42
PTHCC8 2000 2003 141 <200 + 19.4 3.98
2005 350 na 17.1 3.69
PTHCC12 1995 2003 66 <200 - 28.0 5.79
2004 84 na 25.5 2.67
PTHCC13 2004 2005 954 <200 - na na
PTHCC14 1998 2003 184 <200 + 23.6 3.82
PTHCC17 1998 2003 367 <200 + 22.5 2.74
2004 270 <200 18.5 2.66
PTHCC19 2003 2003 175 na + 26.5 1.82
2004 400 <200 22.3 2.22
2005 60 na 18.7 2.01
PTHCC20 1998 2003 78 na + 24.5 1.57
2004 73 5246 20.0 1.66
2005 85 <200 19.9 1.37
PTHSM2 2002 2003 275 <200 + 5.9 1.55
2004 65 <200 6.2 1.57
2005 122 <200 10.9 1.93
2006 172 <200 4.7 2.09
PTHSM3 1993 2005 1452 <200 - 7.7 3.47
PTHSM6 2001 2005 471 <200 + 13.9 5.24
PTHSM7 1996 2003 587 na - 11.4 2.39
PTHSM9 1996 2003 15 <200 + neg 0.82
2004 na 484 neg 0.79
PTHSM10 2001 2003 342 5804 + neg 3.56
2004 265 4792 neg 3.54
2005 212 na neg 3.79
na, not available; neg, no reactivity; +, yes; -, no.
Retrovirology 2008, 5:78 />Page 4 of 12
(page number not for citation purposes)
between the leafs and the root of the tree were calculated
by using Branchlength Calculator [49] and plotted against
time in years.
Natural selection of specific amino acids was examined
using Codeml, models M0 and M3, with the HYPHY pack-
age [50]. Potential N-glycosylation sites were identified
using N-Glycosite [51]. The entropy at each position in
protein alignment was measured with Shannon Entropy
[52].
Humoral antibody response against the env C2V3C3
regions
IgG and IgA antibody response against the env C2V3C3
region was quantified with the ELISA-HIV2 test developed
in our laboratory, as described elsewhere with some mod-
ifications [53]. Briefly, microtiter plates (96-well) were
coated with rgp36 and rpC2-C3 by overnight incubation
at 4°C and blocked with 1% gelatine in Tris-buffered
saline (TBS). HIV-2-positive plasma samples were added
to the antigen coated wells at a 1:100 dilution. Bound
antibodies were detected by using alkaline phosphatase
(AP)-conjugated goat anti-human IgG (diluted 1:2000 in
TBS) or horseradish peroxidase (HPR)-conjugated rabbit
anti-human IgA (diluted 1:2000 in phosphate-buffer
saline) (Sigma-Aldrich). The colour was developed using
p-nitrophenilphosphate (p-NPP Tablets, Sigma-Aldrich)
as chromogenic substrate to AP and o-phenylenediamine
dihydrochloride (OPD) to HPR. Optical density (OD)
was measured with an automated microplate reader LP
400 (Bio-Rad) at 405 and 492 nm against a reference
wavelength of 620 nm. The clinical cut-off value of the
assay, calculated as the mean OD value of HIV-seronega-
tive samples plus three times the standard deviation [SD],
was determined using samples from healthy HIV-seroneg-
ative subjects. The results of the assay are expressed quan-
titatively as OD
clinical sample(S)
/OD
cut-off(CO)
ratios. For ratio
values >1 the sample is considered as seroreactive.
Statistical analysis
Statistical analysis was performed in GraphPad Prism ver-
sion 4.00 for Windows (GraphPad Software), with a level
of significance of 5%. For the inter-patient statistical anal-
ysis across time, only information obtained from one
time point (one sample) per patient was considered in
order to guarantee the independence of the data analyzed.
Thus, to maximize the number of observations in the
analysis, we chose the first sample (first time point) avail-
able for each patient. Nonparametric tests were used to
compare means and medians between variables: paired
data was analyzed with Wilcoxon-matched pairs test and
Friedman test; unpaired variables were tested with Mann
Whitney U test and Kruskal-Wallis test. To study how two
variables varied together linear regression was performed
and Spearman correlation coefficients were computed.
Finally, Deming linear regression was used to study the
overall variation (slopes) of intra-patient data with time
(longitudinal analysis).
GenBank accession numbers
Sequences have been assigned the following GenBank
accession numbers: EU358115
–EU358499, EU358501,
EU358504
, EU358507, EU358509, EU358513,
EU358517
, EU358519–EU358521, EU358524,
EU358525
, EU358527–EU358531, EU358533,
EU358536
–EU358538, EU358541, EU358543,
EU358546
–EU358549, EU358551–EU358567,
EU360797
–EU360799.
Results
Phylogenetic relationships, genetic diversity and
divergence
To investigate the molecular evolution of the HIV-2 env
gene we have amplified, cloned and sequenced the env
gene fragment coding for the C2, V3 and C3 regions using
yearly samples collected from 18 patients followed pro-
spectively for 2–4 years. A total of 431 clonal sequences
were obtained from 18 patients (average of 13 sequences
per patient per sampling year). Phylogenetic analysis
showed that all sequences clustered together within HIV-
2 group A and that each patient sequences formed mono-
phyletic sub-clusters with high bootstrap supporting val-
ues (Figure 1). Phylogenetic analysis also showed that
with the exceptions of patients PTHCC1, PTHCC5 and
PTHCC20, sequences from most patients were not segre-
gated according to sampling years, a clear indication that
there were no major shifts in virus population structure
from one year to the other.
The mean evolutionary distance between different nucle-
otide sequences from each sample/year (nucleotide diver-
sity) was 2.1% (standard deviation = 1.1) (additional file
1). Nucleotide diversity was neither associated with clini-
cal status (2.1% mean median genetic distance in AIDS
patients vs 1.4% in the other patients; p = 0.203) nor with
plasma viremia (2.3% in viremic patients vs 1.8% in
aviremic patients; p = 0.386) (n = 18).
Considering the first and the last samples of each patient,
nucleotide diversity increased along the course of infec-
tion in all patients, except for patient PTHCC5 (additional
file 1). Shannon's entropy was used to measure the rela-
tive amino acid variability in our set of sequences [52].
The sum of entropy values of the amino acid alignments
varied between regions (p < 0.001), being significantly
lower for the V3 region (p < 0.001) and higher for the C2
region (p < 0.005) (additional file 1).
Within-patient nucleotide divergence rate was on average
0.014 substitutions per site per year for the C2V3C3
Retrovirology 2008, 5:78 />Page 5 of 12
(page number not for citation purposes)
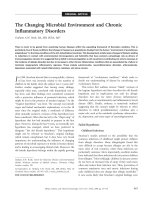
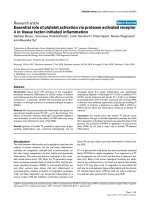
Maximum-likelihood phylogenetic analysisFigure 1
Maximum-likelihood phylogenetic analysis. The phylogenetic tree was constructed with reference sequences from HIV-
2 groups A, B and G, under the TVM+G+I evolutionary model, using the NNI heuristic search strategy and 1000 bootstrap
replications. The triangles represent the compressed subtrees containing clonal sequences obtained from all samples collected
for each patient. The length of the triangle represents the intra-patient nucleotide diversity and its thickness is proportional to
the number of sequences. The bootstrap values supporting the internal branches are shown. The scale bar represents evolu-
tionary distances in substitutions per site. The inset contains the subtrees of patient PTHCC1 (A), PTHCC20 (B) and PTHCC5
(C) (Yellow circle – 2003; green circle – 2004; blue circle – 2005).
A CB
A.GH.x.GH1
A.DE.x.BEN
A.CI.88.UC
A.GM.87.D1
A.GW.x.ALI
PTHCC12
PTHCC17
A.SN.x.ST
PTHCC13
A.GM.x.ISY
PTHCC2
A.GM.90.CB
PTHCC19
PTHCC1
PTHCC8
PTHSM6
PTHCC14
PTHSM2
PTHCC4
A.SN.85.RO
A.GM.x.CBL
PTHSM9
A.GW.87.CA
A.GW.86.FG
A.GW.x.MDS
PTHCC7
PTHCC20
A.DE.x.PEI
PTHSM3
PTHSM7
PTHCC5
PTHSM10
AB.CI.90.7
B.CI.x.EHO
B.GH.86.D2
B.CI.88.UC
G.CI.x.ABT
0.5
100
70
100
98
99
92
96
100
100
100
72
100
91
98
90
100
100
94
100
100
100
76
100
95
73
A
C
B
Retrovirology 2008, 5:78 />Page 6 of 12
(page number not for citation purposes)
region, but it varied widely between patients (SD =
0.011). There was no association between the divergence
rate and the variation in the number of CD4
+
T cells over
time (Deming regression analysis, F = 0.058, p = 0.816).
Likewise, the divergence rate of the C2V3C3 regions was
not related with the level of IgG antibodies produced
against the homologous peptide over time (F = 0.192, p =
0.675).
Selection analysis and adaptation rate of the C2, V3, and
C3 regions
Intra-patient analysis showed that the overall C2V3C3
region was under purifying selection (dN/dS ratio < 1)
along the course of infection in all patients (additional file
1). Analysis of the number and location of positively
selected codons is useful to identify particular amino acids
that may be under the selective pressure of the immune
system, regions that can define potential neutralizing
epitopes or that are functionally important for the protein
[15,25-28]. In the present study, higher number of sites
under positive selection tended to be found in patients
with detectable viremia compared to patients with unde-
tectable viremia (median, 15 sites vs 2; p = 0.061) (n = 18)
(additional file 1). Otherwise, the number of positively
selected sites was highly variable in number and position
in most patients (Figure 2). Notable exceptions were
amino acids at positions 267 and 270 in C2 (numbered
according to the reference HIV-2ALI strain) that were
under strong positive selection in all patients. Selection at
these two sites persisted for at least two years in 9 patients
(Figure 2). Because of these two sites, the median number
of positively selected codons per sample was higher in the
C2 region compared with the other regions (p < 0.005) (n
= 18). Finally, using linear regression analysis we found
that within each patient an average of 1.0 (SD = 3.8) pos-
itively selected site varied per year (adaptation rate).
Glycosylation of the HIV-2 env C2-C3 region
Since the glycosylation pattern of the HIV-1 env gene may
influence neutralization escape to the immune system,
viral tropism and clinical progression [32,36,54-57], we
determined the number of potential N-glycosylation sites
in our sequences and examined its variation as a function
of time and other parameters analyzed in this study. The
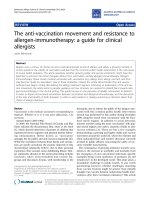
number of N-glycosylation sites ranged from 5 to 8
(median, 7) and tended to be conserved along the infec-
tion in each patient, the exception being patient PTHCC1
with an increase in two sites over the three years of follow
up (Figure 3). The number of glycosylation sites varied
significantly between C2, V3 and C3 (p < 0.001), being
concentrated particularly in C2 (p < 0.001) (n = 18). At the
intra- and inter-patient level, the most conserved N-glyco-
sylation sites were located in C2 and V3. With one excep-
tion, all sites that varied over time were located in C3. The
number of N-linked glycosylation sites was directly asso-
ciated with the number of positively selected sites (r
2
=
0.301; p = 0.018).
Molecular evolution of the C2, V3 and C3 regions as a
function of the antibody response
All patients produced IgA antibodies against the C2V3C3
region whereas IgG antibodies were detected in all but
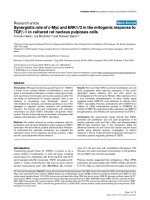
two patients, PTHSM9 and PTHSM10 (Table 1). Intra-
patient analysis revealed that along the course of the infec-
tion the variation of C2V3C3-specific IgG response was
inversely associated with the variation of nucleotide diver-
sity (F = 22.09; p = 0.002) as well as with the dN rate (F =
22.800; p = 0.002) and amino acid diversity (Shannon's
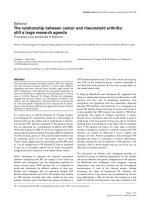
Frequency, intensity and distribution of positively selected sites in the C2, V3 and C3 regions along the course of HIV-2 infec-tionFigure 2
Frequency, intensity and distribution of positively selected sites in the C2, V3 and C3 regions along the course
of HIV-2 infection. Positively selected codons (obtained with Codeml, model M3) were classified in two categories according
to the ω ratio:ω>6, codons under strong selective pressure; 1<ω<6, codons under weak selective pressure. The frequency and
distribution of positively selected sites in the C2, V3 and C3 regions are shown in each infection year. Higher frequency posi-
tively selected sites are shown in bold letters. Sites were numbered according to the reference HIV-2ALI strain. (na, not avail-
able)
Retrovirology 2008, 5:78 />Page 7 of 12
(page number not for citation purposes)
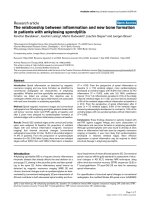
Frequency and distribution of potential N-glycosylation sites in the C2, V3 and C3 regions along the course of infectionFigure 3
Frequency and distribution of potential N-glycosylation sites in the C2, V3 and C3 regions along the course of
infection. The frequency and distribution of potential N-linked glycosylation sites in the C2, V3 and C3 regions are shown in
each infection year. Higher frequency glycosylation sites are shown in bold letters. Sites were numbered according to the ref-
erence HIV-2ALI strain. (na, not available)
V3
269 275 286 297 307 340 362 363 366 368
2003 5
2004 -
2005 7
2003 8
2004 8
2003 7
2004 -
2005 6
2003 6
2004 -
2005 6
2003 8
2004 8
2003 6
2004 6
2003 6
2004 7
2005 7
2003 6
2004 6
2005 6
2003 6
2004 7
2005 6
2006 7
2003 6
2004 6
2003 8
2004 8
2005 8
7
100 100 96 100 100 26 67 11 52 19
100 100 100 100 100 11 9 7 22 7
Frequency (%) per Sample
Frequency (%) per Patient
Patients
C2
na
na
na
PTHCC1
PTHCC5
PTHCC7
TotalSample
Potential N-Glycosylation sites
C3
PTHCC8
PTHCC12
PTHCC17
PTHCC19
Median
PTHCC20
PTHSM2
PTHSM9
PTHSM10
Retrovirology 2008, 5:78 />Page 8 of 12
(page number not for citation purposes)
entropy, F = 23.610; p = 0.002), particularly in the V3 (F =
11.660; p = 0.014) and C3 regions (F = 6.214; p = 0.041)
(n = 9) (Figure 4). Variation of the C2V3C3- specific IgA
response over time was inversely associated with variation
in the number of N-linked glycosylation sites (F = 22.090;
p = 0.042; n = 4) which occurred in four patients particu-
larly in the C3 region (Figure 4).
Discussion
In this study we have examined, for the first time, the
molecular evolution of the envelope C2, V3 and C3
regions during chronic HIV-2 infection and its correlation
with the antibody response against the same regions. Our
cohort was constituted by long-term infected patients
showing, in general, low CD4
+
T cell counts and undetec-
table plasma viremia.
Nucleotide diversity increased with time in all but one
patient with values similar to those obtained in an earlier
study performed with HIV-2 elite controllers (2.1%, this
study, vs 1.7%; p = 0.3440) [24]. This value is also similar
to the 2.5% median diversity reported for chronically
HIV-1 infected patients [58] and to the 3.0% mean diver-
sity reported for some long-term nonprogressors with low
viral load [21].
In phylogenetic analysis we found low quasispecies com-
plexity in most patients, i.e. virus populations from most
patients were mostly homogeneous during the follow up
period. This was expected since HIV-2 is generally seen as
a slowly evolving virus and over a short period of time one
would expect to observe few evolutionary changes
[22,24,59]. However, in three patients there was evidence
for segregation of virus quasispecies according to the year
of infection, which implies high rate of evolutionary
change and immune selection in these patients [15,60].
Consistent with this, we found that the nucleotide diver-
gence rate varied widely between patients. Moreover, the
average nucleotide divergence rate (0.014 substitutions
per site per year) was very high when compared to that
reported for HIV-2 elite controllers (mean, 0.23%) [24]
and for HIV-1 long-term non progressors with low plasma
viral load (mean, 0.27%) [21]. Even though we could not
detect any association between nucleotide divergence and
the number of CD4
+
T cells, the higher net divergence
observed in our patients might be related to their high
immune deterioration, as higher genetic divergence is
generally found in HIV-1 rapid progressors compared to
slow- or non-progressors [19,20]. In fact, the 0.014
annual divergence rate found in our patients is similar to
that found in chronically HIV-1 infected patients
(between 1.0% and 1.5% per year) [17,58]. In conclusion,
the sampling schedule used in our study, and possibly the
fact that we have analyzed the virus present inside the cells
and not in the plasma, has enabled us to demonstrate that
the evolutionary dynamics of HIV-2 during chronic infec-
tion is surprisingly similar to HIV-1. This implies that
HIV-2 is actively replicating during chronic infection, pos-
sibly in the lymphoid tissue, as in HIV-2 patients the
mononuclear cells in the lymph nodes are heavily
infected, even more than the mononuclear cells in the
peripheral blood [61,62]. Future studies of HIV-2 nucle-
otide divergence should include also the virus popula-
C2V3C3 sequence evolution along the course of infection as a function of antibody responseFigure 4
C2V3C3 sequence evolution along the course of infection as a function of antibody response. Deming regression
analysis. (A) Annual variation (slope) of the C2V3C3-IgG response vs Annual variation (slope) of the mean nucleotide diversity;
(B) Annual variation (slope) of the C2V3C3-IgA response vs Annual variation (slope) of the number of potential N-glycosyla-
tion sites.
0.1 0.2 0.3
-1
0
1
2
F = 22.090
p = 0.042
IgA response against C2V3C3 region
(variation per year)
No. of potential N-glycosylation
sites (variation per year)
A
B
-5 -4 -3 -2 -1 1 2 3
-0.020
-0.015
-0.010
-0.005
0.005
0.010
0.015
0.020
0.025
F = 22.09
p=0.002
IgG response against C2V3C3
region (variation per year)
Mean nucleotide diversity
(variation per year)
Retrovirology 2008, 5:78 />Page 9 of 12
(page number not for citation purposes)
tions present in the lymphoid tissue and other cellular
compartments (e.g. GI tract).
Despite the high nucleotide divergence rate, most of the
substitutions were of a synonymous nature such that the
dN/dS ratio of the C2V3C3 region was always below one
and, most importantly, it decreased over time in most
patients. These results are in agreement with previous
reports that have examined the C2V3C3 region [22,24]
and with the observation that, globally, the HIV-2 env
gene is under purifying selection [25]. Consistent with
previous studies of a cross-sectional nature, we found that
C2 and C3, but not V3, were the fastest evolving regions at
the nucleotide and amino acid level contributing signifi-
cantly to the high within-patient nucleotide divergence
rate [22,63]. The conservation of the V3 region in vivo
implies that in HIV-2, as in HIV-1, this region is submitted
to strong structural and conformational constraints which
are probably related to its crucial functional roles at the
level of coreceptor binding and cell entry [29-32].
It is probable that adaptation to immune pressure is the
main driver of the rapid intra-host evolution of the C2
and C3 regions in HIV-2 [15,25,58,60,64-66]. Indeed, we
found that most of the amino acids under selection are
located in C2, including the two amino acids that are
under strongest positive selection in all patients (posi-
tions 267 and 270). Moreover, selection at these two sites
persisted for at least two years in the majority of the
patients which is a clear indication that they are under
continued immune pressure in vivo [60,67]. The equiva-
lent amino acids in HIV-1 are not under positive selection
[67], are located in the hidden surface of envelope glyco-
protein complex [58] and define a cytotoxic T cell epitope
[68]. Thus, our results also suggest that the antigenic pres-
entation of the C2, and perhaps the C3 region (see
below), in the envelope complex of HIV-2 differs substan-
tially from that of HIV-1.
Glycans on HIV-1 envelope protein play an important
role in the folding of the glycoproteins, in infection and in
evasion from the host immune response (reviewed in
[69]). We found that, as for HIV-1 [51,58], the majority of
potential N-glycosylation sites were concentrated in the
C2 region. The four N-glycosylation sites in C2 and the
site in the beginning of V3 were highly conserved in all
patients throughout infection which is strongly indicative
of convergent evolution at these glycosylation hotspots
and suggests an unexpected constraint on the potential
diversity of the HIV-2 envelope [70,71]. The convergent
evolution of glycosylation sites may have important
implications for both vaccine design and antiviral thera-
peutic [69].
To try to identify the immune correlates of the molecular
evolution of HIV-2 C2, V3 and C3 regions we have looked
into all possible associations between the number of
CD4
+
T cells or the IgA and IgG antibody levels and differ-
ent parameters that reflect viral molecular evolution. In
longitudinal analysis there was no significant association
between the number of CD4
+
T cells and nucleotide diver-
sity, amino acid entropy, nucleotide divergence, dN/dS
ratio and number of positively selected sites. These results
are in partial contrast to those of MacNeil et al. [24], who
found a direct association between the rates of HIV-2
diversification and rates of CD4
+
T cell decline in long-
term non progressors followed for a decade in Senegal.
The short term follow-up and the associated modest vari-
ation in the number of CD4
+
T cells might have prevented
the detection of this type of association in our patients.
Strikingly, however, there was a close relationship
between virus diversification and evolution and C2V3C3-
specific antibody response over time. In fact, higher IgG
response was significantly associated with lower viral var-
iability at the nucleotide and amino acid levels as well as
with lower frequency of nonsynonymous substitutions.
These results imply that the anti-C2V3C3 IgG antibodies
are effective at reducing viral population size limiting the
number of virus escape mutants [72]. This is in striking
contrast to the majority of acute and chronic HIV-1 infec-
tions where the virus quickly escapes from anti-V3 and
anti-C3 autologous neutralizing antibodies [33,73-76].
Consistent with the lower capacity of HIV-2 to escape
from C2V3C3- neutralizing antibodies when compared to
HIV-1, we found that on average HIV-2 has a five-fold
lower adaptation rate in vivo than HIV-1 (1 positively
selected site per year vs 5 sites per year) [60,77]. The HIV-
2 low adaptation rate may be related to its low replicative
capacity and low plasma viral load [12,13,78]. Overall,
these results provide support for a crucial role of neutral-
izing antibody response in the effective containment of
viral replication in HIV-2 infection in vivo [36].
Surprisingly, in some patients addition of glycans to the
C3 region was associated with a reduction in the IgA
immunogenicity of the C2V3C3 region. Envelope-specific
plasma IgA antibodies, mostly binding to the gp36 trans-
membrane glycoprotein, have been found to neutralize
HIV-2 [79]. Increasing the number of N-glycans in the
envelope gp120 surface glycoprotein, or varying the posi-
tion of glycosylation sites, has been associated with escape
from IgG neutralizing antibody response in simian immu-
nodeficiency virus (SIV) and HIV-1 infection [57,80-82].
Hence, one plausible explanation for the inverse associa-
tion between IgA response and N-glycosylation is that the
C3 envelope region induces IgA neutralizing antibodies to
which HIV-2 escapes through the occlusion of the C3
region with N-linked glycans. This may have important
Retrovirology 2008, 5:78 />Page 10 of 12
(page number not for citation purposes)
implications for vaccine design. Ongoing studies will
determine whether C2V3C3- specific IgA antibodies
present in these patients effectively neutralize their autol-
ogous virus.
Conclusion
The evolutionary dynamics of HIV-2 envelope during
chronic and highly suppressed infection is surprisingly
similar to HIV-1 implying that the virus is actively repli-
cating in cellular compartments. Convergent evolution of
N-glycosylation in C2 and V3, as well as the limited diver-
sification of V3, indicates however that there are impor-
tant functional constraints to the potential diversity of the
HIV-2 envelope. HIV-2 envelope diversification is
inversely related to the C2V3C3-specific IgG antibody
response over time implying that these antibodies are
effective at reducing viral population size, limiting the
number of virus escape mutants. The C3 region seems to
be a target for IgA antibodies and increasing N-linked gly-
cosylation may prevent HIV-2 envelope recognition by
these antibodies. Our results provide new insights into the
biology of HIV-2 and its relation with the human host and
may have important implications for vaccine design.
Competing interests
The authors declare that they have no competing interests.
Authors' contributions
NT designed and coordinated the study. PB performed
most of the cloning and sequencing experiments. JMM
isolated the viruses and quantified the antibody
responses. HB and CR participated in virus isolation and
in the sequencing analysis of some patients. MD, FA and
FM recruited the patients and were responsible for collect-
ing the blood samples and the clinical data. PG quantified
the plasma viremia. CN and PG helped with the interpre-
tation of data and revision of the manuscript. PB and NT
preformed statistical analysis. PB and NT interpreted the
data and wrote the manuscript. All authors reviewed and
accepted the final manuscript.
Additional material
Acknowledgements
This work was supported by Fundação para a Ciência e Tecnologia (project
POCTI/ESP/48045). Pedro Borrego is supported by a PhD grant from
Fundação para a Ciência e Tecnologia.
References
1. Hu DJ, Dondero TJ, Rayfield MA, George JR, Schochetman G, Jaffe
HW, Luo CC, Kalish ML, Weniger BG, Pau CP, et al.: The emerging
genetic diversity of HIV. The importance of global surveil-
lance for diagnostics, research, and prevention. JAMA 1996,
275:210-216.
2. Andersson S, Norrgren H, da Silva Z, Biague A, Bamba S, Kwok S,
Christopherson C, Biberfeld G, Albert J: Plasma viral load in HIV-
1 and HIV-2 singly and dually infected individuals in Guinea-
Bissau, West Africa: significantly lower plasma virus set
point in HIV-2 infection than in HIV-1 infection. Arch Intern
Med 2000, 160:3286-3293.
3. Kanki PJ, Travers KU, S MB, Hsieh CC, Marlink RG, Gueye NA, Siby
T, Thior I, Hernandez-Avila M, Sankale JL, et al.: Slower heterosex-
ual spread of HIV-2 than HIV-1. Lancet 1994, 343:943-946.
4. Marlink R, Kanki P, Thior I, Travers K, Eisen G, Siby T, Traore I, Hsieh
CC, Dia MC, Gueye EH, et al.: Reduced rate of disease develop-
ment after HIV-2 infection as compared to HIV-1. Science
1994, 265:1587-1590.
5. Whittle H, Morris J, Todd J, Corrah T, Sabally S, Bangali J, Ngom PT,
Rolfe M, Wilkins A: HIV-2-infected patients survive longer than
HIV-1-infected patients. AIDS 1994, 8:1617-1620.
6. Reeves JD, Doms RW: Human immunodeficiency virus type 2.
J Gen Virol 2002, 83:1253-1265.
7. Berry N, Ariyoshi K, Jaffar S, Sabally S, Corrah T, Tedder R, Whittle
H: Low peripheral blood viral HIV-2 RNA in individuals with
high CD4 percentage differentiates HIV-2 from HIV-1 infec-
tion. J Hum Virol 1998, 1:457-468.
8. Soares R, Foxall R, Albuquerque A, Cortesao C, Garcia M, Victorino
RM, Sousa AE: Increased frequency of circulating CCR5+
CD4+ T cells in human immunodeficiency virus type 2 infec-
tion. J Virol 2006, 80:12425-12429.
9. Anderson DE, Llenado RA, Torres JV: Humoral immunity and the
evolution of HIV-2. Viral Immunol 2004, 17:436-439.
10. Berry N, Jaffar S, Schim van der Loeff M, Ariyoshi K, Harding E,
N'Gom PT, Dias F, Wilkins A, Ricard D, Aaby P, et al.: Low level
viremia and high CD4% predict normal survival in a cohort
of HIV type-2-infected villagers. AIDS Res Hum Retroviruses 2002,
18:1167-1173.
11. Lizeng Q, Nilsson C, Sourial S, Andersson S, Larsen O, Aaby P, Ehn-
lund M, Bjorling E: Potent neutralizing serum immunoglobulin
A (IgA) in human immunodeficiency virus type 2-exposed
IgG-seronegative individuals. J Virol 2004, 78:7016-7022.
12. MacNeil A, Sarr AD, Sankale JL, Meloni ST, Mboup S, Kanki P: Direct
evidence of lower viral replication rates in vivo in human
immunodeficiency virus type 2 (HIV-2) infection than in HIV-
1 infection. J Virol 2007, 81:5325-5330.
13. Blaak H, Ende ME van der, Boers PH, Schuitemaker H, Osterhaus AD:
In vitro replication capacity of HIV-2 variants from long-
term aviremic individuals. Virology 2006, 353:144-154.
14. Levy JA: HIV and the pathogenesis of AIDS 2nd edition. Washington,
D.C.: ASM Press; 1998.
15. Lemey P, Rambaut A, Pybus OG: HIV evolutionary dynamics
within and among hosts. AIDS Rev 2006, 8:125-140.
16. Delwart EL, Pan H, Sheppard HW, Wolpert D, Neumann AU, Korber
B, Mullins JI: Slower evolution of human immunodeficiency
virus type 1 quasispecies during progression to AIDS. J Virol
1997, 71:7498-7508.
17. Shankarappa R, Margolick JB, Gange SJ, Rodrigo AG, Upchurch D, Far-
zadegan H, Gupta P, Rinaldo CR, Learn GH, He X, et al.: Consistent
viral evolutionary changes associated with the progression of
human immunodeficiency virus type 1 infection. J Virol 1999,
73:10489-10502.
18. Williamson S, Perry SM, Bustamante CD, Orive ME, Stearns MN,
Kelly JK: A statistical characterization of consistent patterns
of human immunodeficiency virus evolution within infected
patients. Mol Biol Evol 2005, 22:456-468.
19. Castiglione F, Poccia F, D'Offizi G, Bernaschi M: Mutation, fitness,
viral diversity, and predictive markers of disease progression
Additional file 1
Table 2. Results from sequence and phylogenetic analysis.
a
dN/dS – ratio
of nonsynonymous and synonymous substitutions, obtained with Codeml
(model M0).
b
dN/dS – ratio of nonsynonymous and synonymous substi-
tutions between the first and the last time point, obtained with Codeml
(model M0), when applicable.
c
Sum of Shannon's entropy values at each
position in protein alignment.
d
Number of positively selected codons in the
nucleotide alignment, obtained with Codeml (model M3). SD – Standard
deviation.
Click here for file
[ />4690-5-78-S1.xls]
Retrovirology 2008, 5:78 />Page 11 of 12
(page number not for citation purposes)
in a computational model of HIV type 1 infection. AIDS Res
Hum Retroviruses 2004, 20:1314-1323.
20. Markham RB, Wang WC, Weisstein AE, Wang Z, Munoz A, Temple-
ton A, Margolick J, Vlahov D, Quinn T, Farzadegan H, Yu XF: Pat-
terns of HIV-1 evolution in individuals with differing rates of
CD4 T cell decline. Proc Natl Acad Sci USA 1998, 95:12568-12573.
21. Bello G, Casado C, Sandonis V, Alvaro-Cifuentes T, Dos Santos CA,
Garcia S, Rodriguez C, Del Romero J, Pilotto JH, Grinsztejn B, et al.:
Plasma viral load threshold for sustaining intrahost HIV type
1 evolution. AIDS Res Hum Retroviruses 2007, 23:1242-1250.
22. Barroso H, Taveira N: Evidence for negative selective pressure
in HIV-2 evolution in vivo. Infect Genet Evol 2005, 5:239-246.
23. Sankale JL, de la Tour RS, Renjifo B, Siby T, Mboup S, Marlink RG,
Essex ME, Kanki PJ: Intrapatient variability of the human
immunodeficiency virus type 2 envelope V3 loop. AIDS Res
Hum Retroviruses 1995, 11:617-623.
24. MacNeil A, Sankale JL, Meloni ST, Sarr AD, Mboup S, Kanki P: Long-
term intrapatient viral evolution during HIV-2 infection. J
Infect Dis 2007, 195:726-733.
25. Choisy M, Woelk CH, Guegan JF, Robertson DL: Comparative
study of adaptive molecular evolution in different human
immunodeficiency virus groups and subtypes. J Virol 2004,
78:1962-1970.
26. Mikhail M, Wang B, Lemey P, Beckthold B, Vandamme AM, Gill MJ,
Saksena NK: Role of viral evolutionary rate in HIV-1 disease
progression in a linked cohort. Retrovirology 2005, 2:41.
27. Yamaguchi Y, Gojobori T: Evolutionary mechanisms and popu-
lation dynamics of the third variable envelope region of HIV
within single hosts. Proc Natl Acad Sci USA 1997, 94:1264-1269.
28. Zhang H, Hoffmann F, He J, He X, Kankasa C, Ruprecht R, West JT,
Orti G, Wood C: Evolution of subtype C HIV-1 Env in a slowly
progressing Zambian infant. Retrovirology 2005, 2:67.
29. De Jong JJ, De Ronde A, Keulen W, Tersmette M, Goudsmit J:
Mini-
mal requirements for the human immunodeficiency virus
type 1 V3 domain to support the syncytium-inducing pheno-
type: analysis by single amino acid substitution. J Virol 1992,
66:6777-6780.
30. Delobel P, Nugeyre MT, Cazabat M, Pasquier C, Marchou B, Massip
P, Barre-Sinoussi F, Israel N, Izopet J: Population-based sequenc-
ing of the V3 region of env for predicting the coreceptor
usage of human immunodeficiency virus type 1 quasispecies.
J Clin Microbiol 2007, 45:1572-1580.
31. Huang CC, Tang M, Zhang MY, Majeed S, Montabana E, Stanfield RL,
Dimitrov DS, Korber B, Sodroski J, Wilson IA, et al.: Structure of a
V3-containing HIV-1 gp120 core. Science 2005, 310:1025-1028.
32. Isaka Y, Sato A, Miki S, Kawauchi S, Sakaida H, Hori T, Uchiyama T,
Adachi A, Hayami M, Fujiwara T, Yoshie O: Small amino acid
changes in the V3 loop of human immunodeficiency virus
type 2 determines the coreceptor usage for CXCR4 and
CCR5. Virology 1999, 264:237-243.
33. Zolla-Pazner S: Improving on nature: focusing the immune
response on the V3 loop. Hum Antibodies 2005, 14:69-72.
34. Bjorling E, Scarlatti G, von Gegerfelt A, Albert J, Biberfeld G, Chiodi
F, Norrby E, Fenyo EM: Autologous neutralizing antibodies pre-
vail in HIV-2 but not in HIV-1 infection. Virology 1993,
193:528-530.
35. Andersson S: HIV-2 and the immune response. AIDS Reviews
2001, 3:11-23.
36. Shi Y, Brandin E, Vincic E, Jansson M, Blaxhult A, Gyllensten K,
Moberg L, Brostrom C, Fenyo EM, Albert J: Evolution of human
immunodeficiency virus type 2 coreceptor usage, autologous
neutralization, envelope sequence and glycosylation. J Gen
Virol 2005, 86:3385-3396.
37. Rodriguez SK, Sarr AD, MacNeil A, Thakore-Meloni S, Gueye-Ndiaye
A, Traore I, Dia MC, Mboup S, Kanki PJ: Comparison of heterolo-
gous neutralizing antibody responses of human immunodefi-
ciency virus type 1 (HIV-1)- and HIV-2-infected Senegalese
patients: distinct patterns of breadth and magnitude distin-
guish HIV-1 and HIV-2 infections. J Virol 2007, 81:5331-5338.
38. Soriano V, Gomes P, Heneine W, Holguin A, Doruana M, Antunes R,
Mansinho K, Switzer WM, Araujo C, Shanmugam V, et al.: Human
immunodeficiency virus type 2 (HIV-2) in Portugal: clinical
spectrum, circulating subtypes, virus isolation, and plasma
viral load. J Med Virol 2000, 61:111-116.
39. Cavaco-Silva P, Taveira NC, Rosado L, Lourenco MH, Moniz-Pereira
J, Douglas NW, Daniels RS, Santos-Ferreira MO: Virological and
molecular demonstration of human immunodeficiency virus
type 2 vertical transmission. J Virol 1998, 72:3418-3422.
40. Sambrook J, Maniatis T, Fritsch EF: Molecular cloning: a laboratory man-
ual 2nd edition. Cold Spring Harbor, N.Y.: Cold Spring Harbor Labo-
ratory; 1989.
41. Thompson JD, Gibson TJ, Plewniak F, Jeanmougin F, Higgins DG: The
CLUSTAL_X windows interface: flexible strategies for mul-
tiple sequence alignment aided by quality analysis tools.
Nucleic Acids Res 1997, 25:4876-4882.
42. Nicholas KB, Nicholas Hugh B Jr: GeneDoc: a tool for editing and
annotating multiple sequence alignments. Distributed by
the author. 1997.
43. Tamura K, Dudley J, Nei M, Kumar S: MEGA4: Molecular Evolu-
tionary Genetics Analysis (MEGA) software version 4.0. Mol
Biol Evol 2007, 24:1596-1599.
44. Felsenstein J: Evolutionary trees from DNA sequences: a max-
imum likelihood approach. J Mol Evol 1981, 17:368-376.
45. Posada D, Crandall KA: MODELTEST: testing the model of
DNA substitution. Bioinformatics 1998, 14:817-818.
46. Swofford DL: PAUP*. Phylogenetic Analysis using Parsimony
(*and other Methods). Version 4. Sinauer-Associates, Sunder-
land, Massachusetts; 1998.
47. Felsenstein J: Confidence limits on phylogenies: An approach
using the bootstrap. Evolution 1985, 39:783-791.
48. Salazar-Gonzalez JF, Bailes E, Pham KT, Salazar MG, Guffey MB, Keele
BF, Derdeyn CA, Farmer P, Hunter E, Allen S, et al.: Deciphering
human immunodeficiency virus type 1 transmission and
early envelope diversification by single-genome amplifica-
tion and sequencing. J Virol 2008, 82:3952-3970.
49. Branchlength Calculator [ />sequence/BRANCHLENGTH/branchlength.html]
50. Pond SL, Frost SD, Muse SV: HyPhy: hypothesis testing using
phylogenies. Bioinformatics 2005, 21:676-679.
51. Zhang M, Gaschen B, Blay W, Foley B, Haigwood N, Kuiken C, Kor-
ber B: Tracking global patterns of N-linked glycosylation site
variation in highly variable viral glycoproteins: HIV, SIV, and
HCV envelopes and influenza hemagglutinin. Glycobiology
2004, 14:1229-1246.
52. Korber BT, Kunstman KJ, Patterson BK, Furtado M, McEvilly MM,
Levy R, Wolinsky SM: Genetic differences between blood- and
brain-derived viral sequences from human immunodefi-
ciency virus type 1-infected patients: evidence of conserved
elements in the V3 region of the envelope protein of brain-
derived sequences. J Virol 1994, 68:7467-7481.
53. Marcelino JM, Barroso H, Goncalves F, Silva SM, Novo C, Gomes P,
Camacho R, Taveira N: Use of a new dual-antigen enzyme-
linked immunosorbent assay to detect and characterize the
human antibody response to the human immunodeficiency
virus type 2 envelope gp125 and gp36 glycoproteins. J Clin
Microbiol 2006, 44:607-611.
54. Botarelli P, Houlden BA, Haigwood NL, Servis C, Montagna D, Abrig-
nani S: N-glycosylation of HIV-gp120 may constrain recogni-
tion by T lymphocytes. J Immunol 1991, 147:3128-3132.
55. Clevestig P, Pramanik L, Leitner T, Ehrnst A: CCR5 use by human
immunodeficiency virus type 1 is associated closely with the
gp120 V3 loop N-linked glycosylation site. J Gen Virol 2006,
87:607-612.
56. Pollakis G, Kang S, Kliphuis A, Chalaby MI, Goudsmit J, Paxton WA:
N-linked glycosylation of the HIV type-1 gp120 envelope
glycoprotein as a major determinant of CCR5 and CXCR4
coreceptor utilization. J Biol Chem 2001, 276:13433-13441.
57. Polzer S, Dittmar MT, Schmitz H, Schreiber M: The N-linked gly-
can g15 within the V3 loop of the HIV-1 external glycopro-
tein gp120 affects coreceptor usage, cellular tropism, and
neutralization. Virology 2002, 304:70-80.
58. Joos B, Fischer M, Schweizer A, Kuster H, Boni J, Wong JK, Weber R,
Trkola A, Gunthard HF: Positive in vivo selection of the HIV-1
envelope protein gp120 occurs at surface-exposed regions. J
Infect Dis
2007, 196:313-320.
59. Barroso H, Araujo F, Gomes MH, Mota-Miranda A, Taveira N: Phyl-
ogenetic demonstration of two cases of perinatal human
immunodeficiency virus type 2 infection diagnosed in adult-
hood. AIDS Res Hum Retroviruses 2004, 20:1373-1376.
60. Rambaut A, Posada D, Crandall KA, Holmes EC: The causes and
consequences of HIV evolution. Nat Rev Genet 2004, 5:52-61.
Publish with BioMed Central and every
scientist can read your work free of charge
"BioMed Central will be the most significant development for
disseminating the results of biomedical research in our lifetime."
Sir Paul Nurse, Cancer Research UK
Your research papers will be:
available free of charge to the entire biomedical community
peer reviewed and published immediately upon acceptance
cited in PubMed and archived on PubMed Central
yours — you keep the copyright
Submit your manuscript here:
/>BioMedcentral
Retrovirology 2008, 5:78 />Page 12 of 12
(page number not for citation purposes)
61. Gomes P, Taveira NC, Pereira JM, Antunes F, Ferreira MO, Lourenco
MH: Quantitation of human immunodeficiency virus type 2
DNA in peripheral blood mononuclear cells by using a quan-
titative-competitive PCR assay. J Clin Microbiol 1999,
37:453-456.
62. Jobe O, Ariyoshi K, Marchant A, Sabally S, Corrah T, Berry N, Jaffar
S, Whittle H: Proviral load and immune function in blood and
lymph node during HIV-1 and HIV-2 infection. Clin Exp Immu-
nol 1999, 116:474-478.
63. Parreira R, Esteves A, Santos C, Piedade J, Venenno T, Canas-Ferreira
WF: Genetic variability of human immunodeficiency virus
type 2 C2V3 region within and between individuals from Bis-
sau, Guinea-Bissau, West Africa. AIDS Res Hum Retroviruses
2000, 16:1307-1312.
64. Yamaguchi-Kabata Y, Gojobori T: Reevaluation of amino acid
variability of the human immunodeficiency virus type 1
gp120 envelope glycoprotein and prediction of new discon-
tinuous epitopes. J Virol 2000, 74:4335-4350.
65. Yang W, Bielawski JP, Yang Z: Widespread adaptive evolution in
the human immunodeficiency virus type 1 genome. J Mol Evol
2003, 57:212-221.
66. Lemey P, Kosakovsky Pond SL, Drummond AJ, Pybus OG, Shapiro B,
Barroso H, Taveira N, Rambaut A: Synonymous substitution
rates predict HIV disease progression as a result of underly-
ing replication dynamics. PLoS Comput Biol 2007, 3:e29.
67. Ross HA, Rodrigo AG: Immune-mediated positive selection
drives human immunodeficiency virus type 1 molecular var-
iation and predicts disease duration. J Virol 2002,
76:11715-11720.
68. Korber BT M, Brander C, Haynes BF, Koup R, Moore JP, Walker BD,
Watkins DI: HIV Molecular Immunology 2006/2007. Los Ala-
mos National Laboratory, Theoretical Biology and Biophysics, Los
Alamos, New Mexico. LA-UR 07-4752
69. Scanlan CN, Offer J, Zitzmann N, Dwek RA: Exploiting the defen-
sive sugars of HIV-1 for drug and vaccine design. Nature 2007,
446:1038-1045.
70. Fischer PB, Karlsson GB, Butters TD, Dwek RA, Platt FM: N-
butyldeoxynojirimycin-mediated inhibition of human immu-
nodeficiency virus entry correlates with changes in antibody
recognition of the V1/V2 region of gp120. J Virol 1996,
70:
7143-7152.
71. Poon AF, Lewis FI, Pond SL, Frost SD: Evolutionary interactions
between N-linked glycosylation sites in the HIV-1 envelope.
PLoS Comput Biol 2007, 3:e11.
72. Grenfell BT, Pybus OG, Gog JR, Wood JL, Daly JM, Mumford JA, Hol-
mes EC: Unifying the epidemiological and evolutionary
dynamics of pathogens. Science 2004, 303:327-332.
73. Zolla-Pazner S: Identifying epitopes of HIV-1 that induce pro-
tective antibodies. Nat Rev Immunol 2004, 4:199-210.
74. Richman DD, Wrin T, Little SJ, Petropoulos CJ: Rapid evolution of
the neutralizing antibody response to HIV type 1 infection.
Proc Natl Acad Sci USA 2003, 100:4144-4149.
75. Frost SD, Wrin T, Smith DM, Kosakovsky Pond SL, Liu Y, Paxinos E,
Chappey C, Galovich J, Beauchaine J, Petropoulos CJ, et al.: Neutral-
izing antibody responses drive the evolution of human
immunodeficiency virus type 1 envelope during recent HIV
infection. Proc Natl Acad Sci USA 2005, 102:18514-18519.
76. Moore PL, Gray ES, Choge IA, Ranchobe N, Mlisana K, Abdool Karim
SS, Williamson C, Morris L: The c3-v4 region is a major target
of autologous neutralizing antibodies in human immunodefi-
ciency virus type 1 subtype C infection. J Virol 2008,
82:1860-1869.
77. Williamson S: Adaptation in the env gene of HIV-1 and evolu-
tionary theories of disease progression. Mol Biol Evol 2003,
20:1318-1325.
78. Marchant D, Neil SJ, McKnight A: Human immunodeficiency
virus types 1 and 2 have different replication kinetics in
human primary macrophage culture. J Gen Virol 2006,
87:411-418.
79. Lizeng Q, Skott P, Sourial S, Nilsson C, Andersson SS, Ehnlund M,
Taveira N, Bjorling E: Serum immunoglobulin A (IgA)-medi-
ated immunity in human immunodeficiency virus type 2
(HIV-2) infection. Virology 2003, 308:225-232.
80. Chackerian B, Rudensey LM, Overbaugh J: Specific N-linked and
O-linked glycosylation modifications in the envelope V1
domain of simian immunodeficiency virus variants that
evolve in the host alter recognition by neutralizing antibod-
ies. J Virol 1997,
71:7719-7727.
81. Wei X, Decker JM, Wang S, Hui H, Kappes JC, Wu X, Salazar-
Gonzalez JF, Salazar MG, Kilby JM, Saag MS, et al.: Antibody neutral-
ization and escape by HIV-1. Nature 2003, 422:307-312.
82. Sagar M, Wu X, Lee S, Overbaugh J: Human immunodeficiency
virus type 1 V1-V2 envelope loop sequences expand and add
glycosylation sites over the course of infection, and these
modifications affect antibody neutralization sensitivity. J Virol
2006, 80:9586-9598.