USMLE ROAD MAP BIOCHEMISTRY – PART 4 ppsx
Bạn đang xem bản rút gọn của tài liệu. Xem và tải ngay bản đầy đủ của tài liệu tại đây (472.37 KB, 24 trang )
b. The pentose phosphate pathway is stimulated to produce NADPH,
which may be needed later for fatty acid synthesis.
2. There is net synthesis of triacylglycerols for storage.
a. Free fatty acids delivered by the bloodstream and derived from dietary fats
are attached to a glycerol backbone for storage as triacylglycerol in the
large fat droplet of each adipocyte.
b. Breakdown of the stored triacylglycerols is inhibited at this time.
D. Skeletal muscle utilizes and stores glucose in the fed state.
1. As it does in adipose tissue, insulin promotes increased glucose uptake by
skeletal muscle.
60 USMLE Road Map: Biochemistry
N
BRAIN
Glycolysis
Protein Synthesis
Fats
Blood
Amino acids
ADIPOSE
TAG/FA synthesis
TAG/FA degradation
LIVER
Glycogenesis
FA synthesis
Gluconeogenesis
Glycogenolysis
MUSCLE
Glycogenesis
Glycogenolysis
Protein degradation
VLDL
Glucose
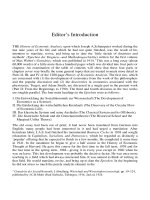
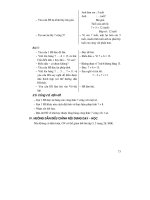
Figure 5–4. Metabolic activities of major organs in the fed state. The relative activ-
ities of major metabolic pathways or processes in each of the organs are indicated
by their font sizes. The exchange of nutrient materials and fuel molecules through
the bloodstream illustrates the interrelationships of these organs. In the absorptive
condition, all organs share the bounty of nutrients made available by digestion of
food by the intestine. PPP, pentose phosphate pathway; FA, fatty acids; TAG, triacyl-
glycerol.
a. The glucose is converted to glucose 6-phosphate by hexokinase and some is
metabolized through glycolysis and oxidative phosphorylation for en-
ergy.
b. The glycogen stores of muscle are not extensive and can be depleted
within a few minutes of intensive exercise, but the high level of glucose 6-
phosphate availability after a meal allows glycogen synthesis to replenish
the stores.
2. Insulin action and the availability of adequate energy and amino acids stimu-
late net synthesis of muscle protein, with suppression of protein degradation.
E. The fuel needs of the brain are both large and of very high priority.
1. Glucose is the sole fuel for the brain, and this need is easily met in the absorp-
tive state.
2. There are no stores of glycogen or triacylglycerols in the brain.
OBESITY—DYSREGULATION OF FAT METABOLISM
• Nearly two-thirds of Americans are classified as overweight according to the criteria of body mass
index (BMI) calculations, and obesity is now considered to be a disease.
– In simple terms, weight gain occurs when calorie intake exceeds calorie usage, and the excess fuel
is stored as fat.
– A sedentary lifestyle and the availability of abundant amounts of energy-dense foods are impor-
tant contributing factors to epidemic obesity in the United States and in many areas of the developed
world.
• Major sequelae of obesity include increased risk of type 2 diabetes, hypertension, heart disease
(collectively, the metabolic syndrome or syndrome X), certain cancers, fatty liver and gallstones, arthri-
tis and gout, with attendant reduction in life expectancy.
• Abdominal or visceral fat cells have a higher rate of fat turnover and are more contributory to dis-
ease than fat stores in the buttocks and thighs.
– Fatty acids released from visceral fat move through the hepatic portal circulation directly to the liver,
leading to altered hepatic fat metabolism.
– Dyslipidemia, characterized by low blood levels of HDL and elevated LDL, leads to atherosclerosis
and heart disease.
– Obesity in children has even more devastating long-term consequences because their adipocytes re-
spond to the excess storage demands by dividing to produce more visceral adipocytes, which in-
creases the lifetime storage capacity.
• Adipose is an endocrine gland that secretes a variety of factors that have effects both in the brain
and the peripheral insulin-responsive tissues.
– Adipocytes secrete leptin, adiponectin, and resistin, whose mechanisms of action to mediate periph-
eral insulin resistance are not yet fully understood.
– Investigations to understand the metabolic changes caused by obesity are in progress, but it is clear
that many of the consequences are due to altered signals arising from the increased mass of adipose
tissue.
• The main treatment for obesity involves lifestyle alteration (ie, decreased caloric intake coupled with
increased exercise); however, in severely obese patients, gastric bypass surgery is a viable alternative.
V. Metabolism in the Fasting State
A. During the post-absorptive or fasting state (4–24 hours after the last meal),
blood glucose levels begin to fall, precipitating major changes in metabolism
with a switchover from an anabolic state to a catabolic condition in order to main-
tain blood glucose levels (Figure 5–5).
Chapter 5: Metabolic Interrelationships and Regulation 61
N
CLINICAL
CORRELATION
1. Insulin levels in the blood decline.
2. Glucagon levels increase.
3. The decreased insulin/glucagon ratio activates degradation of glycogen, pro-
tein, and triacylglycerols.
4. Most biosynthetic pathways slow down.
5. Gluconeogenesis is stimulated.
B. In its critical role as the central organ for synthesis and distribution of fuel mole-
cules, the liver is mainly focused on export of glucose to peripheral tissues dur-
ing a short-term fast.
1. The decreased insulin/glucagon ratio leads to inhibition of glycogen synthe-
sis and increased glycogenolysis to supply some of the body’s glucose needs
on an immediate basis.
62 USMLE Road Map: Biochemistry
N
BRAIN
Glycolysis
Protein Synthesis
Glycerol
Glucose
Amino acids
Blood
ADIPOSE
TAG/FA degradation
TAG/FA synthesis
FA
LIVER
Gluconeogenesis
Glycogenolysis
Glycogenesis
FA synthesis
MUSCLE
Glycogenolysis
Protein degradation
Glycogenesis
Protein synthesis
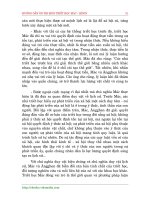
Figure 5–5. Metabolic activities of major organs during a short-term fast. The
importance of the liver in providing glucose to support the brain and other glucose-
requiring organs in the post-absorptive state is illustrated. The body relies on avail-
able glycogen stores as a ready source for glucose as fuel. PPP, pentose phosphate
pathway; FA, fatty acids; TAG, triacylglycerol.
2. Glycolysis decreases and gluconeogenesis increases.
3. The combination of these effects leads to increased intracellular glucose con-
centration, much of which is exported from the liver via reversal of transport
mediated by GLUT2.
4. During the fasting state, the energy needs of the liver are provided by fatty acid
catabolism (β-oxidation), which spares further glucose for export to peripheral
tissues.
C. In adipose tissue, reduced glucose availability via the blood and the low in-
sulin/glucagon ratio lead to net degradation of triacylglycerols to their compo-
nent fatty acids and glycerol to meet the energy needs of most tissues (with the
notable exception of the CNS).
1. The fatty acids are oxidized to provide for the energy needs of the adipocytes
themselves.
2. As the fast progresses, more of the adipose-derived fatty acids are transported in
the bloodstream as complexes with albumin and taken up by the liver.
3. The glycerol backbones from triacylglycerol breakdown are sent to the liver for
use in gluconeogenesis.
D. Skeletal muscle in its resting state can satisfy most of its energy needs by oxida-
tion of fatty acids taken up from blood, and during the early stages of fasting,
protein degradation in the muscle is increased.
1. Up to one-third of muscle protein may be degraded to component amino acids
for use as fuel during fasting.
2. Most of these amino acids are released into the bloodstream and taken up by
the liver and used as a major source of fuels.
a. Some of the carbons skeletons derived by removal of the amino groups
from the amino acids can be used for synthesis of glucose via gluconeo-
genesis.
b. Some carbon skeletons yield acetyl CoA and are used for synthesis of the al-
ternative fuel, ketone bodies, which become more important as the fast ex-
tends past 24 hours.
3. Glycogen stores in skeletal muscle are mainly held in reserve to satisfy the
organ’s need for a burst of energy during exercise, and thus are rapidly depleted
upon activity during a fast.
E. The energy needs of the brain and other glucose-requiring organs are satisfied
during the post-absorptive period through provision of glucose by the liver.
VI. Metabolism During Starvation
A. If fasting extends past 1–2 days, which is considered to be a long-term fast or
starvation, further changes in fuel synthesis and use by several organs can occur,
principally a conversion from a glucose economy to one dominated by ketone
bodies as fuel (Figure 5–6).
1. In addition to the effects of a low insulin/glucagon ratio, long-term changes in
metabolism during starvation are induced by the corticosteroid, cortisol.
2. Cortisol promotes net protein breakdown in skeletal muscle to provide amino
acids as precursors for gluconeogenesis and ketone body synthesis (keto-
genesis).
3. Cortisol also increases the rate of triglyceride breakdown (lipolysis) in adipose
tissue for these same purposes.
Chapter 5: Metabolic Interrelationships and Regulation 63
N
B. The liver is again the major organ that synthesizes the principal long-term fuel,
ketone bodies, acetoacetate, and 3-hydroxybutyrate, which are made from both
amino acids and fatty acids.
C. In prolonged fasting, triacylglycerol degradation in adipose tissue becomes
maximal and sustained.
D. Protein breakdown in skeletal muscle can only be sustained for 10–14 days, at
which point further degradation of protein would severely compromise contractile
capability.
E. Within a few days of fasting, the brain adapts to be able to utilize ketone bod-
ies as fuel and becomes less dependent on, but never completely independent of,
glucose.
64 USMLE Road Map: Biochemistry
N
BRAIN
Glycolysis
Protein Synthesis
Glycerol Amino acids Ketone bodies
ADIPOSE
TAG/FA degradation
TAG/FA synthesis
FA
LIVER
Gluconeogenesis
Ketogenesis
FA oxidation
Glycogenolysis
Glycogenesis
Blood
MUSCLE
Protein degradation
Glycogenolysis
Glycogenesis
Glucose
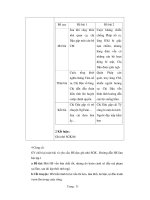
Figure 5–6. Metabolic activities of major organs during long-term fasting. With glycogen stores in
the liver and muscle depleted, gluconeogenesis is the sole means of providing for the glucose needs
of some organs, while many organs, even the brain, adapt to use of the alternative fuel, ketone bod-
ies, which is derived mainly from degradation of fatty acids. FA, fatty acids; PPP, pentose phosphate
pathway; TAG, triacylglycerol.
TYPE 1 DIABETES MELLITUS
• Patients with type 1 diabetes (previously called juvenile or insulin-dependent diabetes) have an ab-
solute deficiency of insulin, which produces chronic hyperglycemia (elevated blood glucose) with
elevated risk for ketoacidosis and a variety of long-term complications, including retinopathy, neu-
ropathy, nephropathy, and cardiovascular complications.
– Even in persons with well-controlled diabetes, the long-term complications include stroke, heart at-
tack, renal disease, blindness, and limb amputation.
– Onset of type 1 diabetes mellitus usually occurs within the first two decades of life; presenting symp-
toms include hyperglycemia, polyuria, polydipsia, and polyphagia (excessive urination, thirst, and ap-
petite, respectively), often with serious ketoacidosis in response to a stressor such as a viral infection.
– The diagnosis may be supported by an abnormal glucose tolerance test.
• The etiology of type 1 diabetes is autoimmune destruction of the pancreatic beta cells, which is ini-
tiated by an event such as viral infection and progresses to the point of frank symptoms during child-
hood and the teenage years.
– Evidence suggests a genetic predisposition toward the autoimmune response, but the genes involved
are unknown.
– At this time, it is not possible to diagnose the disease prior to appearance of symptoms, nor is there a
way to stop its progression.
• The metabolic disruption in type 1 diabetes is due to both the absence of insulin action and unop-
posed glucagon action in liver, muscle, and adipose tissues.
– Failure of insulin to suppress gluconeogenesis in liver leads to overproduction of new glucose, which
exacerbates the elevation of blood glucose due to decreased uptake of dietary glucose by muscle and
adipose.
– In the absence of insulin and in response to glucagon stimulation, triacylglycerol degradation in adi-
pose tissue runs unabated and the flood of fatty acids reaching the liver leads to ketone body synthe-
sis and packaging of some triacylglycerols into VLDLs.
– In some ways, the metabolic profile of a patient with uncontrolled type 1 diabetes resembles that of
the starved patient, except that in the complete absence of insulin, the ketoacidosis of diabetes is
much more severe than in fasting, and starvation is rarely associated with hyperglycemia.
• Peripheral tissues (such as liver, skeletal muscle, and adipose) retain normal responsiveness to insulin,
and management of the disease involves subcutaneous insulin injection with monitoring of blood
glucose several times per day.
– Standard treatment involves one or two daily injections of a prescribed dose of insulin, which is less
likely to produce hyperinsulinemia leading to episodes of hypoglycemia.
– At best, standard treatment brings blood glucose levels down to about 140–150 mg/dL (normal =
110 mg/dL).
– However, elevated glucose over many years inevitably produces the debilitating complications of the
disease through protein glycation events (ie, addition of glucose to proteins, especially those lining
blood vessels, leading to protein dysfunction).
– Intensive treatment involves a more aggressive attempt to manage blood glucose levels by monitor-
ing blood glucose multiple times during the day and administration of six to eight small doses of in-
sulin as needed.
– Another method for aggressive control of blood glucose levels is the use of insulin pumps to cover
basal insulin needs plus supplemental dosing at meals with fast-acting insulin.
– The benefit of this approach is decreased blood glucose to reduce the risk of long-term complica-
tions, but the main drawback of intensive treatment is possible overdosing producing hypoglycemia,
which may cause disorientation, loss of consciousness, coma, and death.
– Hypoglycemic agents, which are an important part of the therapeutic repertoire for type 2 diabetes,
do not work in cases of type 1 diabetes.
• There are approximately 1 million cases of diagnosed type 1 diabetes mellitus in the United States.
Chapter 5: Metabolic Interrelationships and Regulation 65
N
CLINICAL
CORRELATION
TYPE 2 DIABETES MELLITUS
• Type 2 diabetes is by far the more prevalent form of diabetes in the United States, with ~10 million di-
agnosed cases, and new cases are being diagnosed at an increasing rate of > 600,000 per year.
• The disease is characterized by peripheral insulin resistance leading initially to increased secretion of
insulin by the pancreatic beta cells.
– Chronic overwork eventually leads to beta cell dysfunction, and insulin secretion becomes inade-
quate to maintain blood glucose with development of symptoms.
– Although the exact molecular basis for the insulin resistance is not known, there are strong associa-
tions with obesity and a sedentary lifestyle.
– There is a very strong genetic component to type 2 diabetes, with evidence favoring a polygenic
disease mechanism but with few of these genes definitively identified.
• The symptoms of type 2 diabetes include hyperglycemia without the ketosis associated with type 1
disease due to residual effects of insulin on ketone body synthesis.
– Hypertriacylglycerolemia with secretion of increased VLDL can lead to long-term elevated risk of
atherosclerosis, although this is a complicated, multifactorial process.
– Other long-term complications are similar to those caused by type 1 diabetes, likely due to the
chronic hyperglycemia.
• Treatment of type 2 diabetes, at least in its early stages, mainly involves lifestyle modification.
– Recommendations include a calorie-restricted diet and increased exercise, with the goal of
weight reduction.
– Significant weight reduction can actually resolve the insulin resistance in some patients.
– Insulin injections are not normally needed to manage blood glucose levels in persons with type 2 dia-
betes, except in those with advanced-stage disease when pancreatic insulin production is extremely
low and patients benefit from supplemental insulin.
• When lifestyle changes alone are insufficient to manage blood glucose levels, a variety of hypo-
glycemic agents can be used.
– Sulfonylureas, such as glipizide and glyburide, and meglitinides, such as repaglinide and nateglin-
ide, stimulate insulin secretion by the beta cells.
– Biguanides, such as metformin, suppress liver gluconeogenesis and enhance insulin action in muscle.
– Thiazolidinediones, such as pioglitazone and rosiglitazone, reduce blood glucose levels by enhanc-
ing glucose utilization in response to insulin in adipose and muscle and decreasing gluconeogenesis
in the liver.
– ␣-Glucosidase inhibitors, such as acarbose and miglitol, block hydrolysis of dietary starches and
thereby reduce dietary glucose absorption.
CLINICAL PROBLEMS
A 15-year-old boy awakens at 7:30
AM
and as he sits down at the breakfast table, he ex-
claims that he “is really starving.” The boy finished dinner at 7:15
PM
the previous evening
and had not remembered to have a snack before going to bed.
1. If a biopsy were taken of this boy’s liver, which of the following processes would be on-
going at an elevated rate compared with the fed state?
A. Protein synthesis
B. Glycogenolysis
66 USMLE Road Map: Biochemistry
N
CLINICAL
CORRELATION
C. Glycolysis
D. Fatty acid synthesis
E. Pentose phosphate pathway
2. The insulin resistance that is the hallmark of type 2 diabetes mellitus is thought to arise
from multiple factors. Of the putative contributing factors listed below, which is likely
to be the most direct contributor to the disease?
A. Endocrine signals from the visceral adipose
B. Death of pancreatic beta cells
C. Increased mass of adipose in thighs and buttocks
D. Dysfunction of lipid metabolism in liver
E. Sedentary lifestyle
A student finished eating a well-balanced, 750-kilocalorie meal just 1 hour ago and has
since been sitting quietly watching television.
3. Which of the following substances would NOT be elevated in this student’s blood?
A. Fatty acids
B. Insulin
C. Amino acids
D. Glucagon
E. Glucose
A 22-year-old woman engaging in a political protest goes on a hunger strike on a promi-
nent corner in a city park. Although food is offered to her several times each day by so-
cial workers and the police, she refuses all offers except for water through the first 2
weeks.
4. An examination of a sample of this woman’s brain tissue would reveal that her brain
had adapted to using which of the following as fuel?
A. Glycerol
B. Amino acids
C. Glucose
D. Ketone bodies
E. Free fatty acids
A 14-year-old girl is brought to the clinic by her father with a complaint of light-
headedness experienced on the soccer field earlier in the afternoon. She stated that she
felt cold and nearly fainted several times, and that the symptoms did not resolve even
after she drank a power beverage. On further questioning, her father stated that she
had been very thirsty recently, which bothered him because it meant having to make
frequent bathroom stops while driving on trips. She also “eats like a horse” and never
seems to gain any weight or grow taller. Physical examination reveals a thin girl who is
at the 30th percentile for height and weight. A rapid dipstick test reveals glucose in her
urine.
Chapter 5: Metabolic Interrelationships and Regulation 67
N
5. Evaluation of this girl’s liver would reveal an increased rate of which of the following
processes?
A. Glycolysis
B. Glycogenesis
C. Ketogenesis
D. Fatty acid synthesis
E. Protein synthesis
ANSWERS
1. The answer is B. After an overnight fast (~12 hours), the liver would be active in secret-
ing glucose derived mainly from breakdown of stored glycogen, but also via gluconeo-
genesis from amino acid carbon-skeleton precursors. All the other processes listed
would be decreased relative to the fed state, in order to focus energy on meeting the
glucose needs of dependent organs such as the brain. This is especially true of the ana-
bolic processes like the pentose phosphate pathway and pathways for synthesis of fatty
acids and proteins. Actually, the liver would be meeting its own energy needs mainly
through fatty acid oxidation at this time, which would reduce flux through glycolysis.
2. The answer is A. Recent research has revealed that excess visceral fat deposits secrete
several factors that have direct effects on the brain as well as directly on muscle to pro-
duce peripheral insulin resistance. Some of these newly identified factors are leptin, re-
sistin, and adiponectin, whose mechanisms of action are still under active investigation.
Death of pancreatic beta cells is a hallmark feature of type 1 diabetes and may occur
only in very advanced stages of type 2 diabetes. Excess adipose in the thighs and but-
tocks does not contribute as strongly to insulin resistance as does visceral fat, presum-
ably due to a lower level of endocrine activity of such fat depots. Dysfunction of liver
lipid metabolism is more a consequence of excess activity of adipose than a cause of in-
sulin resistance. A sedentary lifestyle contributes to build-up of excess fat stores but
does not act directly to induce insulin resistance.
3. The answer is D. This student is still in the fed or absorptive state within 1 hour of a
meal, so elevated levels of many nutrients derived from food digestion would be ob-
served in her blood. This would include all items in the list except glucagon. High nu-
trient levels in the blood evoke increased insulin secretion from the beta cells and
suppression of glucagon secretion by the alpha cells of the islets of Langerhans. There-
fore, blood levels of glucagon would be decreased relative to other nutritional states.
4. The answer is D. This woman has created a self-imposed starvation through her hunger
strike. During starvation, many fuel sources are recruited to support bodily functions,
including protein degradation, which supplies amino acids as gluconeogenic precur-
sors, and triacylglycerol degradation, which yields glycerol, free fatty acids and, eventu-
ally, ketone bodies. The brain normally prefers glucose as its main fuel, so no
adaptation is needed. During starvation, changes in brain gene expression up-regulate
68 USMLE Road Map: Biochemistry
N
several enzymes to enable use of ketone bodies as fuel. No matter how long the fast
lasts, the brain cannot use glycerol, amino acids, or free fatty acids as direct fuel sources.
5. The answer is C. This girl’s symptoms are consistent with extreme hyperglycemia,
which is consistent with her excessive thirst (polydipsia), urination habits (polyuria),
and appetite (polyphagia). Her neurologic symptoms are probably secondary to ke-
toacidosis, likely resulting from type 1 diabetes. The finding of glucose spillover into
her urine strongly supports this conclusion. An acute hyperglycemic condition due to
type 1 diabetes is characterized by a near-absence of insulin with unopposed glucagon
action, particularly in the liver. So both gluconeogenesis and ketogenesis are elevated in
such patients. All the other processes listed would be operating at reduced activity rela-
tive to their levels in the presence of a higher insulin-glucagon ratio.
Chapter 5: Metabolic Interrelationships and Regulation 69
N
I. Digestion and Absorption of Dietary Carbohydrates
A. The main sites of breakdown of dietary carbohydrates are the mouth and the
duodenum.
1. The process starts in the mouth during mastication where salivary ␣-amy-
lase cleaves some of the α-1,4 glycosidic bonds of starch.
2. This process is completed in the duodenum where pancreatic ␣-amylase
produces a mixture of monosaccharides, disaccharides, and oligosaccharides.
3. Disaccharides are cleaved to monosaccharides by a battery of disaccharidases
after absorption into intestinal mucosal cells.
a. For example, sucrose is hydrolyzed to glucose and fructose by sucrase.
b. Lactase, which is responsible for hydrolyzing lactose to glucose and galac-
tose, is expressed at low levels in many adults, especially those with lactose
intolerance.
B. Uptake of monosaccharides and disaccharides by intestinal mucosal cells is me-
diated by a variety of transporters.
II. Glycolysis
A. Glycolysis is the process by which glucose is broken down to pyruvate in order
to begin obtaining some of the energy stored in the glucose molecule for use by
the body.
1. The energy released in this process results in the direct formation of ATP.
2. The further metabolism of pyruvate also yields ATP synthesis through oxida-
tive phosphorylation (see Chapter 7).
3. Disruption of glycolysis causes disease and death due to the reliance of some
tissues (RBCs and neurons, for example) on glucose metabolism for their en-
ergy needs.
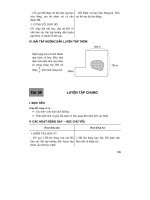
4. The first steps in glycolysis result in the conversion of a six-carbon glucose
molecule to two three-carbon intermediates (Figure 6–1).
5. Energy (ATP) is expended in the phosphorylation of intermediates in these
reactions.
6. Many enzymes and intermediates of glycolysis also operate in gluconeo-
genesis.
B. Two key enzymes, hexokinase and glucokinase, catalyze the reaction of glucose
with ATP to form glucose 6-phosphate, which becomes trapped in the cell and
subject to metabolism.
N
CHAPTER 6
CHAPTER 6
CARBOHYDRATE
METABOLISM
70
Copyright © 2007 by The McGraw-Hill Companies, Inc. Click here for terms of use.
Chapter 6: Carbohydrate Metabolism 71
N
Hexokinase
ATP
H
+
Glucose 6-phosphate
Phosphofructokinase-1 (PFK-1)
Fructose 2,6-bisphosphate
AMP
ATP
Citrate
Phosphoenolpyruvate
ADP
ATP
ADP
ATP
ADP
ATP
ADP
NAD
+
+
Fructose 6-phosphate
Aldolase
Glyceraldehyde 3-phosphate
Glyceraldehyde 3-phosphate
dehydrogenase
1, 3-Bisphosphoglycerate
Phosphoglycerate kinase
Pyruvate kinase
ATP
Acetyl CoA
Alanine
3-Phosphoglycerate
2-Phosphoglycerate
Phosphoenolpyruvate
NAD
+
Lactate dehydrogenase
Pyruvate
Lactate
Anaerobic conditions
Glucose
Fructose 1,6-bisphosphate
+
–
–
–
Dihydroxyacetone phosphate
NADH
H
+
+
NADH
P
i
Figure 6–1. The steps of glycolysis. Feedback inhibition of glucose phosphorylation by hexokinase,
inhibition of pyruvate kinase, and the main regulatory, rate-limiting step catalyzed by phosphofructoki-
nase (PFK-1) are indicated. Pyruvate formation and substrate-level phosphorylation are the main out-
comes of these reactions. Regeneration of NAD
+
occurs by reduction of pyruvate to lactate during
anaerobic glycolysis.
1. The principal enzyme catalyzing this reaction, hexokinase, is found in all
cells and has a high affinity (low K
m
) for glucose.
a. The high affinity of hexokinase for glucose means that even when glucose
levels in the body are low, cells can efficiently take up glucose and obtain
energy from it.
b. Glucose 6-phosphate inhibits hexokinase, preventing cells from metabo-
lizing excess glucose and harming other cells by reducing glucose available
in the blood for metabolism.
2. Glucokinase is found in the liver and is responsible for dealing with the high
levels of glucose available after a meal.
a. Glucokinase has a low affinity (high K
m
) for glucose but has a high V
max
.
b. Elevation of blood glucose levels after a meal stimulates the pancreas to se-
crete insulin, which among its many actions induces synthesis of glucoki-
nase by the liver.
3. The negative charge of glucose 6-phosphate prevents it from diffusing
across the plasma membrane and effectively traps glucose inside the cell for
future metabolism.
C. The key regulatory enzyme phosphofructokinase-1 (PFK-1) catalyzes the syn-
thesis of fructose 1,6-bisphosphate.
1. ATP is the phosphate donor for this reaction; two high-energy phosphates
must be invested at the start of glycolysis.
2. PFK-1 catalyzes this irreversible and rate-limiting step in glycolysis and is
highly regulated.
3. PFK-1 is subject to allosteric inhibition by ATP, citrate, and phospho-
enolpyruvate, all of which are elevated when the cell has a high level of energy
reserves.
a. AMP is a very sensitive indicator of the cell’s energy needs because of
rapid interconversion of adenine nucleotides and is an important activa-
tor of PFK-1.
b. PFK-1 is also activated by fructose 2,6-bisphosphate, which is made by
the action of a second phosphofructokinase, PFK-2, using fructose
6-phosphate and ATP as substrates.
D. The six-carbon fructose 1,6-bisphosphate is then cleaved into two three-carbon
molecules, dihydroxyacetone phosphate and glyceraldehyde 3-phosphate, by
the action of aldolase.
1. Interconversion between these three-carbon intermediates is a reversible reac-
tion catalyzed by triose phosphate isomerase.
2. Only glyceraldehyde 3-phosphate can go on to further metabolism to yield
pyruvate.
E. In the second phase of glycolysis, two glyceraldehyde 3-phosphate molecules
from glucose are converted to pyruvate in conjunction with several important
energy-generating reactions (Figure 6–1).
1. The formation of 1,3-bisphosphoglycerate involves the synthesis of a high-
energy phosphate bond as the aldehyde of glyceraldehyde 3-phosphate is oxi-
dized to a carboxylic acid and then phosphorylated by reaction with
inorganic phosphate.
2. Formation of 1,3-bisphosphoglycerate is coupled to reduction of NAD
+
by
transfer of two electrons and a proton to form NADH + H
+
.
72 USMLE Road Map: Biochemistry
N
F. Conversion of 1,3-bisphosphoglycerate to 3-phosphoglycerate represents an
oxidation coupled to synthesis of ATP from ADP.
1. This reaction is catalyzed by phosphoglycerate kinase and is reversible.
2. This is an example of substrate-level phosphorylation, ie, the creation of a
high-energy phosphate bond through a chemical reaction rather than via ox-
idative phosphorylation (see Chapter 7).
G. Another key enzyme, pyruvate kinase, catalyzes the conversion of phospho-
enolpyruvate to pyruvate and the formation of a second ATP in glycolysis.
1. Pyruvate kinase is inhibited by compounds that are elevated when the cell has
high energy reserves or molecules with potential for energy generation.
2. High ATP levels inhibit pyruvate kinase.
3. High amounts of acetyl CoA that can be converted to ATP through the tri-
carboxylic acid cycle (see Chapter 7) inhibit pyruvate kinase.
4. High alanine levels inhibit pyuvate kinase; alanine can be converted to pyru-
vate (see Chapter 9).
PYRUVATE KINASE DEFICIENCY
• Inherited deficiency of pyruvate kinase impairs glycolysis in all cells but has the most acute effect on
RBCs.
• Anaerobic glycolysis is the only energy source available for maintenance of RBC viability, so the in-
creased rate of erythrocyte death leads to hemolytic anemia.
• Pyruvate kinase deficiency affects 1 in 10,000 people and is the most common inherited disorder of
glycolysis.
• Most cases are due to decreased expression of pyruvate kinase activity, usually to 5–25% of normal
levels; complete loss of pyruvate kinase activity can cause embryonic death.
III. Regeneration of NAD
+
A. Regeneration of NAD
+
that was converted to NADH by electron transfer dur-
ing glycolysis must occur in order for glycolysis to continue.
B. The mechanisms that maintain balance between NAD
+
usage and regeneration
differ under aerobic versus anaerobic conditions in tissues.
C. In cells that are unable to transfer electrons to oxygen due to lack of mitochon-
dria, eg, RBCs, or in vigorously exercising muscle cells (anaerobic conditions),
NAD
+
is regenerated by further metabolism of pyruvate.
1. Electrons are transferred from NADH to pyruvate by lactate dehydroge-
nase, forming NAD
+
and lactate (Figure 6–1).
2. This reaction is reversible, and lactate can subsequently serve as an important
source of carbons for gluconeogenesis in the liver.
3. RBCs lack mitochondria and therefore depend on anaerobic glycolysis for
energy needs.
4. In muscle tissue under hypoxic conditions, the energy needs of the tissue
may be partially supplied by anaerobic glycolysis.
a. Lactate build-up during anaerobic glycolysis limits the extent to which
muscle can obtain energy by this means.
b. Accumulation of lactic acid causes a decrease in muscle cell pH.
c. Decreased pH interferes with function of the contractile machinery of the
muscle.
Chapter 6: Carbohydrate Metabolism 73
N
CLINICAL
CORRELATION
d. Elevated muscle lactate accounts for fatigue and pain induced by strenu-
ous exercise.
D. In most cells, oxygen serves as the final acceptor of electrons removed during
pyruvate synthesis (aerobic conditions).
1. Electrons are removed from NADH and delivered to the mitochondrial elec-
tron transport chain where they ultimately are transferred to oxygen (see
Chapter 7).
2. Pyruvate is not consumed in this reaction and is available for further me-
tabolism.
E. There are two shuttle mechanisms, the malate-aspartate shuttle and the glyc-
erol 3-phosphate shuttle, that transport electrons to the inner mitochondrial
matrix to be used in the electron transport chain.
1. In the malate-aspartate shuttle, two electrons are transferred to form
NADH in the inner mitochondrial matrix (Figure 6–2A).
a. Oxaloacetate is reduced by reaction with NADH in the cytosol to form
malate and regenerate NAD
+
for glycolysis.
b. Malate is then transported through the inner mitochondrial membrane by
a transport protein.
c. Oxaloacetate and NADH are then re-formed in the mitochondrial
matrix.
d. The electrons are passed from NADH to the electron transport chain for
ATP biosynthesis in oxidative phosphorylation.
e. Oxaloacetate is converted to aspartate, which is returned to the cytosol by
transport across the inner mitochondrial membrane.
f. Aspartate is converted to oxaloacetate, completing the cycle and allowing
transport of more electrons to the mitochondria.
2. The glycerol 3-phosphate shuttle is a second mechanism for transferring
cytosolic electrons to the mitochondria (Figure 6–2B).
a. Dihydroxyacetone phosphate is reduced by reaction with NADH to form
glycerol 3-phosphate and NAD
+
.
b. Two electrons are transferred from glycerol 3-phosphate to an FAD com-
plex, which is imbedded in the inner mitochondrial membrane.
c. FADH
2
is formed during this reaction and dihydroxyacetone phosphate is
regenerated at the surface of the inner mitochondrial membrane.
d. Electrons from FADH
2
are transferred to the electron transport chain.
3. While the glycerol 3-phosphate shuttle appears to be less efficient than the
malate-aspartate shuttle because fewer ATP molecules are synthesized (see
Chapter 7), its advantage is that it enables the cell to transport electrons in
the presence of high amounts of NADH.
F. The electrons that are generated from the first step in ethanol metabolism (cat-
alyzed by alcohol dehydrogenase) are transported into the mitochondrion by
these two shuttles.
LACTIC ACIDOSIS
• Conditions that cause decreased oxygenation of tissues force excessive dependence on anaerobic gly-
colysis for energy production, with attendant lactic acid buildup in tissues and spillover into the blood.
• Convulsions, shock, uncontrolled hemorrhage or conditions that interfere with circulatory function
can cause lactic acidosis.
74 USMLE Road Map: Biochemistry
N
CLINICAL
CORRELATION
• Metabolic acidosis, a potentially fatal condition, is characterized by nausea, vomiting, abdominal
pain, lethargy, elevated heart rate, and irregular heart rhythm.
• Treatment of metabolic acidosis usually involves intravenous sodium lactate solution to normalize
blood pH; the cause of the lactic acid overproduction should be determined and treated.
G. Energy yields from glycolysis depend on the system used to regenerate NAD
+
.
1. Although ATP is consumed in the initial steps of glycolysis, it is generated in
subsequent reactions, resulting in net ATP production.
2. Under anaerobic conditions, glycolysis results in a net synthesis of only two
ATP molecules for each molecule of glucose metabolized (Table 6–1).
Chapter 6: Carbohydrate Metabolism 75
N
Oxaloacetate
Malate
NAD
+
Aspartate
Oxaloacetate
Malate
NAD
+
Aspartate
H
+
H
+
Inner mitochondrial
membrane
+
NADH
+
NADH
Dihydroxyacetone
phosphate
Glycerol
3-phosphate
H
+
Inner mitochondrial
membrane
NAD
+
FAD
+
NADH
FADH
2
Figure 6–2. Shuttle systems for transport of electrons from cytosol into the mito-
chondrial matrix. A (top): The malate-aspartate shuttle. B (bottom): The glycerol
3-phosphate shuttle.
3. The energy yield resulting from glucose metabolism under aerobic conditions
includes
a. Two ATP molecules generated during anaerobic glycolysis.
b. Over 30 ATP molecules are formed from the subsequent metabolism of
pyruvate in the mitochondria (see Chapter 7).
IV. Pentose Phosphate Pathway
A. The pentose phosphate pathway (PPP), also called the hexose monophos-
phate shunt, is an alternate pathway of glucose metabolism that supplies the
NADPH required by many biosynthetic pathways.
1. The main purpose of the PPP is to generate NADPH to be used in path-
ways for synthesis of important molecules, eg, amino acids, lipids, and nu-
cleotides.
2. NADPH derived from the PPP is also important for detoxification of reac-
tive oxygen species.
3. The PPP also is responsible for synthesis of ribose 5-phosphate for nu-
cleotide biosynthesis.
B. The PPP operates in two phases: an oxidative phase and a nonoxidative phase.
1. In the oxidative phase, glucose 6-phosphate is metabolized by glucose
6-phosphate dehydrogenase (G6PD) to form 6-phosphogluconolactone
(Figure 6–3).
a. NADP
+
, a coenzyme for this reaction, is reduced to NADPH + H
+
in this
reaction.
b. G6PD catalyzes this rate-limiting step of the PPP and is inhibited by
NADPH.
c. Once this reaction occurs, 6-phosphogluconolactone is committed to the
PPP.
d. The oxidative steps of the PPP result in the formation of two molecules of
NADPH, one of CO
2
, and one molecule of ribulose 5-phosphate.
2. The nonoxidative phase consists of a series of sugar-phosphate interconver-
sions that result in the conversion of ribulose 5-phosphate to ribose
5-phosphate (Figure 6–3).
a. Ribose 5-phosphate provides the ribose and deoxyribose sugars found in
nucleotides.
76 USMLE Road Map: Biochemistry
N
Table 6–1. Energy yield in anaerobic glycolysis.
Enzyme Step ATP Yield
Hexokinase − 1
Phosphofructokinase-1 − 1
Phosphoglycerate kinase +2
Pyruvate kinase +2
Sum +2
b. If adequate amounts of ribose are available through the diet and from cel-
lular turnover of nucleotides, then an alternative branch of the PPP is used.
(1)
Two molecules of ribulose 5-phosphate are converted to xylulose
5-phosphate.
(2)
These intermediates then react with ribose 5-phosphate to form gly-
colytic intermediates that can be used for energy production.
c. Thus, NADPH can be generated in the absence of net ribose production
and the carbohydrate backbone can be used to make energy.
G6PD DEFICIENCY CAUSES SENSITIVITY TO OXIDANTS
• G6PD deficiency is the most common genetic disease in the world, affecting over 400 million people,
most of whom are men, because the gene is located on the X chromosome.
• Persons with G6PD deficiency are normally asymptomatic, but their RBCs are susceptible to oxidative
damage because they have impaired production of NADPH.
Chapter 6: Carbohydrate Metabolism 77
N
Glucose 6-phosphate
dehydrogenase
CO
2
6-Phosphogluconolactone
NADPH
6-Phosphogluconate
Ribose 5-phosphate
Nonoxidative phase
Oxidative phase
Glucose 6-phosphate
Ribulose 5-phosphate
Glyceraldehyde 3-phosphate
2 Fructose 6-phosphate
H
2
O
NADP
+
H
+
NADPH +
H
+
NADPH +
6-Phosphogluconate dehydrogenase
Multiple sugar interconversions
(2) (1)
+
NADP
+
–
Xylulose 5-phosphate
Figure 6–3. The pentose phosphate pathway. In the oxidative phase of the pen-
tose phosphate pathway, NADP
+
is reduced to NADPH + H
+
, with feedback regula-
tion by NADPH at the step catalyzed by glucose 6-phosphate dehydrogenase. In the
nonoxidative phase, multiple sugar interconversions catalyzed by three different en-
zymes occur.
CLINICAL
CORRELATION
– In affected persons, RBCs have a limited ability to detoxify reactive oxygen species, eg, hydrogen
peroxide.
– Reactive oxygen species react with and denature cellular components, particularly hemoglobin,
leading to premature RBC death and hemolysis unless they are reduced by glutathione, which is de-
pendent on NADPH for its regeneration.
– The presence of precipitates of oxidized, denatured hemoglobin (Heinz bodies) helps distinguish
the hemolytic anemia caused by of G6PD deficiency from that caused by pyruvate kinase deficiency.
– RBCs are especially sensitive to G6PD deficiency because the PPP is the only source of NADPH in these
cells.
• Hemolytic anemia can be caused by eating foods (such as fava beans) or taking drugs (such as anti-
malarial agents or acetaminophen) that have oxidizing properties.
• The endemic presence of malaria in subequatorial Africa, where up to 25% of males are G6PD-
deficient, is associated with G6PD deficiency because the malaria protozoan is less viable in RBCs with
increased oxidative stress.
V. Key Enzymes Regulating Rate-Limiting Steps of Glucose Metabolism
A. Control of glucose degradation is accomplished by the regulation of key en-
zymes in the pathway (Table 6–2).
B. This regulation is related to the amount of energy stores in the cell and the avail-
ability of substrates for the generation of ATP.
VI. Glycogen Metabolism
A. Glycogen is the storage form of glucose mainly found in liver and muscle.
1. Glycogen stores are regulated by a balance between glycogen synthesis
(glycogenesis) and breakdown (glycogenolysis).
2. Glycogen stores serve as an easily mobilized source of glucose to provide
for the short-term needs of the body.
78 USMLE Road Map: Biochemistry
N
Table 6–2. Regulators of enzyme activity in glucose metabolism.
Enzyme Activators Inhibitors
Hexokinase Glucose 6-phosphate
Phosphofructokinase-1 Fructose 6-phosphate ATP
AMP Citrate
Fructose 2,6-bisphosphate
Phosphoenolpyruvate
Pyruvate kinase ATP
Alanine
Acetyl CoA
Glucose 6-phosphate NADPH
dehydrogenase
3. However, the glycogen stores of the body are insufficient to provide glucose
during prolonged glucose deficit, ie, during fasting that lasts more than 24
hours.
B. Glycogenesis occurs in response to stimulation by insulin after ingestion of a
meal that raises blood glucose levels.
1. The first step of glycogenesis involves conversion of glucose 6-phosphate to
glucose 1-phosphate by the action of phosphoglucomutase (Figure 6–4).
2. Glucose 1-phosphate then is coupled with uridine diphosphate (UDP) to
form UDP-glucose, the main donor of glucosyl residues during the con-
struction of glycogen.
3. Glycogen synthase catalyzes the addition of glucose from UDP-glucose to
the end of a glycogen molecule, forming an α-1,4 linkage (Figure 6–4).
Chapter 6: Carbohydrate Metabolism 79
N
Glucokinase
α-1,4 linkages
α-1,6 linkage
ATP
PP
i
Glucose 6-phosphate
Glucose
UDP-Glucose
Glycogen synthase
ADP
Glucose 1-phosphate
uridyl transferase
UTP
UDP
x 6
Branching enzyme
2P
i
Phosphoglucomutase
Glucose 1-phosphate
*
Glycogenin
Glycogenin
Glycogenin
Figure 6–4. The steps of glycogenesis. Uridine diphosphate (UDP)-glucose is syn-
thesized and serves to donate glucose to an α-1,4 linkage at the non-reducing ends
of a preexisting glycogen chain, which is covalently attached to the protein glyco-
genin. The asterisk indicates coupling of this reaction to hydrolysis of PP
i
to P
i
in
order to drive formation of UDP-glucose. Branching enzyme removes terminal
residues and reattaches them to form an α-1,6 branch that can then be further
extended by glycogen synthase.
a. This enzyme can only extend preexisting glycogen molecules.
b. Glycogen synthase is only able to form α-1,4 glycosidic linkages as it ex-
tends the glycogen chain.
4. The glycogen recipient or acceptor is initially formed on glycogenin, a pro-
tein primer.
5. After a growing α-1,4 chain becomes approximately 11 glucose units in
length, branching enzyme removes at least 6 units and adds them to another
chain to form a branch.
a. The branch is linked via an ␣-1,6 glycosidic bond to the main α-1,4
chain.
b. Both the main chain and the new branch can then be extended by glyco-
gen synthase.
C. As glucose is consumed by cellular metabolism, glycogen is degraded
(glycogenolysis) to form free glucose in an effort to maintain relatively constant
blood glucose levels.
1. Glycogen breakdown is catalyzed by glycogen phosphorylase, which re-
moves the end glucose in the α-1,4 linkage from glycogen and combines it
with inorganic phosphate to form glucose 1-phosphate (Figure 6–5).
2. Glucose 1-phosphate is then converted to glucose 6-phosphate by phospho-
glucomutase.
3. When four glucose units remain on an α-1,4 branch of glycogen, then glyco-
gen phosphorylase cannot remove any further glucose units.
a. This impasse is overcome by debranching enzyme, which catalyzes trans-
fer of an α-1,4-linked glucose trisaccharide to the end of another branch.
b. Debranching enzyme then removes the remaining α-1,6-linked glucose as
free glucose.
4. Glucose 6-phosphate can then be metabolized by glycolysis in the liver or
muscle, or it can be dephosphorylated by the action of glucose 6-phos-
phatase mainly in the liver and released into the bloodstream for use by
other tissues of the body.
GLYCOGEN STORAGE DISEASES
• Deficiency of the enzymes of glycogen metabolism affects the ability of cells to store or use glycogen;
as a result, regulation of blood glucose levels can be severely impaired during short-term fasting.
• Glycogen storage diseases produce severe hypoglycemia, even on an overnight fast, and are fre-
quently diagnosed when the patient goes into hypoglycemic shock while sleeping.
• Untreated, glycogen storage diseases can lead to mental retardation or even death due to the energy
loss in the brain consequent to low blood glucose levels.
• The most common glycogen storage disease, Type I or von Gierke disease, is a deficiency in glucose
6-phosphatase in which glycogen structures are normal; however, the liver is unable to dephosphory-
late glucose 6-phosphate, and it remains trapped in the cell.
• Blood glucose levels in patients with von Gierke disease fall precipitously upon fasting, such as occurs
overnight during sleep, so treatment is to eat meals often to prevent hypoglycemic coma.
D. Hormonal Regulation of Glycogen Metabolism
1. As discussed in Chapter 5, the body regulates blood glucose concentration
through the opposing actions of insulin versus glucagon and epinephrine.
a. Insulin promotes storage of sugars, amino acids, and fats when they are
available from dietary sources.
80 USMLE Road Map: Biochemistry
N
CLINICAL
CORRELATION
Chapter 6: Carbohydrate Metabolism 81
N
P
i
10
2
2
10
Glycogen
phosphorylase
Glucose
1-phosphate
10 Glucose 6-phosphate
Glycolysis
Glycogenin
Glycogenin
Glycogenin
Glucose
Debranching
enzyme
Debranching
enzyme
Glycogenin
H
2
O
Figure 6–5. Glycogenolysis. Degradation of glycogen occurs stepwise by hydroly-
sis of one glucosyl unit at a time from the nonreducing ends by phosphorylase. The
limit dextrin occurs as indicated in the second step when there are four glucosyl
units remaining to a branch point. Once debranching enzyme has resolved the limit
dextrin, degradation by phosphorylase can resume.
(1)
Insulin simultaneously stimulates glycogen synthesis and inhibits
glycogen breakdown.
(2)
These combined insulin actions mediated mainly in liver and muscle
promote a net storage of glucose for future needs.
b. Beginning about 4 hours after the last meal, blood glucose levels begin to
fall, triggering an increase in glucagon, which promotes a changeover
from net storage of fuel toward utilization.
(1)
Glucagon stimulates glycogen breakdown and simultaneously inhibits
glycogen synthesis in the liver.
(2)
Net glycogen breakdown enables the liver to secrete glucose to pro-
vide for the energy needs of much of the body, particularly the brain.
c. Epinephrine actions provoke mobilization of various types of fuel re-
serves during times of emergency energy need (eg, stress).
(1)
The actions of epinephrine and glucagon are very similar at the molec-
ular level but occur mainly in different tissues.
(2)
Thus, epinephrine causes a rapid response toward net glycogen
breakdown to provide for the energy needs of muscle.
2. The hormonal mechanisms of action to regulate glycogenesis and glycogenol-
ysis involve reversible phosphorylation of the critical enzymes glycogen
synthase and phosphorylase, respectively (Figure 6–6).
a. Glucagon and epinephrine promote increased phosphorylation of
glycogen synthase on serine residues, which inactivates the enzyme.
b. Insulin action, mediated by protein phosphatase I, causes dephosphory-
lation of glycogen synthase, which activates the enzyme.
c. Glycogen phosphorylase is active in degrading glycogen when it is phos-
phorylated on serine residues by a dedicated kinase.
d. Glucagon and epinephrine promote phosphorylation of the kinase, which
in turn transfers the signal to phosphorylase.
e. Insulin action shuts down both the kinase and phosphorylase itself
through activation of protein phosphatase I.
VII. Gluconeogenesis
A. Blood glucose levels must be maintained within a relatively constant range to
supply critical organs and tissues (such as brain, RBCs, cornea, lens, kidney
medulla, and testes), even when intake of dietary carbohydrates is low.
B. During a prolonged fast, glucose can be synthesized from various precursors,
predominantly in the liver, by gluconeogenesis.
C. Because three of the reactions of the glycolytic pathway are irreversible, it is not
possible to simply run glycosis in reverse to manufacture glucose.
1. The critical and irreversible glycolytic steps that must be bypassed follow:
a. Phosphoenolpyruvate (PEP) to pyruvate, catalyzed by pyruvate kinase.
b. Fructose 6-phosphate to fructose 1,6-bisphosphate, catalyzed by PFK-1.
c. Glucose to glucose 6-phosphate, catalyzed by hexokinase or glucokinase.
2. However, seven of the reactions of glycolysis are reversible and can be used
for gluconeogenesis.
D. Conversion of pyruvate to PEP requires two enzyme-catalyzed steps.
1. Carboxylation of pyruvate to oxaloacetate occurs in the mitochondria (Fig-
ure 6–7).
82 USMLE Road Map: Biochemistry
N
Chapter 6: Carbohydrate Metabolism 83
N
Protein
phosphatase 1
Glycogen
synthase b
(inactive)
Glycogen
synthesis
Insulin
Glycogen
synthase a
(active)
Phosphorylase a
(active)
Phosphorylase b
(active)
Phosphorylase
kinase a
(active)
Ca
2
+
acting
through calmodulin
(in muscle only)
Glycogen
breakdown
Phosphorylase
kinase b
(inactive)
A
B
P
+
Protein
phosphatase 1
Insulin
+
Protein
phosphatase 1
Insulin
+
+
P
P
cAMP-dependent
protein kinase
Glucagon
Epinephrine
Glucagon
Epinephrine
+
cAMP-dependent
protein kinase
+
Figure 6–6. Hormonal regulation of glycogen metabolism. A: Glycogenesis. Activation of cyclic
AMP (cAMP)–dependent protein kinase by the action of glucagon or epinephrine binding to their
cell-surface receptors leads to phosphorylation and inactivation of glycogen synthase. Reactivation is
catalyzed by protein phosphatase I, which is activated as a result of insulin binding to its cell-surface
receptor. B: Glycogenolysis. The activity of glycogen phosphorylase is controlled by reversible
phosphorylation, in a manner opposite to that of glycogen synthase. The effects of glucagon and epi-
nephrine are still mediated by cAMP-dependent protein kinase, but through phosphorylase kinase,
which itself is regulated by a phosphorylation-dephosphorylation cycle. Insulin action promotes de-
phosphorylation both of phosphorylase kinase and of phosphorylase itself, which inhibits glycogen
breakdown.