Báo cáo y học: "How to evaluate the microcirculation: report of a round table conference" potx
Bạn đang xem bản rút gọn của tài liệu. Xem và tải ngay bản đầy đủ của tài liệu tại đây (358.7 KB, 9 trang )
Open Access
Available online />Page 1 of 9
(page number not for citation purposes)
Vol 11 No 5
Research
How to evaluate the microcirculation: report of a round table
conference
Daniel De Backer
1
, Steven Hollenberg
2
, Christiaan Boerma
3,4
, Peter Goedhart
4
,
Gustavo Büchele
1
, Gustavo Ospina-Tascon
1
, Iwan Dobbe
4
and Can Ince
4
1
Department of Intensive Care, Erasme University hospital, Université Libre de Bruxelles (ULB), 808 route de Lennik, B-1070 Brussels, Belgium
2
Sections of Cardiology and Critical Care Medicine, Cooper University Hospital, One Cooper Plazza, Camden 08103, New Jersey, USA
3
Intensive Care Unit, Medical Centre Leeuwarden, P.O. box 888, 8901 BR Leeuwarden, The Netherlands
4
Department of Clinical Physiology, Academic Medical Center, University of Amsterdam, Meibergdreef 9, 1105 AZ Amsterdam, The Netherlands
Corresponding author: Daniel De Backer,
Received: 9 May 2007 Revisions requested: 3 Jul 2007 Revisions received: 6 Aug 2007 Accepted: 10 Sep 2007 Published: 10 Sep 2007
Critical Care 2007, 11:R101 (doi:10.1186/cc6118)
This article is online at: />© 2007 De Backer et al.; licensee BioMed Central Ltd.
This is an open access article distributed under the terms of the Creative Commons Attribution License ( />),
which permits unrestricted use, distribution, and reproduction in any medium, provided the original work is properly cited.
Abstract
Introduction Microvascular alterations may play an important
role in the development of organ failure in critically ill patients
and especially in sepsis. Recent advances in technology have
allowed visualization of the microcirculation, but several scoring
systems have been used so it is sometimes difficult to compare
studies. This paper reports the results of a round table
conference that was organized in Amsterdam in November
2006 in order to achieve consensus on image acquisition and
analysis.
Methods The participants convened to discuss the various
aspects of image acquisition and the different scores, and a
consensus statement was drafted using the Delphi
methodology.
Results The participants identified the following five key points
for optimal image acquisition: five sites per organ, avoidance of
pressure artifacts, elimination of secretions, adequate focus and
contrast adjustment, and recording quality. The scores that can
be used to describe numerically the microcirculatory images
consist of the following: a measure of vessel density (total and
perfused vessel density; two indices of perfusion of the vessels
(proportion of perfused vessels and microcirculatory flow index);
and a heterogeneity index. In addition, this information should be
provided for all vessels and for small vessels (mostly capillaries)
identified as smaller than 20 μm. Venular perfusion should be
reported as a quality control index, because venules should
always be perfused in the absence of pressure artifact. It is
anticipated that although this information is currently obtained
manually, it is likely that image analysis software will ease
analysis in the future.
Conclusion We proposed that scoring of the microcirculation
should include an index of vascular density, assessment of
capillary perfusion and a heterogeneity index.
Introduction
The microcirculation is a commonly neglected entity. Haemo-
dynamic assessment has long been limited to measurements
of cardiac output and oxygen delivery, even though microvas-
cular oxygen delivery cannot be predicted from global haemo-
dynamic measurements. Because the microcirculation is the
primary site of oxygen and nutrient exchange, therapeutic
interventions aimed at increasing organ perfusion should be
accompanied by improved microvascular perfusion.
Recent years have witnessed the introduction into clinical
practice of devices that allow the microcirculation to be visual-
ized directly. The orthogonal polarization spectral (OPS) [1]
and the sidestream dark field (SDF) [2] imaging devices both
provide high contrast images of the microvasculature. Both
devices are based on the principle that green light illuminates
the depth of a tissue (up to 3 mm, according to the manufac-
turer) and that the scattered green light is absorbed by haemo-
globin of red blood cells contained in superficial vessels.
FCD = functional capillary density; MFI = microcirculatory flow index; NTSC = National Television Systems Committee; OPS = orthogonal polarization
spectral; PAL = phase alternating line; PPV = proportion of perfused vessels; PVD = perfused vessel density; SDF = sidestream dark field; SECAM
= sequential colour with memory.
Critical Care Vol 11 No 5 De Backer et al.
Page 2 of 9
(page number not for citation purposes)
Accordingly, both devices allow capillaries and venules to be
visualized because these contain red blood cells.
Using these devices, several investigators have reported that
the microcirculation is markedly altered in sepsis [3-5], that
these alterations are more severe in nonsurvivors than in survi-
vors [3,5], and that persistent microvascular alterations are
associated with development of multiple organ failure and
death [6]. These alterations typically include decreased vascu-
lar density exclusively, caused by decreased capillary density,
and decreased perfusion of capillaries. In addition, there can
be substantial heterogeneity in microvascular perfusion
between areas separated by a few millimetres. In critical illness
it has been the sublingual microcirculation that has mostly
been studied, and that is the main focus of this report in dis-
cussing quantification of the microcirculation. It should be
borne in mind, however, that there also can be heterogeneity
between different organ systems in critical illness [7].
Materials and methods
Various scoring systems have been developed by different
investigators. In addition, several analytic software packages
are under development. Given this high variability in image
analysis and given the importance it may have in separating
diseased from nondiseased states [3,5,8] and in evaluating
the effects of interventions [4,9-13], we organized a round
table conference to discuss the various aspects of image
acquisition and analysis, and used Delphi methodology to for-
mulate a consensus statement.
Description of the different scores: principles and
limitations
Two scores have been employed until now in clinical practice
(Table 1) [3,4].
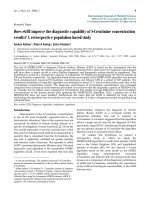
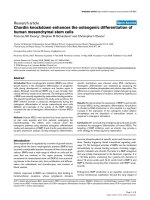
The first score was developed by De Backer and coworkers
[3] and is based on the principle that density of the vessels is
proportional to the number of vessels crossing arbitrary lines.
In this score, three equidistant horizontal and three equidistant
vertical lines are drawn on the screen (Figure 1). Vessel den-
sity can be calculated as the number of vessels crossing the
lines divided by the total length of the lines. Perfusion can then
be categorized by eye as present (continuous flow for at least
20 s), absent (no flow for at least 20 s), or intermittent (at least
50% of the time with no flow). The proportion of perfused ves-
sels (PPV [%]) can be calculated as follows: 100 × (total
number of vessels - [no flow + intermittent flow])/total number
of vessels. Perfused vessel density (PVD), an estimate of func-
tional capillary density (FCD), can be calculated by multiplying
vessel density by the proportion of perfused vessels.
In addition, small vessels (mostly capillaries) were separated
from large vessels (mostly venules) using a 20 μm cut-off. The
main advantage of this score is that it provides most of the var-
iables involved in organ perfusion, including vascular density
and proportion of perfusion. Counting the number of intersec-
tions of capillaries with arbitrary grid lines and measurement of
total capillary length relative to image surface are similarly reli-
able measures of FCD [14]. Reproducibility of this semiquan-
titative score is excellent, with an intra-observer variability
ranging between 2.5% and 4.7% for vessel density and
between 0.9% and 4.5% for vessel perfusion [3]. The inter-
Table 1
Characteristics of the perfusion scores used to assess the microcirculation
De Backer score [3] MFI [4]
Variable(s) measured Total vascular density Microvascular flow index
Small vessel density
Proportion of perfused vessels (all)
Proportion of perfused small vessels (PPV)
Perfused vessel density (all)
Perfused small vessel density (PVD)
Main characteristics Several variables measured, including FCD Rapid
Good reproducibility (intra-observer and inter-observer) Also provides information on type of flow in perfused vessels
(sluggish, normal, rapid)
Continuous variable Categorical variable
Disadvantages Score is sensitive to isotropy (change in image size
during optical magnification)
Functional capillary density (FCD) not provided
Available online />Page 3 of 9
(page number not for citation purposes)
observer variability is slightly higher (at between 3.0% and
6.2% and between 4.1% and 10%, respectively). Although
the images are stored using random numbers, they are ana-
lyzed in batches of images by a single investigator so that the
intra-observer variability applies when effects of interventions
are investigated. To prevent drift in analysis, images are
regularly reviewed by several investigators. A disadvantage of
the score is that it takes no account of the velocity of red blood
cells, provided that flow is continuous. In addition, the length
of the line can vary according to the magnification, which may
be a problem when post-acquisition manipulation of the image
is performed (software that provides image stabilization may
resize the image so that the final image may have a magnifica-
tion different from that of the original).
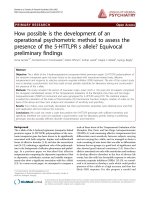
The second score is the microvascular flow index (MFI) score
[4,5,15]. This score is based on determination of the predom-
inant type of flow in four quadrants (Figure 2). Flow is charac-
terized as absent (0), intermittent (1), sluggish (2), or normal
(3). The values of the four quadrants are averaged. The main
advantage of this score is that it is relatively easy to measure.
It also takes into account the fact that flow can be continuous
but very slow (sluggish). The reproducibility of the test was
recently investigated by Boerma and coworkers [15]. These
authors reported an intra-observer agreement of 85% (Kappa
score 0.78) and inter-observer agreement of 90% (Kappa
score 0.85). A similar inter-observer reproducibility was
recently reported by Trzeciak and colleagues [5] (Kappa score
0.77). The main disadvantage is that it does not provide infor-
mation about FCD. Accordingly one cannot exclude that an
intervention improved flow in the vessels that are visualized but
that the number of perfused vessels decreased, which might
result in an impaired microvascular perfusion. In addition, the
score is ordinal and thus discontinuous; it ranges from 0 to 3,
and a change from 0 to 1 may not have the same implications
for tissue perfusion as a change from 2 to 3, which may com-
plicate the interpretation of the effects of therapeutic
interventions.
The two scores can be combined, as was recently done by
Trzeciak and coworkers [5] who used MFI to evaluate the type
of flow and the six lines (three horizontal, three vertical) tech-
nique to evaluate vessel density. In addition, those authors
developed an interesting index to assess flow heterogeneity
between the different areas investigated. This heterogeneity
index was calculated as the highest site flow velocity minus the
lowest site flow velocity, divided by the mean flow velocity of
all sublingual sites.
Theoretical and practical considerations
In analyzing microvascular images there are trade-offs to be
made, and several theoretical and practical considerations
may influence these choices. The subtler the changes one is
attempting to detect, the greater is the expertise required in
image analysis. Detection of large changes is easier but adds
less to more readily measurable parameters.
Perhaps most crucial is the element of time required to per-
form the analysis. Detecting subtler abnormalities and increas-
Figure 1
Determination of De Backer's score [3]Determination of De Backer's score [3]. Vessel density is calculated as
the number of vessels crossing the lines divided by the total length of
the lines. Perfusion is then categorized by eye as present (continuous
flow for at least 20 s), absent (no flow for at least 20 s) or intermittent
(at least 50% of time with no flow). The proportion of perfused vessels
(PPV [%]) and perfused vessel density (PVD) are then calculated. A 20
μm cut-off is used to separate small vessels (mostly capillaries) from
large vessels (mostly venules).
Figure 2
Determination of mean flow index (MFI) score [15]Determination of mean flow index (MFI) score [15]. The image is
divided into four quadrants and the predominant type of flow (absent =
0, intermittent = 1, sluggish = 2, and normal = 3) is assessed in each
quadrant. The MFI score represents the averaged values of the four. A
20 μm cut-off is used to separate small vessels (mostly capillaries) from
large vessels (mostly venules).
Critical Care Vol 11 No 5 De Backer et al.
Page 4 of 9
(page number not for citation purposes)
ing the precision of the measurements inevitably increases the
time required to make the determination. In addition to making
the analysis more tedious, the longer the analysis takes the
less applicable it may be to the clinical situation, because clin-
ical status of patients evolves over time.
Microvascular assessments are most likely to add incremental
value in patient management to the extent that results can be
applied expeditiously at the bedside. The immediacy of these
results must be traded off against considerations of accuracy
and reproducibility.
The measured variables should thus be relatively easy to
measure and should have pathophysiological implications.
Results and discussion
Consensus regarding image acquisition
The five consensual key points for image acquisition are sum-
marized in Table 2.
Number of sites in a specific organ
Given the intrinsic variability of the microcirculation [3,5], sev-
eral sites of the organ of interest should be averaged. Ideally
five sites should be examined, but at image analysis the quality
of some images may be less than initially estimated and these
should be discarded. Accordingly, we concluded that at least
three sites that can be reliably evaluated per patient, and if
possible five sites, should be obtained at each evaluation.
Adequate choice of optical magnification
One may wish to increase optic magnification in order to
enhance visualization of some structures (white blood cells).
On the other hand, the increased microscopic precision limits
the field of interest to a narrower window, which may be prob-
lematic, considering the heterogeneity of the microcirculation.
In addition, movement artifacts will be magnified. Accordingly,
we recommend use of 5× objectives for human sublingual
microcirculation with OPS and SDF devices. In small animals,
10× objectives should be used.
Pressure artifacts should be eliminated
Capillaries and venules are collapsible; accordingly, these ves-
sels may be very sensitive to pressure applied to the organ.
Because the microcirculation is just below the microscope,
excess pressure applied to the area may collapse the microcir-
culation, and the investigation of the microcirculation can
become unreliable in these conditions. This can result in
decreased flow in large venules (venules >30 μm), which may
become sluggish, absent, or alternate, or there may even be
backflow. Importantly, pressure may be only focal, when the
pressure is not applied globally to the preparation but only to
one side. Of note, pressure artifacts can also be observed dur-
ing compression of the tongue (for instance, by the investiga-
tors' finger, in an attempt to stabilize the tongue) or during
contraction of tongue muscles. Interestingly, all authors have
reported that venular perfusion is always preserved, whatever
the severity of alteration in smaller vessels [3,8]. Observation
of an altered large venular blood flow is thus suggestive of a
pressure artifact. To prevent applying pressure to the area, it
is recommended that the microscope be pulled back gently
until contact is lost and then to advance the probe again slowly
to the point at which contact is regained. These aspects are
summarized in the operational procedure proposed by
Trzeciak and coworkers [5].
Minimal technical setup
Several technical issues should be addressed to ensure ade-
quate image acquisition and further analysis. Video images are
usually immediately captured on a computer using a dedicated
videocard, and the images should be stored at full size as DV-
AVI files to allow computerized frame-by-frame image analysis
and use for educational purposes. We recommend limiting
recording time to 20 s because it may be difficult to maintain
a clear and steady image for a longer period. In addition,
longer clips should be divided for further analysis, especially if
analysis is performed using software. Clips of 20 s duration
are already very large (50 to 100 MB), and the need for ade-
quate storage should be anticipated. To enhance image focus-
ing, large external monitors should be used instead of the LCD
screen of the computer. Videotaping the image (and later digi-
talization of the images) can also be performed if needed, but
high-quality digital videotape recording and appropriate label-
ling of the video strips are necessary. VHS video recording or
DVD recording where MPEG compression is used should be
avoided because these result in loss of resolution.
Consensus regarding image analysis
Several determinations should be made during image analysis.
First, capillaries should be differentiated from venules,
because capillaries contribute predominantly to organ per-
fusion. Second, perfusion should be estimated. The perfused
capillary density is probably the most important variable to
determine because it is factor with the greatest influence on
perfusion. In addition, it is also important to determine
Table 2
The five key points for optimal image acquisition
Point Details
1Five sites per organ
2 Avoidance of pressure artefacts
3 Elimination of secretions
4 Adequate focus and contrast
adjustment
5 High quality recording
Available online />Page 5 of 9
(page number not for citation purposes)
perfusion heterogeneity, which is a crucial determinant of
extraction capabilities of the tissue [16-18].
The usefulness of determining the speed of blood in the ves-
sels is uncertain. Homogeneity of perfusion is more important
than blood velocity in assuring tissue oxygenation, because
cells are able to regulate oxygen extraction in the presence of
variable flow. Accordingly, a homogenous low flow (sluggish)
may be better tolerated than a heterogenous flow, even when
total blood flow is lower [19]. The consequences of very high
blood flow are not well known. From a theoretical point of view,
very high flow may induce shear-stress lesions to the capillary
wall, promoting further microvascular lesions, and may impair
oxygen offloading. However, the importance of these phenom-
ena has not been demonstrated in the clinical setting. For this
reason, very high flow is not taken into account in the different
scores.
Choice of diameter
It is difficult to separate venules from capillaries. Usually, these
vessels are delineated according to their diameter and a cut-
off value of 20 μm is used to differentiate capillaries from
venules. However, the size of capillaries and venules can be
affected by various factors, so this limit can fluctuate. Analyses
of larger vessels are of limited interest except as a quality con-
trol measure to ensure that no excessive pressure is applied to
the tissue. In larger venules, rolling and adherent leucocytes
can be observed, but this requires higher magnification and
different analytical methods.
Quadrants
Separation of the screen into quadrants (or using equidistant
lines) is mandatory when analysis is done by eye. Indeed, it is
very difficult to count vessels over the entire screen because
the eye may be attracted by specific regions of interest. How-
ever, the altered microcirculation is usually heterogeneous,
and it is thus important to have a full overview of the image. To
obtain a comprehensive measure of the perfusion characteris-
tics, it is advisable to measure both the MFI, and the PVD and
PPV. The image is divided into four quadrants and flow is
assessed in each quadrant to measure the MFI [15]. Three
horizontal and three vertical lines are drawn on the screen, and
perfusion of each vessel at an intersection with lines drawn on
the screen is determined to measure the PVD and PPV [3] of
the image. This type of comprehensive analysis (for example,
MFI, PPV and PVD) helps to generate a picture of perfusion
and perfusion heterogeneity in representative types of vessels,
avoiding oversimplification. (Additional files 1 to 4). Drawing
quadrants or lines may be obsolete if perfusion of all vessels
can be detected by software analyses.
Measured variables: FCD
FCD, estimated as PVD, can be calculated either as the
number of perfused vessels that cross three horizontal and
three vertical lines, divided by total length of lines (as in the
report by De Backer and coworkers [3]) or as total length of
perfused vessels divided by total surface of area (with appro-
priate software) [20].
Perfused vessels are defined as total number of vessels - (no
flow + intermittent vessels). These may be calculated for each
type of vessel. Problems may be encountered when the vessel
diameter is incorrectly identified and with looping vessels that
may be counted twice. Calculation should be made only in
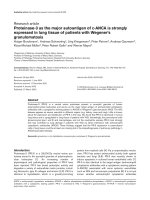
images that have not been manipulated. Software can be help-
ful in stabilizing the image, but this procedure implies some
size reduction (Figure 3). The total length of the lines will be
affected by this procedure.
To calculate the total length of the lines, we must know exactly
the size of the image projected on the screen. The US National
Television Systems Committee (NTSC) standard and the
phase alternating line (PAL) and sequential colour with mem-
ory (SECAM) standards use different displays that may affect
the presentation on the screen (720 × 576 pixels for DV-PAL
and 720 × 480 pixels for DV-NTSC). The resulting differences
in area should be taken into account when using a scoring
method worldwide. The optical field of view of SDF imaging
with 5× objectives is approximately 0.94 mm × 0.75 mm. A
slight difference between the magnifications between OPS
and SDF explain small differences in image size. In PAL/
SECAM standard the OPS system gives an image size of 1.54
mm × 1.15 mm (1.54 mm × 0.96 mm in NTSC), and the SDF
gives an image size of 0.98 × 0.73 mm (0.98 mm × 0.60 mm
in NTSC). Of note, the length and width of both systems can
slightly vary during focusing because both OPS and SDF
devices focus by moving the camera closer or further away
from the tissue, altering the magnification. Usually, this effect
Figure 3
Change in image size during software stabilizationChange in image size during software stabilization. When movements
occur, software can re-centre the image using easily recognized struc-
tures. However, peripheral parts of the images, not seen on successive
images, will be lost so that the final area will be smaller than the original
one. The size of the original image is represented by the light grey rec-
tangle, and the final one by the light blue rectangle.
Critical Care Vol 11 No 5 De Backer et al.
Page 6 of 9
(page number not for citation purposes)
is quite limited but it can be as large as 10% when the full
range of focus (0 to 1 mm depth [1]) is explored.
Measured variables: flow index
The ideal software, we propose, should automatically recog-
nize all blood vessels and measure their diameters and blood
flow in each individual vessel of the investigated field. This is
not currently available. Semi-quantitative analysis should
therefore be used; such analysis has been proven to be able
to distinguish between health and disease [3,5,8].
Our consensus is that all three indices discussed above (PVD,
PPV and MFI) should be measured to describe comprehen-
sively the functional perfusion of the microcirculation. Looking
at PPV allows no distinction to be made between normal, slug-
gish and hyperdynamic flows, but it provides information on
flow heterogeneity within the image. PVD provides an accu-
rate estimate of FCD.
In addition to making the distinction between perfusion and
nonperfusion, the MFI score differentiates between the differ-
ent types of continuous flows (sluggish, normal and high flow).
In conditions where flow is homogeneous, the MFI score can
thus provide additional information. However, with this method
the capillary density, and thus FCD, is not estimated. Hence,
the proportion of perfusion should be used in heterogeneous
situations, whereas MFI should be preferred in more homoge-
nous conditions because it takes into account the difference
between sluggish and continuous flows.
Measured variables: heterogeneity index
The microcirculation is heterogeneous in many disease states,
and for this reason it has been proposed that several areas be
averaged. The heterogeneity can be quantified. Initially, the
coefficient of variability was used [3]. More recently, Trzeciak
and coworkers [5] proposed another heterogeneity index,
which involves evaluating three to five sites and measuring the
MFI in the quadrants, taking the difference between highest
MFI minus the lowest site MFI divided by the mean flow veloc-
ity of all sublingual sites at a single time point. This heteroge-
neity index has the advantage of taking into account extreme
deviations, whereas the coefficient of variation evaluates all
deviations from the mean. From a pathophysiological point of
view, the heterogeneity is a key determinant of the shunted
fraction, often seen in distributive shock. For this reason, tak-
ing into account the extreme deviations is more representative.
What should be included in a report of the analysis of the
microcirculation?
An analysis of the microcirculation (Table 3) should be
reported for both total and small (<20 μm) vessels. The con-
sensus is to report PVD, PPV and MFI to describe the func-
tional perfusion of the microcirculatory image. The
heterogeneity index (calculated as the difference between
extreme values of either MFI or PPV between the three to five
recordings of the organ divided by its mean value) is needed
to describe the heterogeneity of perfusion in the microcircula-
tory area under observation.
Interpretation of the score
The interpretation of these variables may sometimes be diffi-
cult, especially when discordant changes between the differ-
ent indices occur during interventions.
Tissue perfusion is dependent on FCD (reflected by PVD) and
blood velocity (reflected by MFI). As discussed above, vascu-
lar density is probably more important than blood velocity in
determining tissue perfusion, because oxygen extraction can
compensate for a decreased flow. Shunt fraction, a key deter-
minant of oxygen extraction capabilities [16,21,22], is
reflected by blood flow heterogeneity in the investigated area
by PPV and between the different areas of the investigated
organ by the heterogeneity index.
Software
Several software packages have been developed, allowing
FCD calculation or reliable blood flow measurements in indi-
vidual vessels. The CapImage software (Dr Zeintl software
Engineering, Heidelberg, Germany) has been developed for
intravital microscopy [23] but can also be used for the analysis
of OPS and SDF images [24,25]. This software is validated for
Table 3
The ideal analysis report
Component of report Measure (if applicable) Details (if applicable)
Vessel density Total vessel density
Perfused vessel density (PVD) All (n/mm)
a
Small vessels (n/mm)
a
Perfusion indices Proportion of perfused vessels (PPV [%]) All Large vessels Small vessels
Microvascular flow index (MFI) All Large vessels Small vessels
Heterogeneity index (%)
a
Vessel density is expressed as mm/mm
2
if software is used to draw vessel length (and calculated as perfused vessel length/investigated area.
Available online />Page 7 of 9
(page number not for citation purposes)
blood flow measurements in straight vessels segments only.
The CapiScope software (KK Technology; Honiton, UK) has
been developed for analysis of OPS images. It measures FCD,
and vessel diameter and velocity. It reliably measures blood
flow in individual vessels. Very stable images, without any
movement artifact, should be used with these two software
packages because they do not provide image stabilization.
Recently, the MAS analysis system (MicroVision Medical,
Amsterdam, The Netherlands) was developed. It includes a
stabilization image processing, a calculation of FCD and
measurements of blood flow in individual vessels. Unfortu-
nately, these packages still require much user intervention to
identify the vessels of interest. In addition, flow cannot be cal-
culated automatically and simultaneously in multiple vessels,
so that blood flow distribution histograms can not readily be
obtained. In addition, it is particularly difficult to measure blood
flow in capillaries, which constitute the main area of interest.
Blood flow measurement is calculated as cross-sectional area
(based on measurement of vessel diameter) times blood
velocity. The error in determining the flow is especially large
with errors in measurement of vessel diameter, since it is the
square of the diameter that is used in cross-sectional area
(πD
2
/4) calculation. Determination of vessel diameter is diffi-
cult in small capillaries, and consequently the relative error in
measurements may be greatest in small vessels. Vessels are
visualized because they contain red blood cells but the vessel
wall is not visualized. In most vessels, multiple red blood cells
flow side by side, allowing easy identification of vessel diame-
ter. This is more complicated in small capillaries, especially
when red blood cells are separated by plasma gaps. Software
with time averaging of sequential frames and better imaging
modalities may improve the accuracy of these measurements.
One may anticipate that in the future FCD measurement will be
mechanized. Although FCD may be obtained automatically,
this process is likely to require some human validation, ideally
by clicking away vessels that do not appear to be perfused.
The human eye can easily draw a vessel when red blood cells
are separated by large plasma gap, whereas this is will proba-
bly continue to be a limitation of software in the short term.
All variables should be separated according to vessel size
using a cut-off of 20 μm. Histogram of vessel diameter and
vessel flow would provide not only mean values but also iden-
tify variability in the measurements.
Vessel flow measurements require a moving feature (isolated
red blood cell or white blood cell) to be visible in at least three
consecutive movie frames. The highest computer-aided meas-
urable velocity is physically restricted by the video frame rate
(30 frames/s for NTSC and 25 frames/s for PAL and SECAM)
and by the length of the vessel part where the flow is
assessed. Faster cameras with higher frame rates could over-
come this physical limitation. This is important because with
current conventional cameras the flow in fastest flowing ves-
sels can not be calculated [26].
Stabilization processes incorporated in software packages are
very helpful in improving image readability and computerized
analysis. However, problems of isotropy (see above) are
encountered when FCD is determined semi-quantitatively
using the six lines methods. Independently of the analytical
method used, some information will be lost. Indeed, peripheral
parts of the images, not seen on successive images when
movements occur, will be lost during the stabilization process
(Figure 3). As a result, the final image is smaller than the orig-
inal one, but the software displays this transformed image at
the same size as the original image, altering its magnification.
Ideally, the percentage of reduction from the original size
should be provided by the stabilization software, but this infor-
mation is not currently provided.
Specificities of microvascular networks
All of these methods have been developed in the sublingual
area, where vessels project in random directions. Accordingly,
orientation of the camera, and hence the lines, have no effect
on calculation of FCD. In other types of vascular structures, it
may be appropriate to use different types of analyses. When
vessels flow in parallel, lines perpendicular to the orientation of
the vessels should be used. For microvilli and crypts, one may
count the perfused units compared with the total number of
visualized units [7,15,27].
Conclusion
The scoring of the microcirculation should include an index of
vascular density, assessment of capillary perfusion and a het-
erogeneity index. The consensus advises reporting of PVD,
PPV, MFI and heterogeneity index, in order to describe the
functional perfusion of the microcirculation.
Additional files 1 to 4 provide four representative videos ana-
lyzed according to our consensus proposition, based on De
Backer's score [3] and MFI score [15] (heterogeneity index is
not determined on isolated images).
Key messages
• Analysis of the microcirculation can be reliably achieved
using semi-quantitative scores.
• Scoring should include measurement of perfused capil-
lary density and evaluation of heterogeneity. We pro-
pose that PVD, PPV and MFI should be measured.
Heterogeneity index should be calculated.
• Image acquisition should include at least three good
quality sequences of 20 s each. Absence of perfusion in
large veins suggests a pressure artifact.
Critical Care Vol 11 No 5 De Backer et al.
Page 8 of 9
(page number not for citation purposes)
Competing interests
DDB, SH, CB, PG, GB, GOT and ID had no conflict of interest
in relation to the current work; CI is Chief Scientific Officer of
MicroVision (a university-based company manufacturing SDF
devices).
Authors' contributions
All authors actively participated in the debates during the
round table conference. The drafts of the manuscript were
written by DDB and all authors contributed to writing of the
manuscript, which was circulated among each of them.
Additional files
References
1. Groner W, Winkelman JW, Harris AG, Ince C, Bouma GJ, Mess-
mer K, Nadeau RG: Orthogonal polarization spectral imaging: a
new method for study of the microcirculation. Nat Med 1999,
5:1209-1212.
2. Ince C: The microcirculation is the motor of sepsis. Crit Care
2005:S13-S19.
3. De Backer D, Creteur J, Preiser JC, Dubois MJ, Vincent JL: Micro-
vascular blood flow is altered in patients with sepsis. Am J
Respir Crit Care Med 2002, 166:98-104.
4. Spronk PE, Ince C, Gardien MJ, Mathura KR, Oudemans-van
Straaten HM, Zandstra DF: Nitroglycerin in septic shock after
intravascular volume resuscitation. Lancet 2002,
360:1395-1396.
5. Trzeciak S, Dellinger RP, Parrillo JE, Guglielmi M, Bajaj J, Abate NL,
Arnold RC, Colilla S, Zanotti S, Hollenberg SM: Early microcircu-
latory perfusion derangements in patients with severe sepsis
and septic shock: relationship to hemodynamics, oxygen
transport, and survival. Ann Emerg Med 2007, 49:88-98.
6. Sakr Y, Dubois MJ, De Backer D, Creteur J, Vincent J-L: Persistant
microvasculatory alterations are associated with organ failure
and death in patients with septic shock. Crit Care Med 2004,
32:1825-1831.
7. Boerma EC, van der Voort PH, Spronk PE, Ince C: Relationship
between sublingual and intestinal microcirculatory perfusion
in patients with abdominal sepsis. Crit Care Med 2007,
35:1055-1060.
8. De Backer D, Creteur J, Dubois MJ, Sakr Y, Vincent JL: Microvas-
cular alterations in patients with acute severe heart failure and
cardiogenic shock. Am Heart J 2004, 147:91-99.
9. Boerma EC, van der Voort PH, Ince C: Sublingual microcircula-
tory flow is impaired by the vasopressin-analogue terlipressin
in a patient with catecholamine-resistant septic shock. Acta
Anaesthesiol Scand 2005, 49:1387-1390.
10. Dubois MJ, De Backer D, Creteur J, Anane S, Vincent JL: Effect of
vasopressin on sublingual microcirculation in a patient with
distributive shock. Intensive Care Med 2003, 29:1020-1023.
11. De Backer D, Verdant C, Chierego M, koch M, Gullo A, Vincent J-
L: Effects of drotecogin alfa activated on microcirculatory
alterations in patients with severe sepsis. Crit Care Med 2006,
34:1918-1924.
12. De Backer D, Creteur J, Dubois MJ, Sakr Y, koch M, Verdant C,
Vincent JL: The effects of dobutamine on microcirculatory
alterations in patients with septic shock are independent of its
systemic effects. Crit Care Med 2006, 34:403-408.
13. Sakr Y, Chierego M, Piagnerelli M, Verdant C, Dubois MJ, koch M,
Creteur J, Gullo A, Vincent JL, De Backer D: Microvascular
response to red blood cell transfusion in patients with severe
sepsis. Crit Care Med 2007, 35:1639-1644.
14. Nolte D, Zeintl H, Steinbauer M, Pickelmann S, Messmer K: Func-
tional capillary density: an indicator of tissue perfusion? Int J
Microcirc Clin Exp 1995, 15:244-249.
15. Boerma EC, Mathura KR, van der Voort PH, Spronk PE, Ince C:
Quantifying bedside-derived imaging of microcirculatory
abnormalities in septic patients: a prospective validation
study. Crit Care 2005, 9:R601-R606.
The following Additional files are available online:
Additional file 1
A video clip file showing normal microcirculation in a
healthy volunteer. Thirty-eight small vessels (including
one with absent flow and none with intermittent flow) and
23 large vessels (all perfused) are visualized. MFIs for
each quadrant determined clockwise from the left upper
one are 3, 3, 3 and 3. Accordingly, PPV is 95%, PVD is
7.1/mm and MFI is 3.
See />supplementary/cc6118-S1.avi
Additional file 2
A video clip file showing altered microcirculation in a
patient with severe sepsis. Forty-nine small vessels
(including four with absent flow and eight with
intermittent flow) and 19 large vessels (all perfused) are
visualized. MFIs for each quadrant determined clockwise
from the left upper one are 3, 0, 3 and 3. Accordingly,
PPV is 61%, PVD is 5.9/mm and MFI is 2.25.
See />supplementary/cc6118-S2.avi
Additional file 3
A video clip file showing altered microcirculation in a
patient with severe sepsis. Thirty-six small vessels
(including one with absent flow and four with intermittent
flow) and 25 large vessels (all perfused) are visualized.
MFIs for each quadrant determined clockwise from the
left upper one are 3, 3, 3 and 3. Accordingly, PPV is
76%, PVD is 5.4/mm and MFI is 3.
See />supplementary/cc6118-S3.avi
Additional file 4
A video clip file showing severely altered microcirculation
in a patient with sever sepsis. Forty-six small vessels
(including 20 with absent flow and 14 with intermittent
flow) and 15 large vessels (all perfused) are visualized.
MFIs for each quadrant determined clockwise from the
left upper one are 0, 0, 3 and 0. Accordingly, PPV is
15%, PVD is 1.4/mm and MFI is 0.75.
See />supplementary/cc6118-S4.avi
Available online />Page 9 of 9
(page number not for citation purposes)
16. Humer MF, Phang PT, Friesen BP, Allards MF, Goddard CM,
Walley KR: Heterogeneity of gut capillary transit times and
impaired gut oxygen extraction in endotoxemic pigs. J Appl
Physiol 1996, 81:895-904.
17. Farquhar I, Martin CM, Lam C, Potter R, Ellis CG, Sibbald WJ:
Decreased capillary density in vivo in bowel mucosa of rats
with normotensive sepsis. J Surg Res 1996, 61:190-196.
18. Ellis CG, Bateman RM, Sharpe MD, Sibbald WJ, Gill R: Effect of
a maldistribution of microvascular blood flow on capillary O
2
extraction in sepsis. Am J Physiol 2002, 282:H156-H164.
19. Walley KR: Heterogeneity of oxygen delivery impairs oxygen
extraction by peripheral tissues: theory. J Appl Physiol 1996,
81:885-894.
20. Genzel-Boroviczeny O, Christ F, Glas V: Blood transfusion
increases functional capillary density in the skin of anemic
preterm infants. Pediatr Res 2004, 56:751-755.
21. Drazenovic R, Samsel RW, Wylam ME, Doerschuk CM, Schu-
macker PT: Regulation of perfused capillary density in canine
intestinal mucosa during endotoxemia. J Appl Physiol 1992,
72:259-265.
22. Kalliokoski KK, Oikonen V, Takala TO, Sipila H, Knuuti J, Nuutila P:
Enhanced oxygen extraction and reduced flow heterogeneity
in exercising muscle in endurance-trained men. Am J Physiol
Endocrinol Metab 2001, 280:E1015-E1021.
23. Klyscz T, Junger M, Jung F, Zeintl H: Cap image: a new kind of
computer-assisted video image analysis system for dynamic
capillary microscopy. Biomed Tech (Berl) 1997, 42:168-175.
24. Harris AG, Sinitsina I, Messmer K: Validation of OPS imaging for
microvascular measurements during isovolumic hemodilution
and low hematocrits. Am J Physiol Heart Circ Physiol 2001,
282:H1502-H1509.
25. Mathura KR, Vollebregt KC, Boer K, De Graaff JC, Ubbink DT, Ince
C: Comparison of OPS imaging and conventional capillary
microscopy to study the human microcirculation. J Appl
Physiol 2001, 91:74-78.
26. Lindert J, Werner J, Redlin M, Kuppe H, Habazettl H, Pries AR:
OPS Imaging of human microcirculation: a short technical
report. J Vasc Res 2002, 39:368-372.
27. Tugtekin I, Radermacher P, Theisen M, Matejovic M, Stehr A,
Ploner F, Matura K, Ince C, Georgieff M, Trager K: Increased ileal-
mucosal-arterial PCO2 gap is associated with impaired villus
microcirculation in endotoxic pigs. Intensive Care Med 2001,
27:757-766.