Báo cáo y học: "Validation of a continuous, arterial pressure-based cardiac output measurement: a multicenter, prospective clinical trial" pot
Bạn đang xem bản rút gọn của tài liệu. Xem và tải ngay bản đầy đủ của tài liệu tại đây (421.08 KB, 7 trang )
Open Access
Available online />Page 1 of 7
(page number not for citation purposes)
Vol 11 No 5
Research
Validation of a continuous, arterial pressure-based cardiac output
measurement: a multicenter, prospective clinical trial
William T McGee
1
, Jeffrey L Horswell
2
, Joachim Calderon
3
, Gerard Janvier
3
, Tom Van Severen
4
,
Greet Van den Berghe
4
and Lori Kozikowski
1
1
Critical Care Division, Baystate Medical Center, 759 Chestnut Street, Springfield, MA, 01199, USA
2
Department of Cardiac Anesthesia, Medical City Dallas Hospital, 7777 Forest Lane, Dallas, TX, 75230, USA
3
DAR II, CHU Bordeaux Group Hospitalier Sud, Avenue de Magellan, 33604 Pressac Cedex, France
4
Department of Intensive Care Medicine, UZ Leuven Gasthuisberg, Catholic University of Leuven, B-3000 Leuven, Belgium
Corresponding author: William T McGee,
Received: 29 Jun 2006 Revisions requested: 15 Aug 2006 Revisions received: 13 Aug 2007 Accepted: 19 Sep 2007 Published: 19 Sep 2007
Critical Care 2007, 11:R105 (doi:10.1186/cc6125)
This article is online at: />© 2007 McGee et al., licensee BioMed Central Ltd.
This is an Open Access article distributed under the terms of the Creative Commons Attribution License ( />2.0), which permits unrestricted use, distribution, and reproduction in any medium, provided the original work is properly cited.
Abstract
Introduction The present study compared measurements of
cardiac output by an arterial pressure-based cardiac output
(APCO) analysis method with measurement by intermittent
thermodilution cardiac output (ICO) via pulmonary artery
catheter in a clinical setting.
Methods The multicenter, prospective clinical investigation
enrolled patients with a clinical indication for cardiac output
monitoring requiring pulmonary artery and radial artery catheters
at two hospitals in the United States, one hospital in France, and
one hospital in Belgium. In 84 patients (69 surgical patients), the
cardiac output was measured by analysis of the arterial pulse
using APCO and was measured via pulmonary artery catheter
by ICO; to establish a reference comparison, the cardiac output
was measured by continuous cardiac output (CCO). Data were
collected continuously by the APCO and CCO technologies,
and at least every 4 hours by ICO. No clinical interventions were
made as part of the study.
Results For APCO compared with ICO, the bias was 0.20 l/
min, the precision was ± 1.28 l/min, and the limits of agreement
were -2.36 l/m to 2.75 l/m. For CCO compared with ICO, the
bias was 0.66 l/min, the precision was ± 1.05 l/min, and the
limits of agreement were -1.43 l/m to 2.76 l/m. The ability of
APCO and CCO to assess changes in cardiac output was
compared with that of ICO. In 96% of comparisons, APCO
tracked the change in cardiac output in the same direction as
ICO. The magnitude of change was comparable 59% of the
time. For CCO, 95% of comparisons were in the same direction,
with 58% of those changes being of similar magnitude.
Conclusion In critically ill patients in the intensive care unit,
continuous measurement of cardiac output using either APCO
or CCO is comparable with ICO. Further study in more
homogeneous populations may refine specific situations where
APCO reliability is strongest.
Introduction
Clinicians monitor hemodynamic variables to diagnose condi-
tions and to follow treatment in critically ill patients. In the
intensive care unit (ICU) and the operating room, such moni-
toring often includes cardiac output and, although potentially
measured by newer techniques, usually requires placement of
a pulmonary artery catheter. Intermittent (bolus) thermodilution
cardiac output (ICO) measurement is a standard to which
other methods of cardiac output measurement are compared
[1]. Pulmonary artery catheterization has come under increas-
ing criticism regarding its risks and costs, and questions have
arisen about its benefits [2,3]. Technologies equally effective
yet less invasive, safer, and simpler to use have consequently
been sought for cardiac output monitoring [4,5]. One of the
more promising approaches in the monitoring of cardiac out-
put is the estimation of flow from analysis of the arterial pres-
sure waveform.
Approaches to measuring cardiac output via a peripheral
artery catheter typically use algorithms by which the pulse
APCO = arterial pressure-based cardiac output; CCO = continuous cardiac output; ΔCO = change in cardiac output; ICO = intermittent thermodi-
lution cardiac output; ICU = intensive care unit.
Critical Care Vol 11 No 5 McGee et al.
Page 2 of 7
(page number not for citation purposes)
wave is analyzed and then related to a numerical value for car-
diac output. These devices often require frequent calibration
to initiate monitoring and to accurately assess cardiac output
during changing of the vascular tone [6,7]. A new arterial pres-
sure-based cardiac output (APCO) device uses access to the
radial or femoral artery via a standard arterial catheter. This
system (Vigileo/FloTrac; Edwards Lifesciences LLC, Irvine,
CA, USA) allows determination of the stroke volume based on
arterial waveform characteristics and individual patient demo-
graphics, without calibration [8-11].
This study compares measurement of cardiac output by anal-
ysis of the arterial pulse using APCO with measurement by
ICO. The study was designed to determine whether cardiac
output measurements obtained using APCO are comparable
with those obtained using a clinically accepted method such
as room-temperature ICO [12,13]. Continuous cardiac output
(CCO) measured with a pulmonary artery catheter was also
compared with ICO in order to show the performance of a
widely used CCO measure against ICO. The less-invasive
APCO technology may provide an additional option to improve
hemodynamic management in critically ill patients, including
those who currently are not monitored via pulmonary artery
catheter but for whom continuous measurement of cardiac
output and other flow-related parameters may allow timely
identification of changes in hemodynamic status and rapid
adjustment in therapy.
Materials and methods
Adult patients requiring pulmonary catheters and radial or fem-
oral artery catheters as part of standard clinical care were
enrolled from 1 August to 15 December 2004, at two US sites
and two European sites (Baystate Medical Center, Springfield,
MA, USA; Medical City Dallas Hospital, Dallas, TX, USA; Cen-
tre Hospitalier Universitaire, Bordeaux Group Hospitalier Sud,
Pessac, France; and Universitaire Ziekenhuizen Leuven, Leu-
ven, Belgium). Each site enrolled at least 20 patients.
Pulmonary artery catheters (models 746HF8, 744HF75,
777HF8, or 774HF75; Edwards Lifesciences) were placed
according to standard clinical practice for continuous and
intermittent measurement of cardiac output using Vigilance™
monitors (Edwards Lifesciences). These catheters are equiva-
lent in their ability to measure ICO and CCO. Catheter models
differ in that some contain an additional volume infusion port,
and some have the ability to measure right ventricular end-
diastolic volume.
Radial and femoral arterial lines from a variety of manufacturers
were connected to FloTrac™ sensors (Edwards Lifesciences),
and the cardiac output was determined using the algorithm
used in the commercially available Vigileo™ APCO system
(Edwards Lifesciences) [8]. Hemodynamic data were moni-
tored and recorded continuously and simultaneously with
CCO and APCO, and intermittently using ICO. All hemody-
namic data were collected on laptop computers and down-
loaded to a remote system for analysis.
For each patient, data collected from the APCO device were
compared with simultaneously collected data from the pulmo-
nary artery catheter over a 24-hour period. During the first 12
hours of data collection, reference ICO measurements were
collected every 3 hours. During the second 12 hours, these
measurements were made every 4 hours. All measurements
were made in the ICU. The intervals for data collection were
established to mimic the standard of care for cardiac output
measurements of the participating institutions. ICO values
were obtained from the average of a minimum four room-tem-
perature saline boluses injected at various times during the
respiratory cycle [14]: inspiration, peak inspiration, expiration,
and end expiration. Additional ICO measurements depended
on physician judgment and institutional practice. The physi-
cians responsible for the care of these patients were usually
the investigators. At least four complete sets of measurements
were made for each patient. Cardiac output measurements
derived from the APCO method were not used to guide
therapy.
Baseline demographics and significant comorbidities were
recorded in a database for subsequent analysis, and patient
identifiers were removed.
Cardiac output data were collected from all patients. Data
consisted of cardiac output determined by APCO, CCO, and
ICO during reference measurements every 3 or 4 hours
throughout the monitoring period. Bias and precision analysis
were used to compare cardiac output measurements from the
pulmonary artery catheter with those calculated from the
APCO technology. Bland–Altman plots were generated [15].
The difference between APCO and ICO values and the differ-
ence between CCO and ICO values were determined for each
set of cardiac output measurements. The mean and standard
deviation of the difference between cardiac output measure-
ments were calculated to estimate the bias and the precision.
The ability to accurately measure change in cardiac output is
important in clinical practice [16]. Although a clinically relevant
change in cardiac output is unknown, for the purposes of our
analysis we defined a significant change in cardiac output as
30%. In analysis of the direction and the magnitude of change
in cardiac output, the change in cardiac output (ΔCO) was cal-
culated as the difference in cardiac output at two time points
divided by the mean cardiac output at those two time points.
ΔCO was expressed as a percentage by multiplying this quan-
tity by 100%: ΔCO% = [CO
i
- CO
i-1
]/[(CO
i
+ CO
i-1
)/2] ×
100%. Increases and decreases of the same magnitude had
equivalent percentage changes that were opposite in sign.
The study protocol was approved by the institutional review
boards and/or ethics committees of the participating sites. All
Available online />Page 3 of 7
(page number not for citation purposes)
patients or their legal guardians provided prior written
informed consent for participation in this study.
Results
Each of the study's four centers enrolled 20–23 patients, for a
total of 86 enrolled patients. One patient died after only one
dataset was collected, and another patient had no data logged
due to technical difficulties. Of the remaining 84 patients, 69
had catheters placed during surgical procedures in the oper-
ating room before admission to the ICU. The other 15 partici-
pants were nonsurgical critical care patients. All data were
obtained in the ICU. All patients had pulmonary artery cathe-
ters placed, and all but one patient also had a radial artery
catheter inserted. One patient received a femoral artery cath-
eter but no radial artery catheter, and another patient had
radial and femoral artery catheters placed.
Approximately two-thirds of patients were male. Patients' ages
ranged from 24–84 years, with a mean age of 68 years (Table
1). Patients had various comorbid diseases, and physicians
placed pulmonary artery catheters for a variety of reasons
(Table 2).
The bias of APCO compared with ICO was 0.20 l/min. The
bias of CCO compared with ICO was 0.66 l/min.
For APCO relative to ICO, the precision was found to be ±
1.28 l/min. The precision for CCO relative to ICO was ± 1.05
l/min. The limits of agreement for APCO versus ICO were -
2.36 to +2.75 l/min, and those for CCO versus ICO were -
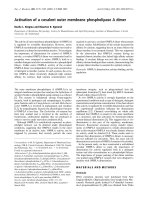
1.43 to +2.76 l/min. Figure 1 shows the distribution of the dif-
ference between cardiac output measured by APCO and ICO
plotted against the mean cardiac output determined by the
Table 1
Patient characteristics
Males (n = 55) Females (n = 29)
Mean Range
a
Mean Range
a
Age (years) 67 24–84 69 45–83
Height (cm) 174 160–185 160 148–172
Weight (kg) 88.2 60.0–150.7 69.3 41.2–112.7
Body surface area (m
2
) 2.07 1.66–2.54 1.71 1.33–2.11
Heart rate (beats per min) 86 57–116 87 57–117
Cardiac output (l/min)
b
6.2 3.1–9.2 4.6 1.7–7.5
Cardiac index (l/min/m
2
) 3.01 1.74–4.29 2.7 1.38–3.96
Stroke volume (ml) 72.2 37.7–106.8 54.4 16.1–92.8
Mean arterial pressure
(mmHg)
73.0 49.5–96.5 72.0 45.8–98.3
a
For age, height, weight, and body surface area, ranges are minimum–maximum; for heart rate, cardiac output, cardiac index, stroke volume, and
mean arterial pressure, ranges are ± 2 standard deviations.
b
Mean cardiac output as measured by arterial pressure-based cardiac output.
Table 2
Most frequent patient comorbidities and most frequent reasons for pulmonary artery catheter insertion
Patient comorbidity n (%) Reason for pulmonary artery
catheter insertion
n (%)
Systemic hypertension 48 (57) Cardiac surgery 23 (27)
Coronary artery disease 29 (34) Diagnosed cardiac disease 23 (27)
Valvular heart disease 28 (33) Volume status 21 (25)
Diabetes 27 (32) Perioperative monitoring 17 (20)
Hyperlipidemia 23 (27) Multisystem organ failure 8 (10)
Angina 22 (26) Acute heart failure 6 (7)
Arrhythmia 20 (24) Severe sepsis 4 (5)
Congestive heart failure 18 (21)
Multiple comorbidities coexist in many patients. In several patients, more than one reason was listed for pulmonary artery catheter insertion.
Critical Care Vol 11 No 5 McGee et al.
Page 4 of 7
(page number not for citation purposes)
two methods [17]. The limits of agreement and the mean dif-
ference are shown. The figure also shows CCO versus ICO
plotted in a similar fashion. The coefficient of variation for ICO
was 18%.
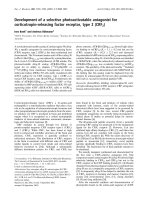
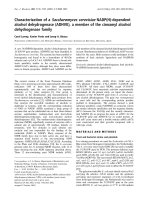
Changes in cardiac output are plotted in Figure 2. When ΔCO
was measured by APCO, 59% of the time its magnitude and
direction of change were within ± 15% of the ICO measure-
ment (Figure 2; for example, ΔCO between -15% and +15%
when measured by APCO, and ΔCO between -15% and
+15% when measured by ICO). In 96% of ΔCO determina-
tions, the APCO magnitude and direction of change were
within ± 30% of the measurement of ICO (Figure 2; for exam-
ple, ΔCO from -15% to +15% as measured by APCO, but
from -45% to -15% or from +15% to +45% as measured by
ICO). In 4% of the determinations of ΔCO, the APCO meas-
urement direction and magnitude of change differed more than
± 30% from the measurements by ICO (Figure 2). For CCO
compared with ICO, the respective percentages were 58%,
95%, and 5% for change within ± 15%, for change within ±
30%, and for change greater than ± 30%.
Discussion
Our data demonstrate that APCO covaries with ICO in a
series of critically ill patients over their initial 24 hours of ICU
monitoring. The study population included patients with car-
diac disease, multisystem organ failure, acute heart failure, and
severe sepsis, as well as patients needing postoperative mon-
itoring for cardiac surgery. Extensive data were gathered for
24 hours, comparable with studies of other methods for meas-
uring cardiac output [18-20]. Considering the limitation of the
differences in measurement techniques comparing a continu-
ous measure that gives a running average of cardiac output
over 20 seconds (APCO) versus ICO, which traditionally is
obtained with a 4-second injection, the APCO performance
was similar to the well accepted thermodilution CCO method-
ology that averages cardiac output over several minutes.
Rapid dynamic changes in cardiac output that are seen in the
clinical intensive care setting will contribute to the measure-
ment differences observed in our patients. Averaging cardiac
output over longer time periods with thermodilution CCO may
not well represent the actual dynamic variation in stroke vol-
ume (SV) and cardiac output when measured against tech-
niques that evaluate CO during shorter time intervals.
The present study is one of the largest clinical comparison
studies of cardiac output monitoring [10,16,21]. We observed
similar cardiac output measurements when comparing CCO
with ICO, consistent with previous studies [18-20,22,23];
when compared with ICO, APCO measurements appeared to
be less biased overall than CCO measurements.
The standard deviation of the difference between measure-
ment by APCO (or CCO) and ICO gives an estimate of the
precision of the APCO (or CCO) measurement compared
with the ICO measurement [15]. When comparing two imper-
Figure 1
Mean difference in cardiac output as a function of mean cardiac outputMean difference in cardiac output as a function of mean cardiac output. Mean difference in cardiac output, measured by arterial pressure-based car-
diac output (APCO) and intermittent thermodilution cardiac output (ICO) or measured by continuous cardiac output (CCO) and ICO, as a function
of mean cardiac output. The difference in cardiac output as determined by the two methods is plotted against the mean cardiac output: upper,
(APCO + ICO)/2; lower, (CCO + ICO)/2. Central solid line, mean difference; dashed lines, limits of agreement (95% confidence intervals). n = 84
patients; 561 data points.
Available online />Page 5 of 7
(page number not for citation purposes)
fect methods of measurement that each have an error distribu-
tion, the resulting error distribution (in this case) of the
differences is wider than either of the two methods' error
distributions, because overestimation by one method will
occasionally be compared with underestimation by the other.
For the measurement of cardiac output, ICO is the most widely
accepted standard. ICO typically has an error (standard devi-
ation) of 10–20% [13,18,21]; the ICO error was 18% in our
patients. In our study, the overall 'grand mean' cardiac output
over all patients by all three methods of measurement was 5.9
l/min. The observed standard deviation for the difference
between APCO measurement and ICO measurement (± 1.28
l/min) was 1.28/5.9 = 22% of the grand mean cardiac output.
The observed standard deviation for the difference between
CCO and ICO (± 1.05 l/min) was 1.05/5.9 = 18% of the
grand mean. The standard deviations for either method of con-
tinuous measurement of cardiac output observed in the
present study are consistent and similar to the ICO error on
serial measures we obtained under real ICU conditions.
Limits of agreement have been used in discussions about
comparisons of measurement methods. If 15% is the typical
precision of ICO [21], then the limits of precision (95% confi-
dence limits) are ± 30% – an error considered clinically
acceptable [18]. Two equivalent methods of measurement,
each having ± 30% limits of precision, would have limits of
agreement for their difference of ± 42%. The APCO versus
ICO agreement of ± 43% (± 2 × standard deviation/mean car-
diac output = ± 2 × 1.28/5.9) and the CCO versus ICO
agreement of ± 36% (± 2 × standard deviation/mean cardiac
output = ± 2 × 1.05/5.9) found in this study were therefore
expected. Other investigators have suggested that two equiv-
alent methods of measurement should have limits of agree-
ment for differences of 28% [18]. That conservative estimate,
however, assumed precision of 10% for the methods of meas-
urement – greater precision than generally is accepted for
thermodilution [13,18,21], and significantly better than the
18% observed in this study.
Clinical ΔCO values related to pathophysiology or treatments
determine therapy at the bedside. Between method pairs
(between APCO and ICO or between CCO and ICO), meas-
urements of ΔCO by APCO compared with ICO were either
of the same magnitude/in the same direction or were in the
same direction/of lesser or greater magnitude within an overall
± 30% difference in magnitude in 96% of the paired measure-
ments. More specifically, measurements were in the same
direction and of the same magnitude as ICO (± 15%) in 59%
of comparisons. They were dissimilar to ICO in 4% of compar-
isons. This compares favorably with CCO measurements of
ΔCO, which were in the same direction and magnitude as ICO
in 58% of comparisons, were in the same direction with ±
30% magnitude of change in 95% of comparisons, and were
disparate to ICO in 5% of comparisons. This comparison of
the magnitude and the direction of change avoids the problem
of exaggeration of inaccuracies at high values when compar-
ing absolute changes measured by two systems and at low
values when comparing relative (percentage) changes.
There are significant limitations to our study. The variability in
the reference measure of ICO is higher than generally
accepted. When comparing the continuous measures of car-
diac output with the reference standard, this variability could
allow the APCO technology to appear similar in reliability to
CCO when in fact it is not. Further data must be generated in
the controlled setting of the operating room in paralyzed
patients to clarify this issue. Assuring accurate timing of car-
diac output determination to the respiratory cycle will improve
the reliability of ICO.
In assessing a diverse group of patients with various levels of
vascular tone related to pathophysiology, vasopressors, vol-
ume status, or other therapies, it remains unclear to what
degree this may impact the determination of cardiac output
from a peripheral artery. Including patients with various
degrees of vascular tone impacted by their clinical condition
(that is, sepsis, multiorgan failure, and vasopressors) may limit
the reliability of a technique that depends on arterial waveform
analysis. Independent study of more homogeneous groups
Figure 2
Change in cardiac outputChange in cardiac output. The change in cardiac output (ΔCO) meas-
ured by intermittent thermodilution cardiac output (ICO) and by either
arterial pressure-based cardiac output (APCO) or continuous cardiac
output (CCO). ΔCO is the difference in two measurements (by one
method) of cardiac output expressed as a percentage of the mean of
those measurements. Points that fall within squares along the central
diagonal (green squares) reflect equivalent changes for the test cardiac
output measurement method (APCO or CCO) and ICO. Points that fall
within the yellow squares reflect changes of similar direction but differ-
ent magnitudes. Points that fall within white sections in the upper left
and lower right reflect non-correlated changes between the test meas-
urement method and ICO.
Critical Care Vol 11 No 5 McGee et al.
Page 6 of 7
(page number not for citation purposes)
such as severe sepsis with or without vasopressors will be
required to answer these important questions.
There are many examples of patient subgroups included in our
population that require independent validation. Patient-spe-
cific issues related to vascular compliance and tone are the
most obvious, but specific physiology, medications, and vol-
ume status may also impact on cardiac output measurement
from analysis of the arterial pulse. Simply, cardiac output per-
formance in the major shock categories warrants further inves-
tigation. The dynamic heterogeneity of our patients may limit
evaluation of cardiac output utilizing the arterial pulse via a
peripheral artery when compared with thermodilution. Studies
in homogeneous populations under similar conditions may
shed light on this issue. Other issues that would limit the utility
of arterial pressure and waveform assessment related to the
arterial pulse are limitations of the device. A high-fidelity relia-
ble arterial waveform is essential to cardiac output determined
in this manner. Significant aortic valvular disease or the pres-
ence of an intraaortic balloon pump would also be expected to
influence cardiac output using arterial waveform analysis.
Conclusion
In our patients, APCO showed acceptable bias, precision, and
measurement of cardiac output compared with ICO (the cur-
rent standard). Thermodilution CCO, utilizing a pulmonary
artery catheter, showed similar bias and precision to continu-
ous APCO when compared with ICO. APCO appears to be a
promising minimally invasive method of CCO measurement
that requires further investigation.
Competing interests
Edwards Lifesciences (Irvine, CA, USA) provided a research
grant for execution of the protocol described in Materials and
methods. WTM and JLH have received consulting fees from
Edwards Lifesciences. WTM is also on a speakers' panel for
Edwards Lifesciences. All data were collected at the four clin-
ical sites by the investigators. Edwards Lifesciences received
the electronic data for their critique of the technical aspects of
the data collection and analysis.
Authors' contributions
WTM, JLH, GJ, and GVdB were responsible for study design,
data interpretation, and drafting the manuscript. WTM, JLH,
JC, TVS and LK were responsible for data acquisition and
analysis.
Acknowledgements
The authors would like to acknowledge the research staff and bedside
nurses at the various ICUs where data collection was performed. They
gratefully appreciate the assistance of both Diane Fisher and Suzanne
Gallup for their help in preparing the manuscript.
References
1. Gonzalez J, Delafosse C, Fartoukh M, Capderou A, Straus C, Zel-
ter M, Derenne JP, Similowski T: Comparison of bedside meas-
urement of cardiac output with the thermodilution method and
the Fick method in mechanically ventilated patients. Crit Care
2003, 7:171-178.
2. Rapoport J, Teres D, Steingrub J, Higgins T, McGee W, Lemeshow
S: Patient characteristics and ICU organizational factors that
influence frequency of pulmonary artery catheterization.
JAMA 2000, 283:2559-2567.
3. Hall JB: Use of the pulmonary artery catheter in critically ill
patients: was invention the mother of necessity? JAMA 2000,
283:2577-2578.
4. Berton C, Cholley B: Equipment review: new techniques for
cardiac output measurement – oesophageal Doppler, Fick
principle using carbon dioxide, and pulse contour analysis.
Crit Care 2002, 6:216-221.
5. Chaney JC, Derdak S: Minimally invasive hemodynamic moni-
toring for the intensivist: current and emerging technology.
Crit Care Med 2002, 30:2338-2345.
6. Rhodes A, Sunderland R: Arterial pulse power analysis: the LiD-
COplus system. In Functional Hemodynamic Monitoring Edited
by: Pinsky M, Payen D. Berlin: Springer-Verlag; 2005:183-192.
7. Goedje O, Hoeke K, Lichtwarck-Aschoff M, Faltchauser A, Lamm
P, Reichart B: Continuous cardiac output by femoral arterial
thermodilution calibrated pulse contour analysis: comparison
with pulmonary arterial thermodilution. Crit Care 1999,
27:2578-2579.
8. Pratt B, Roteliuk L, Hatib F, Frazier J, Wallen R: Calculating arte-
rial pressure-based cardiac output (APCO) using a novel
measurement and analysis method. Biomed Instrum Technol
2007, 41:403-411.
9. de Vaal JB, de Wilde RB, van den Berg PC, Schreuder JJ, Jansen
JR: Less invasive determination of cardiac output from the
arterial pressure by aortic diameter-calibrated pulse contour.
Br J Anaesth 2005, 95:326-331.
10. Romano SM, Pistolesi M: Assessment of cardiac output from
systemic arterial pressure in humans. Crit Care Med 2002,
30:1834-1841.
11. Wesseling KH, Jansen JR, Settels JJ, Schreuder JJ: Computation
of aortic flow from pressure in humans using a nonlinear,
three-element model. J Appl Physiol 1993, 74:2566-2573.
12. Schmid ER, Schmidlin D, Tornic M, Seifert B: Continuous ther-
modilution cardiac output: clinical validation against a refer-
ence technique of known accuracy. Intensive Care Med 1999,
25:166-172.
13. Elkayam U, Berkley R, Azen S, Weber L, Geva B, Henry WL: Car-
diac output by thermodilution technique. Effect of injectate's
volume and temperature on accuracy and reproducibility in
the critically ill patient. Chest 1983, 84:418-422.
14. Nilsson LB, Nilsson JC, Skovgaard LT, Berthelsen PG: Thermodi-
lution cardiac output – are three injections enough? Acta
Anaesthesiol Scand 2004, 48:1322-1327.
15. Bland JM, Altman DG: Statistical methods for assessing agree-
ment between two methods of clinical measurement. Lancet
1986, i:307-310.
16. Dhingra VK, Fenwick JC, Walley KR, Chittock DR, Ronco JJ: Lack
of agreement between thermodilution and Fick cardiac output
in critically ill patients. Chest 2002, 122:990-997.
17. Bland JM, Altman DG: Comparing methods of measurement:
why plotting difference against standard method is
misleading. Lancet 1995, 346:1085-1087.
18. Critchley LAH, Critchley JAJH: A meta-analysis of studies using
bias and precision statistics to compare cardiac output meas-
urement techniques. J Clin Monit Comput 1999, 15:85-91.
19. Sun Q, Rogiers P, Pauwels D, Vincent JL: Comparison of contin-
uous thermodilution and bolus cardiac output measurements
in septic shock. Intensive Care Med 2002, 28:1276-1280.
Key messages
• APCO is a less invasive technique requiring simply an
arterial catheter and does not require calibration or cen-
tral venous access.
• APCO compares favorably with CCO methodology
using a pulmonary artery catheter when bolus intermit-
tent thermodilution is used as a reference in the ICU.
Available online />Page 7 of 7
(page number not for citation purposes)
20. Kothari N, Amaria T, Hegde A, Mandke A, Mandke NV: Measure-
ment of cardiac output: comparison of four different methods.
Ind J Thorac Cardiovasc Surg 2003, 19:163-168.
21. Stetz CW, Miller RG, Kelly GE, Raffin TA: Reliability of the ther-
modilution method in the determination of cardiac output in
clinical practice. Am Rev Respir Dis 1982, 126:1001-1004.
22. Jansen J, Schreuder JJ, Mulier J, Smith M, Settels J, Wesseling K:
A comparison of cardiac output derived from the arterial pres-
sure wave against thermodilution in cardiac surgery patients.
Br J Anaesth 2001, 87:212-222.
23. Orme RE, Pigott D, Mihm F: Measurement of cardiac output by
transpulmonary arterial thermodilution using a long radial
artery catheter. A comparison with intermittent pulmonary
artery thermodilution. Anaesthesia 2004, 59:590-594.