Báo cáo y học: " Cost-effectiveness of ranibizumab for neovascular age-related macular degeneration" pot
Bạn đang xem bản rút gọn của tài liệu. Xem và tải ngay bản đầy đủ của tài liệu tại đây (342.38 KB, 11 trang )
BioMed Central
Page 1 of 11
(page number not for citation purposes)
Cost Effectiveness and Resource
Allocation
Open Access
Research
Cost-effectiveness of ranibizumab for neovascular age-related
macular degeneration
Susan F Hurley*
1,2,3
, Jane P Matthews
1
and Robyn H Guymer
4
Address:
1
Bainbridge Consultants, 222/299 Queen St, Melbourne, VIC 3000, Australia,
2
School of Medicine, Griffith University, Australia,
3
School
of Population Health, The University of Melbourne, Australia and
4
Macular Research Unit, Department of Ophthalmology, Centre for Eye
Research Australia, The University of Melbourne, Australia
Email: Susan F Hurley* - ; Jane P Matthews - ;
Robyn H Guymer -
* Corresponding author
Abstract
Background: Intravitreal ranibizumab prevents vision loss and improves visual acuity in patients
with neovascular age-related macular degeneration, but it is expensive, and efficacy beyond 2 years
is uncertain.
Methods: We assessed the cost-effectiveness of ranibizumab compared with no ranibizumab over
10 years, using randomized trial efficacy data for the first 2 years, post-trial efficacy assumptions,
and ranibizumab acquisition costs ranging from the wholesale price ($1,950 per dose) to the price
of bevazicumab ($50), a similar molecule which may be equally efficacious. We used a computer
simulation model to estimate the probability of blindness, the number of quality-adjusted life-years
(QALYs), direct costs (in 2004 U.S. dollars), and cost-effectiveness ratios for a 67-year old woman.
Costs and QALYs were discounted at 3% per year.
Results: The probability of blindness over 10 years was reduced from 56% to 34% if ranibizumab
was efficacious for only 2 years, 27% if efficacy was maintained for a further 2 years only (base-case
scenario), and 17% if visual acuity at 4 years was then sustained. It was cost-saving under all price
assumptions, when caregiver costs were included. When caregiver costs were excluded, the cost
per QALY for the base-case ranged from $5,600, assuming the bevazicumab price, to $91,900
assuming the wholesale ranibizumab price. The cost per QALY was < $50,000 when the cost of
ranibizumab was less than $1000.
Conclusion: From a societal perspective, ranibizumab was cost-saving. From a health care funder's
perspective, ranibizumab was an efficient treatment when it cost less than $1000 per dose.
Background
Ranibizumab's efficacy has been described as miraculous
[1]. This humanized, recombinant, monoclonal antibody
fragment is the first treatment for neovascular age-related
macular degeneration that improves visual acuity. In 2
recent randomized controlled trials, MARINA (the Mini-
mally Classic/Occult Trial of the Anti-VEGF Antibody
Ranibizumab in the Treatment of Neovascular Age-
Related Macular Degeneration)[2] and the ANCHOR
study (Anti-VEGF Antibody for the Treatment of Predom-
inantly Classic Choroidal Neovascularization in Age-
Published: 24 June 2008
Cost Effectiveness and Resource Allocation 2008, 6:12 doi:10.1186/1478-7547-6-12
Received: 14 January 2008
Accepted: 24 June 2008
This article is available from: />© 2008 Hurley et al; licensee BioMed Central Ltd.
This is an Open Access article distributed under the terms of the Creative Commons Attribution License ( />),
which permits unrestricted use, distribution, and reproduction in any medium, provided the original work is properly cited.
Cost Effectiveness and Resource Allocation 2008, 6:12 />Page 2 of 11
(page number not for citation purposes)
Related Macular Degeneration) [3], it prevented vision
loss and improved visual acuity.
The availability of ranibizumab is therefore likely to trans-
form the management of neovascular macular degenera-
tion, a disease that can be blinding and is epidemic in the
developing world [1]. However, ranibizumab is expensive
[4], its monthly intravitreal dosing regimen is inconven-
ient and potentially increases the risk of bacterial endoph-
thalmitis [5], and its efficacy beyond 2 years is unknown.
Before ranibizumab was licensed in the United States,
some physicians treated patients with bevacizumab, a
similar, but much cheaper, molecule which is licensed for
the treatment of metastatic cancer of the colon or rectum
[4]. Preliminary studies of bevacizumab's efficacy in neo-
vascular macular degeneration suggest benefits similar to
those of ranibizumab [4], so its "off label" use might con-
tinue, or it might be studied in randomized controlled
clinical trials of patients with macular degeneration (and
eventually licensed for this indication if found to be effec-
tive), or the price of ranibizumab might be reduced. There
is also evidence that fewer than 24 monthly injections of
ranibizumab may be just as efficacious, and trials are
underway evaluating less frequent dosing, and variable
dosing regimens guided by visual acuity and optical
coherence tomography findings [1,5,6].
The purpose of the present analysis was to perform incre-
mental cost-effectiveness analyses of the use of ranibizu-
mab for neovascular macular degeneration. These
analyses investigated ranibizumab's efficiency in terms of
improved vision and quality of life outcomes, compared
with current standard management, and the extent to
which the initial cost of ranibizumab will be offset by sav-
ings due to prevention of vision loss.
Methods
Model Overview
We developed a Markov model using the decision analysis
software TreeAge[7] to simulate the progression of neo-
vascular age-related macular degeneration in patients in
the United States and to predict the following outcomes
associated with a ranibizumab treatment strategy and a no
ranibizumab treatment strategy (i.e. standard or usual
care): the probability of blindness, number of blind-years
(years spent blind), number of quality-adjusted life-years
(QALYs), and direct costs (excluding patient time and
travel costs) from a societal perspective and from a health
care funder's perspective in 2004 U.S. dollars. We com-
pared the 2 strategies in terms of incremental cost-effec-
tiveness ratios over time horizons of up to 10 years. Note
that in the United Kingdom, the incremental cost per
QALY would sometimes be referred to as a cost-utility
ratio. In this paper, we refer to cost per QALY, cost per case
of blindness averted and cost per blind-year averted as
cost-effectiveness ratios, an approach that is standard in
the United States.
Disease progression was characterized by a series of
annual transitions between health states, defined by the
patient's visual acuity and measured in terms of the
number of letters read by the better seeing eye on the log-
MAR chart [8]. Our model was therefore a "second eye"
model, i.e. the other ("first") eye was assumed to have
worse vision, and therefore after treatment with ranibizu-
mab QALYs accrued immediately. The 5 health states con-
sidered were referred to as 90, 75, 60, 45 and 30 letters,
and corresponded to the number of letters read being >
85, 70–80, 55–65, 40–50, and < 35, respectively. We
assumed that, each year, a patient's visual acuity would
either increase by 15 letters, remain the same, decrease by
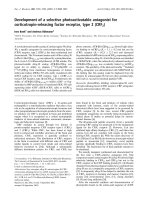
15 letters, or decrease by 30 letters. (See Figure 1 for a sim-
plified version of the model). The probabilities of these
events did not depend on the number of letters able to be
read at the start of the year. A patient was classified as
blind when they moved to the 30 letters state, correspond-
ing to a visual acuity of < 35 letters read (Snellen equiva-
lent < 20/200). In the United States, and many other
countries, legal blindness is defined as visual acuity of ≤
20/200 in the better eye with the best correction [9,10].
Our assumptions about ranibizumab's efficacy, and hence
the annual transition probabilities between health states,
were based on the results of MARINA[2], rather than the
ANCHOR trial [3], because MARINA outcomes were
reported at 2 years follow-up [2], compared to only 12
months for the ANCHOR trial [3], and, at 12 months fol-
low-up, the efficacy of ranibizumab compared to sham
injection in MARINA was virtually identical to the efficacy
of ranibizumab compared with verteporfin photody-
namic therapy assessed in the ANCHOR trial [5]. Further-
more, approximately three-quarters of patients with
neovascular macular degeneration have the type of dis-
ease studied in MARINA (minimally classic or occult
choroidal neovascularization) [2,11], compared with
one-quarter of patients who have predominantly classic
disease [11], which was studied in the ANCHOR trial [3].
In MARINA, other accepted therapies were permitted,
including verteporfin photodynamic therapy in line with
reimbursement guidelines, so our analysis compared
ranibizmab treatment with standard care without ranibi-
zumab.
Beyond the 2-year time horizon of MARINA we consid-
ered 3 hypothetical scenarios underpinned by different
assumptions about disease progression, and ranibizu-
mab's effectiveness and dosing regimen (Table 1). We
assumed that transition probabilities between visual acu-
ity health states for the no ranibizumab strategy would be
the same for all 3 scenarios. In the "base-case" ranibizu-
Cost Effectiveness and Resource Allocation 2008, 6:12 />Page 3 of 11
(page number not for citation purposes)
mab scenario we assumed that the changes in visual acuity
associated with ranibizumab in the second year of
MARINA would continue for the next 2 years, and that
patients would then develop the atrophy form of macular
degeneration [12]. We assumed that ranibizumab would
be given according to the MARINA dosing regimen[2] for
the first 2 years, then every 3 months for Years 3 and 4,
then ceased. For the "sustained-effect" scenario, we again
assumed that the effect of ranibizumab observed in the
second year of MARINA would continue for the next 2
years, but that visual acuity at the end of the 4-year time
horizon would be sustained. We assumed that ranibizu-
mab would be given less frequently than in MARINA and
for only 2 years. For the "non-sustained-effect" scenario,
we assumed that ranibizumab would be given according
to the MARINA dosing regimen for 2 years, but that it
would be ineffective beyond that time and would there-
fore be ceased and visual acuity would decline at the same
rate as in the no ranibizumab treatment strategy.
Simplified diagram of Markov tree model, which was analysed for the Ranibizumab treatment strategy and the No ranibizumab treatment strategyFigure 1
Simplified diagram of Markov tree model, which was analysed for the Ranibizumab treatment strategy and the No ranibizumab
treatment strategy.
Cost Effectiveness and Resource Allocation 2008, 6:12 />Page 4 of 11
(page number not for citation purposes)
The model also incorporated all causes mortality, the
probability of which did not vary with visual acuity.
Estimates for Model Variables
Visual acuity before treatment
The distribution of visual acuity for patients with neovas-
cular age-related macular degeneration at the time of a
decision to treat or not treat with ranibizumab was based
on the distribution of visual acuity of patients rand-
omized to treatment in the Minimally Classic/Occult Trial
of the Anti-VEGF Antibody Ranibizumab in the Treatment
of Neovascular Age-Related Macular degeneration
(MARINA), as detailed in Table 2[2].
Transition probabilities between health states
The annual probabilities of death were the estimated age-
group and sex-specific all causes mortality rates for the
United States for 2004 [13]. The annual transition proba-
bilities between the other health states were estimated
from the MARINA trial data [2]. Data for patients rand-
omized to receive 0.5 mg of ranibizumab monthly (the
dose subsequently licensed by the Food and Drug Admin-
istration) were used for the ranibizumab treatment strat-
egy, and data for patients who received the sham injection
were used for the no ranibizumab strategy.
Rosenfeld et al.[2] reported the probabilities of an
increase in visual acuity by ≥ 15 letters, a loss of < 15 let-
ters and a loss of ≥ 30 letters from baseline at 12 and 24
Table 1: Assumptions for annual transition probabilities, and ranibizumab dosing regimen
Ranibizumab treatment No ranibizumab
treatment
Base-case scenario Sustained-effect
scenario
Non-sustained-effect
scenario
Annual transition
probabilities*
Time horizon
Years 1 and 2 Results of MARINA, 0.5 mg
ranibizumab arm.
As for base-case As for base-case Results of MARINA, sham
arm.
Years 3 and 4 Year 2 MARINA data, 0.5 mg
ranibizumab arm.
As for base-case Year 2 MARINA data, sham
arm
Year 2 MARINA data, sham
arm.
Years 5 to 10 Year 5 to 10 progression rates
of the geographic atrophy
form of age-related macular
degeneration
No further transitions
(neither increasing nor
decreasing visual acuity)
Year 2 MARINA data, sham
arm, progression rates
decreasing by 40% each
year
Year 2 MARINA data, sham
arm, progression rates
decreasing by 40% each year
Ranibizumab dosing
regimen
One dose monthly for the first
2 years, then every 3 months
until end of Year 4. No
ranibizumab thereafter.
Three doses at monthly
intervals, then every 3
months until the end of
Year 2.
No ranibizumab thereafter.
One dose monthly for the
first 2 years.
No ranibizumab thereafter.
-
MARINA: Minimally Classic/Occult Trial of the Anti-VEGF Antibody Ranibizumab in the Treatment of Neovascular Age-Related Macular
Degeneration[2]
Table 2: Estimation of initial distribution of visual acuity for the model from MARINA data [2].
MARINA Model
Visual acuity* Number (%) of patients
†
Visual acuity (letters) Proportion of patients
90 0%
20/40 or better
(≥ 70 letters)
99 (13.8%) 75 14%
Better than 20/200 but worse than 20/40
(>35 but < 70 letters)*
519 (72.5%)
‡
60 36%
45 36%
20/200 or worse (≤ 35 letters) 98(13.7%) 30 14%
* The eligibility criteria for the trial required patients to have a best corrected visual acuity of between 20/40 (70 letters) and 20/320 (25 letters).
†
Data from the three treatment arms were pooled.
‡ Half the patients in this visual acuity group were assigned to the 60 letter state in the Model and half were assigned to the 45 letter state.
Cost Effectiveness and Resource Allocation 2008, 6:12 />Page 5 of 11
(page number not for citation purposes)
months. We took the probability of a 15 letter gain in vis-
ual acuity to be the probability of an increase in visual
acuity by ≥ 15 letters, and the probability of a loss of 30
letters to be the probability of a loss of ≥ 30 letters. We cal-
culated the probability of no change in visual acuity by
subtracting the probability of an increase of ≥ 15 letters
from the probability of a loss of < 15 letters, and the prob-
ability of a loss of 15 letters by subtracting the sum of the
probabilities of a loss of < 15 letters and a loss of ≥ 30 let-
ters from 1.
The annual transition probabilities for the first year were
simply the cumulative probabilities at the end of 12
months. We estimated transition probabilities for the sec-
ond year by expressing the cumulative probabilities at 24
months in terms of the cumulative probabilities at 12
months and the probabilities of gaining 15 letters or of
losing 0, 15 or 30 letters in the second year and solving the
resulting equations. The transition probabilities were
assumed to be independent of the number of letters read
at the beginning of the year.
All estimated probabilities had values between 0 and 1,
except for the estimated value of the probability of gaining
15 letters for the Sham arm which was -0.008. This value
was set to 0 and the value of the probability of losing 0 let-
ters was decreased by 0.008 for consistency. With these
revised estimates (shown in Table 3), the calculated values
of the cumulative probabilities at the end of the second
year differed from the reported values by less than 0.5%.
Annual transition probabilities between visual acuity
health states for the geographic atrophy form of age-
related macular degeneration were needed for the "base-
case" scenario (see Table 1). We assumed that each year
following a diagnosis of geographic atrophy there would
either be no change in visual acuity, a loss of 15 letters or
a loss of 30 letters, and that the probabilities of these 3
events did not depend on the number of letters able to be
read at the start of the year. For the first 4 years following
diagnosis these annual transition probabilities were esti-
mated from the natural history data reported by Sunness
et al.[14]
We combined the data from visual acuity (VA) group 1
(67 cases with VA > 20/50) and group 2 (43 cases with VA
≤ 20/50 and > 20/200). Because of the small number of
cases available, we assumed that the transition probabili-
ties would be the same in each of the first 4 years. The
cumulative percentages of eyes with visual acuity worsen-
ing by 3 or more lines (15 or more letters) after 4 years of
follow-up were obtained from Figure 2 (70% for VA group
1 and 43% for VA group 2). A weighted average of these
cumulative percentages was obtained with weights pro-
portional to the number of cases in each group, leading to
the combined estimate of 59.4%. The cumulative percent-
ages of eyes with visual acuity worsening by 6 or more
lines (30 or more letters) after 4 years of follow-up were
obtained from the text (45% for VA group 1 and 20% for
VA group 2). Again, a weighted average of this cumulative
percentage was obtained, leading to the combined esti-
mate of 34.8%. The cumulative percentage of eyes with
worsening visual acuity (VA) by 3 or more lines but not by
6 or more lines was obtained by subtraction (59.4% –
34.8% = 24.6%). The annual transition probabilities were
then obtained by expressing the cumulative probabilities
of losing 15 or 30 letters from baseline after 4 years of fol-
low-up in terms of these annual transition probabilities
and solving the resulting equations. Thus, the estimated
annual probability of losing 15 letters was 0.121 and the
estimated annual probability of losing 30 letters was
0.081.
For the subsequent years (year 5 and onwards) we
assumed that the annual transition probabilities of losing
15 or 30 letters would be reduced by 40% each year, i.e.,
the year 5 probabilities would be 60% of the year 4 prob-
abilities, and the year 6 probabilities would be 60% of the
year 5 probabilities, and so on.
Costs and utilities
We used 2 estimates for the cost of a 0.5 mg dose of ranibi-
zumab: $1,950, the wholesale acquisition price, and $50,
the maximum cost of a molar equivalent dose of bevaci-
zumab, dispensed into a syringe for intraocular use [4].
An administration cost of $250 was added to both esti-
mates [4].
Table 3: Annual transition probabilities for ranibizumab and no ranibizumab treatment strategies for first two years
Difference in number of letters read on logMAR chart at beginning and end of year
Ranibizumab treatment No ranibizumab treatment
Year 15 0 -15 -30 15 0 -15 -30
1 0.338 0.608 0.042 0.012 0.050 0.572 0.235 0.143
2 0.030 0.902 0.051 0.017 0.000 0.848 0.070 0.082
Cost Effectiveness and Resource Allocation 2008, 6:12 />Page 6 of 11
(page number not for citation purposes)
The other cost estimates and utility values for the Model
are summarized in Table 4[15-18]. We considered 3 cate-
gories of cost apart from ranibizumab: the cost of medical
care for age-related macular degeneration, the cost of
medical care attributable to vision loss, and the cost of car-
egiving by family, friends and professional carers. These
costs did not vary with the treatment strategy. The macular
degeneration medical care costs were sourced from an
analysis of Medicare files [15]. The annual cost per patient
in 2001 for 6,558 beneficiaries with wet (neovascular)
disease who did not receive photodynamic therapy was
used. Vision loss is associated with an increased risk of
falls [19]; vehicular accidents, depression and nursing
home placement [16]; and longer hospital stays [20]. We
used estimates of the excess average annual medical cost
between 1999 and 2003 for non-eye related medical care
attributable to vision loss for over 24,000 Medicare bene-
ficiaries (Table 4) [16]. Both categories of medical care
cost were converted to year-2004 U.S. dollars on the basis
of the medical care component of the Consumer Price
Index [21]. Estimates of the cost of caregiving were
sourced from a survey of 803 patients which found that
use of paid and unpaid help increased significantly as vis-
ual acuity declined, and that around 72% of assistance
was provided by the patient's spouse or family members
[17]. The hourly cost of care was valued at the June 2004
non-farm, non-supervisory seasonally adjusted wage from
the Bureau of Labour and Statistics, irrespective of
whether caregivers were paid or unpaid. Utility estimates
were based on those obtained using the time-trade off
method in a study of 81 patients with macular degenera-
tion and vision loss [18]. The transfer cost of disability
payments for patients who become blind were not consid-
ered.
Analysis
Future costs, blind-years and QALYs were discounted at
3% per year [22]. The only model parameter that varied
with gender and age was all-causes mortality. We analysed
the model for 67 and 77-year old women and men, the
mid-point of the relevant 5-year age groups, and detailed
results are presented for a 67-year old woman. Age-related
macular degeneration occurs in people aged 65 years and
over, and a new, effective treatment such as ranibizumab
is likely to be prescribed soon after symptoms lead to
diagnosis.
We first assessed effectiveness and cost-effectiveness over
the 2-year time horizon of MARINA. The 3 scenarios
underpinned by different assumptions about ranibizu-
Table 4: Estimates for cost and utility model variables
Health states (Visual acuity measured in letters read)
90 75 60 45 ≤ 30
Annual costs*
Medical care
AMD -related
†
$645 $645 $645 $645 $645
Non eye-related
‡
- - $2,288 $2,288 $3,445
Total medical care $645 $645 $2,933 $2,933 $4,090
Caregivers
§
- $795 $3,625 $14,185 $47,086
Total $645 $1,440 $6,558 $17,118 $51,176
Utility values
¶
0.89 0.89 0.81 0.57 0.52
* 2004 U.S. dollars
† AMD = age-related macular degeneration. Excluding costs of ranibizumab acquisition and administration. Source: Halpern et al.[15]
‡ Source: Javitt et al.[16]
§Source: Schmier et al.[17]
¶Source: Brown et al.[18]
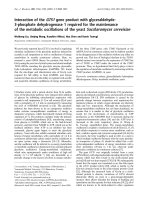
Incremental costs versus time for ranibizumab treatment compared with no ranibizumab treatment, assuming the base-case scenario and the wholesale price for ranibizumab, and including caregiver costsFigure 2
Incremental costs versus time for ranibizumab treatment
compared with no ranibizumab treatment, assuming the
base-case scenario and the wholesale price for ranibizumab,
and including caregiver costs.
Cost Effectiveness and Resource Allocation 2008, 6:12 />Page 7 of 11
(page number not for citation purposes)
mab's subsequent effectiveness and dosing regimen were
then analysed over 10 years. Analyses were conducted for
each ranibizumab acquisition cost assumption, both
including and excluding caregiver costs. For the base-case
scenario, sensitivity analyses were conducted to assess,
first, the impact of time horizons between 2 and 10 years
on the incremental cost of ranibizumab treatment includ-
ing the cost of caregiving, and, second, the impact on the
incremental cost per QALY, excluding caregiver costs, of
varying the ranibizumab acquisition cost between the 2
extremes.
Costs, QALYs and blind-years were estimated directly
from Markov cohort analyses. The probability of becom-
ing blind was estimated using Monte Carlo simulation, in
which the clinical course of 10,000 patients was simu-
lated, one at a time, over the specified time horizon.
Results
Over a 2-year period, based on MARINA results, the prob-
ability of becoming blind for a 67-year old woman was
39% without ranibizumab treatment, and was reduced to
14% with ranibizumab. Ranibizumab treatment was asso-
ciated with a decrease of 0.31 in the expected number of
blind-years and an increase of 0.118 QALYs. The QALY
gain was slightly lower for 67-year old men (0.116
QALYs) and 77-year old women (0.114 QALYs) because
of their lower life expectancy.
The costs and cost-effectiveness of ranibizumab treatment
based on these health outcomes at 2-years are summa-
rised in Table 5. When caregiver costs were included and
the ranibizumab acquisition cost was taken to be the bev-
acizumab price, ranibizumab treatment cost less than the
no ranibizumab strategy (i.e. it was dominant). When the
ranibizumab cost was assumed to be its wholesale price,
the ranibizumab strategy cost about $36,300 more than
the no ranibizumab strategy, and the incremental cost per
QALY gained was over $300,000. When caregiver costs
were excluded, the incremental cost per QALY associated
with ranibizumab treatment was $50,400 at the bevacizu-
mab price, and over $400,000 at the ranibizumab whole-
sale price. The cost-effectiveness profile was similar for 67-
year old men and 77-year olds, but cost-effectiveness
ratios were slightly higher because of reduced life expect-
ancy.
At 10 years, the cumulative probability of blindness was
56% for the no ranibizumab treatment strategy, and was
reduced to 34%, 27%, or 17% with ranibizumab under
the non-sustained-effect, base-case and sustained- effect
scenarios, respectively. The expected number of blind-
years was reduced from 3.74 to 1.61 under the base-case,
and 1.27 and 2.03, respectively, under the sustained-effect
and non-sustained-effect scenarios. The number of QALYs
was increased from 4.9 to 5.69 under the sustained-effect
scenario, 5.58 for the base-case and 5.45 for the non-sus-
tained-effect scenario.
Table 6 summarizes the cost outcomes over 10-years.
When caregiver costs were included, the ranibizumab
treatment strategy was cost saving (dominant) under all
assumptions. When caregiver costs were excluded, the
ranibizumab strategy was also dominant under the sus-
tained-effect scenario, assuming the bevacizumab price,
and cost $20,300 per QALY and $6,400 per blind-year
prevented assuming the ranibizumab wholesale price.
Under the base-case scenario, the cost per case of blind-
Table 5: Costs, incremental costs and cost-effectiveness ratios* for ranibizumab treatment compared with no ranibizumab treatment
for a 67-year old woman over the 2-year time horizon of MARINA†
Cost Cost per case of
blindness
prevented
Cost per blind-
year prevented
Cost per QALY
gained
Ranibizumab
treatment
No
ranibizumab
treatment
Difference
$$$$ $ $
Including caregiver costs
Ranibizumab cost
Wholesale price 78,900 42,700 36,300 145,400 116,500 308,400
Bevacizumab price 34,000 42,700 -8,700 Dominant
‡
Dominant Dominant
Excluding caregiver costs
Ranibizumab cost
Wholesale price 56,700 5,800 50,900 204,100 163,500 432,900
Bevacizumab price 11,700 5,800 6,000 23,800 19,000 50,400
*Costs are in 2004 U.S. dollars and were rounded. Costs, blind-years and QALYs were discounted at 3% per annum
† Rosenfeld et al.[2]
‡ Dominant: The ranibizumab treatment strategy was more effective and cost less than the no ranibizumab strategy
Cost Effectiveness and Resource Allocation 2008, 6:12 />Page 8 of 11
(page number not for citation purposes)
ness prevented varied from $13,200 to $217,700, and the
cost per QALY gained varied from $5,600 to $91,900,
depending on the ranibizumab cost. For the non-sus-
tained-effect scenario, excluding caregiver costs, the cost
of the ranibizumab strategy was lower than for the base-
case, and the cost-effectiveness ratios were therefore
slightly lower than those for the base-case. This was
because the base-case assumed 2 more years of ranibizu-
mab treatment than the non-sustained-effect scenario,
and the medical care cost savings associated with the pre-
dicted additional reduction of 0.42 blind-years was not
enough to offset the additional ranibizumab cost.
The sensitivity analysis on the analytic time horizon (Fig-
ure 2) showed that, when caregiver costs were included,
the ranibizumab treatment strategy was cost-saving
beyond 6 years, even at the wholesale price. The sensitivity
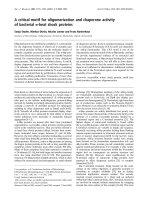
analysis on ranibizumab cost (Figure 3) showed that
ranibizumab treatment reached a threshold cost-effective-
ness of $50,000 per QALY at about $1000 per dose over
10-years, $300 per dose over 4-years and just less than $50
over a 2-year time horizon.
Discussion
From a societal perspective, the time spent by family,
friends and professionals caring for people who are blind
is relevant when evaluating a treatment that prevents
vision loss. When the costs of such caregiving were
included in this analysis, and a dose of ranibizumab was
costed at the price of bevacizumab, the ranibizumab treat-
ment strategy cost less than no treatment, even over a time
horizon of 2 years. When the cost of ranibizumab was
taken to be its current wholesale price, ranibizumab treat-
ment was cost-saving over time horizons longer than 6
years.
Table 6: Costs, incremental costs and cost-effectiveness ratios* for ranibizumab treatment compared with no ranibizumab treatment
for a 67-year old woman over a 10-year time horizon, under different treatment effectiveness and dosing scenarios.
Scenario Cost Cost per case
of blindness
prevented
Cost per blind-
year prevented
Cost per
QALY gained
Ranibizumab
treatment
No ranibizumab
treatment
Difference
$$$$$$
Base-case scenario
Including caregiver costs
Ranibizumab cost
Wholesale price 205,800 238,300 -32,500 Dominant
†
Dominant Dominant
Bevacizumab price 147,100 238,300 -91,100 Dominant Dominant Dominant
Excluding caregiver costs
Ranibizumab cost
Wholesale price 88,800 26,300 62,400 217,700 29,200 91,900
Bevacizumab price 30,100 26,300 3,800 13,200 1,800 5,600
Sustained-effect scenario
Including caregiver costs
Ranibizumab cost
Wholesale price 144,400 238,300 -93,800 Dominant Dominant Dominant
Bevacizumab price 125,500 238,300 -112,700 Dominant Dominant Dominant
Excluding caregiver costs
Ranibizumab cost
Wholesale price 42,200 26,300 15,900 41,100 6,400 20,300
Bevacizumab price 23,300 26,300 -3,000 Dominant Dominant Dominant
Non-sustained-effect
scenario
Including caregiver costs
Ranibizumab cost
Wholesale price 209,800 238,300 -28,500 Dominant Dominant Dominant
Bevacizumab price 164,800 238,300 -73,500 Dominant Dominant Dominant
Excluding caregiver costs
Ranibizumab cost
Wholesale price 74,000 26,300 47,700 218,600 27,900 86,900
Bevacizumab price 29,100 26,300 2,700 12,500 1,600 5,000
*Costs are in 2004 U.S. dollars and were rounded.
Costs, blind-years and QALYs were discounted at 3% per annum
† Dominant: Ranibizumab treatment was more effective and cost less than the no ranibizumab strategy
Cost Effectiveness and Resource Allocation 2008, 6:12 />Page 9 of 11
(page number not for citation purposes)
Many health care funders will, however, make decisions
about the provision of ranibizumab from the perspective
of their own organisation, and will not consider the cost
of non-medical care for people with poor visual acuity.
When caregiver costs were excluded from our analyses,
ranibizumab treatment was cost-saving at 10-years under
only one set of assumptions: sustained-effectiveness,
administration of ranibizumab less frequently for only 2
years, and the ranibizumab cost equal to the bevacizumab
price (Table 6). However, treatments do not have to be
cost-saving to be considered "cost-effective". Although
there is no universally accepted threshold cost-effective-
ness ratio below which an intervention is viewed as cost-
effective, Britain's National Institute for Health and Clini-
cal Excellence (NICE), for example, is increasingly likely
to reject technologies on the basis of cost-ineffectiveness
when their cost per QALY is between US$30,000 and
US$45,900 (between approximately £20,000 and
£30,000 per QALY) [23]. This suggests that NICE defi-
nitely regards interventions with cost-effectiveness ratios
of less than $30,000 per QALY as cost-effective, and may
regard those with ratios between $30,000 and around
$50,000 per QALY as cost-effective. In contrast, Murray et
al. recently defined "very cost-effective" interventions as
those that gain each year of healthy life at a cost less than
the gross domestic product (GDP) per head, and "cost-
effective" interventions as those that gain a year of healthy
life at a cost of between one and 3 times GDP per head
[24]. Murray and colleagues' analysis was based on disa-
bility-adjusted life-years (DALYs), which are similar, but
not identical, to QALYs [25]. Nevertheless, some infer-
ences about the "cost-effectiveness" of ranibizumab can
be made on the basis of Murray et al.'s analysis. The GDP
per person in the U.S. was $43,500 in 2006 [26]. Ranibi-
zumab could therefore be regarded as very cost-effective
when its cost per QALY was less than about $50,000, and
cost effective when this ratio was less than about
$130,000. At the 10-year time horizon, ranibizumab
could therefore be regarded as cost-effective according to
Murray and colleagues' criteria, but would be unlikely to
be recommended by NICE if the price per dose was greater
than about $1,000.
Detsky and Laupacis recently drew attention to specula-
tion that the identification of threshold cost-effectiveness
ratios for funding could encourage drug companies to
charge a price that achieves that ratio, even if the drug
could be sold profitably at a lower price [27]. However,
our results could in fact be used by funding agencies in the
United States to determine the price at which ranibizu-
mab falls below their own cost-effectiveness threshold for
funding (see Figure 3), and to underpin price negotiations
with the manufacturer. An alternative approach to imple-
menting cost-effective treatment for neovascular age-
related macular degeneration would be to conduct a ran-
domized controlled trial of bevazicumab relative to
ranibizumab. A UK-based economic analysis used model-
ling to determine the efficacy profile bevazicumab would
need to have to be regarded as cost-effective [28]. This
approach is likely to take far longer than price negotia-
tions for ranibizumab.
NICE did in fact conduct an appraisal of ranibizumab for
neovascular age-related macular degeneration, which
included an independent economic evaluation [29]. This
evaluation used the United Kingdom price of £761.20 for
a ranibizumab injection, which, when converted to US
dollars on the basis of the Gross Domestic Product Pur-
chasing Power Parity [30], is about 60% of the US whole-
sale price. Other costs were derived largely from clinical
guidelines and discussions with specialists. The evalua-
tion's estimate for the annual cost of medical, community
and residential care for a patient who becomes blind was
only one-fifth of the cost estimate derived from US expe-
rience that we used in our study. NICE recommended
ranibizumab for the treatment of all forms of neovascular
age-related macular degeneration included on its market-
ing authorisation, under specified clinical conditions, and
provided the cost of treatment beyond 14 injections is met
by ranibizumab's manufacturer. The incremental cost-
effectiveness ratio for ranibizumab treatment of mini-
mally classic or occult no classic lesions, over a 10 year fol-
low-up period and assuming only 14 injections are
Incremental cost per QALY versus ranibizumab price for 3 time horizons, assuming the base-case scenarioFigure 3
Incremental cost per QALY versus ranibizumab price for 3
time horizons, assuming the base-case scenario.
Cost Effectiveness and Resource Allocation 2008, 6:12 />Page 10 of 11
(page number not for citation purposes)
administered was £19,904 per QALY, which is consistent
with the thresholds outlined above.
Our analysis had a US context. It was underpinned by the
results of a high quality randomized trial [2], US cost data
from the Medicare files [15,16], caregiver cost and utility
data from US studies of patients with macular degenera-
tion [17,18], and explicit assumptions about dosing regi-
mens and post-trial efficacy. We did not include adverse
events associated with ranibizumab in our model as none
occurred with increased frequency in MARINA[2] or the
ANCHOR study [3]. However, an analysis of combined
data from the 2 trials suggested that ranibizumab
increased the risk of nonocular hemorrhage [31], and this
possibility is being monitored in a long-term extension
study and ongoing trials [32]. All patients in both trials
received intravitreal injections, but serious uveitis
occurred in only 7 of the 1,139 patients (0.6%)[2,3]
Including this very rare event in the model would not
impact predicted health or cost outcomes. Similarly, any
disutility associated with the intravitreal injections, for
example due to pain, was not considered because the
duration of the injections and any consequential decrease
in the utility of life was too small to have any impact on
the cost-effectiveness ratios.
Beyond 2 years, our model was based on 3 sets of assump-
tions about treatment effectiveness and dosing, as trial
data were unavailable. In contrast, the independent eco-
nomic evaluation commissioned by NICE [33], and the
bevazicumab modelling study by Raftery and col-
leagues[28] assumed that after a two-year ranibizumab
treatment period visual acuity would decline at the same
rate as observed in the control group. Each of the three
scenarios we modelled is likely to reflect the experience of
at least some patients. Data from ongoing studies will
clarify the average long-term outcomes of ranibizumab
therapy.
Conclusion
Notwithstanding the uncertainty about long-term out-
comes, our study demonstrated that over a 10-year time
horizon, under all plausible assumptions, ranibizumab
was cost-saving from a societal perspective. From a health
care funder's perspective, ranibizumab was cost-effective
over a 10-year time horizon when it cost $1000 per dose
or less (about half the current wholesale price). Ranibizu-
mab would be cost-effective at a higher price in settings
where cost-effectiveness ratios higher than $50,000 per
QALY were regarded as acceptable.
Competing interests
The authors declare that they have no competing interests.
Associate Professor Guymer has been an investigator on
clinical trials funded by Novartis Australia. This study was
carried out completely independently of Novartis. We did
not inform Novartis that it was being conducted and they
did not provide any funding.
Authors' contributions
All authors participated in designing the study. SFH
sourced the data, JPM programmed and ran the Markov
model, SFH drafted the manuscript, and all authors par-
ticipated in critically revising the manuscript and
approved the final version.
Acknowledgements
We thank Dr Jamie La Nauze, MBBS, FRANZCO, for review of the manu-
script and advice about the management of age-related macular degenera-
tion.
This project was supported by a grant from the Cancer Council Victoria,
through funding from the Victorian Health Promotion Foundation. The
funding body had no role in the design and conduct of the study, in the col-
lection, analysis and interpretation of the data, or in the preparation, review
or approval of the manuscript.
References
1. Stone EM: A very effective treatment for neovascular macular
degeneration. N Engl J Med 2006, 355:1493-1495.
2. Rosenfeld PJ, Brown DM, Heier JS, Boyer DS, Kaiser PK, Chung CY,
Kim RY: Ranibizumab for neovascular age-related macular
degeneration. N Engl J Med 2006, 355:1419-1431.
3. Brown DM, Kaiser PK, Michels M, Soubrane G, Heier JS, Kim RY, Sy
JP, Schneider S: Ranibizumab versus verteporfin for neovascu-
lar age-related macular degeneration. N Engl J Med 2006,
355:1432-1444.
4. Steinbrook R: The price of sight - ranibizumab, bevacizumab,
and the treatment of macular degeneration. N Engl J Med
2006, 355:1409-1412.
5. Rosenfeld PJ, Rich RM, Lalwani GA: Ranibizumab: Phase III clini-
cal trial results. Ophthalmol Clin North Am 2006, 19:361-372.
6. Fung AE, Lalwani GA, Rosenfeld PJ, Dubovy SR, Michels S, Feuer WJ,
Puliafito CA, Davis JL, Flynn J, Esquiabro M: An Optical Coherence
Tomography-Guided, Variable Dosing Regimen with Intrav-
itreal Ranibizumab (Lucentis) for Neovascular Age-related
Macular Degeneration. Am J Ophthalmol 2007, 143:566-583.
7. TreeAge Pro 2006 User's Manual Williamstown, MA, TreeAge Software
Inc; 2006.
8. Hussain B, Saleh GM, Sivaprasad S, Hammond CJ: Changing from
Snellen to LogMAR: debate or delay? Clin Experiment Ophthalmol
2006, 34:6-8.
9. Key Definitions for Statistical Terms 2007 [ />Section.asp?SectionID=15&DocumentID=1280].
10. Meads C, Salas C, Roberts T, Moore D, Fry-Smith A, Hyde C: Clini-
cal effectiveness and cost-utility of photodynamic therapy
for wet age-related macular degeneration: a systematic
review and economic evaluation. Health Technol Assess 2003,
7:v-98.
11. Olsen TW, Feng X, Kasper TJ, Rath PP, Steuer ER: Fluorescein ang-
iographic lesion type frequency in neovascular age-related
macular degeneration,. Ophthalmology 2004, 111:250-255.
12. de Jong PTVM: Mechanisms of disease: age-related macular
degeneration. N Engl J Med 2006, 355:1474-1485.
13. Miniño AM, Heron M, Murphy SL, Kochanek KD: Deaths: Final
Data for 2004. National Center for Health Statistics; 2006.
14. Sunness JS, Gonzalez-Baron J, Applegate CA, Bressler NM, Tian Y,
Hawkins B, Barron Y, Bergman A: Enlargement of atrophy and
visual acuity loss in the geographic atrophy form of age-
related macular degeneration. Ophthalmology 1999,
106:1768-1779.
15. Halpern MT, Schmier JK, Covert D, Venkataraman K: Resource uti-
lization and costs of age-related macular degeneration.
Health Care Financ Rev 2006, 27:37-47.
Publish with Bio Med Central and every
scientist can read your work free of charge
"BioMed Central will be the most significant development for
disseminating the results of biomedical research in our lifetime."
Sir Paul Nurse, Cancer Research UK
Your research papers will be:
available free of charge to the entire biomedical community
peer reviewed and published immediately upon acceptance
cited in PubMed and archived on PubMed Central
yours — you keep the copyright
Submit your manuscript here:
/>BioMedcentral
Cost Effectiveness and Resource Allocation 2008, 6:12 />Page 11 of 11
(page number not for citation purposes)
16. Javitt JC, Zhou Z, Willke RJ: Association between vision loss and
higher medical care costs in Medicare beneficiaries: costs are
greater for those with progressive vision loss. Ophthalmology
2007, 114:238-245.
17. Schmier JK, Halpern MT, Covert D, Delgado J, Sharma S: Impact of
visual impairment on use of caregiving by individuals with
age-related macular degeneration. Retina 2006, 26:1056-1062.
18. Brown GC, Sharma S, Brown MM, Kistler J: Utility values and age-
related macular degeneration. Arch Ophthalmol 2000, 118:47-51.
19. Legood R, Scuffham P, Cryer C: Are we blind to injuries in the
visually impaired? A review of the literature. In Inj Prev Volume
8. British Medical Association; 2002:155-160.
20. Morse AR, Yatzkan E, Berberich B, Arons RR: Acute care hospital
utilization by patients with visual impairment. Arch Ophthalmol
1999, 117:943-949.
21. U.S. Medical Care. Consumer Price Index 2007 [http://
www.bls.gov/data/home.htm].
22. Cost-effectiveness in health and medicine Edited by: Gold MR, Siegel JE,
Russell LB and Weinstein MC. New York, Oxford University Press;
1996.
23. Pearson SD, Rawlins MD: Quality, innovation, and value for
money. NICE and the British National Health Service. JAMA
2005, 294:2618-2622.
24. Murray CJL, Lauer JA, Hutubessy RCW, Niessen L, Tomijima N,
Rodgers A, Lawes CMM, Evans DB: Effectiveness and costs of
interventions to lower systolic blood pressure and choles-
terol: a global and regional analysis on reduction of cardio-
vascular-disease risk. In The Lancet Volume 361. Issue 9359 The
Lancet Publishing Group, a division of Elsevier Science Ltd.;
2003:717-725.
25. Sassi F: Calculating QALYs, comparing QALY and DALY cal-
culations. Health Policy Plan 2006, 21:402-408.
26. The World Factbook 2007 [ />factbook/geos/us.html].
27. Detsky AS, Laupacis A: Relevance of Cost-Effectiveness Analy-
sis to Clinicians and Policy Makers. JAMA 2007, 298:221-224.
28. Raftery J, Clegg A, Jones J, Tan SC, Lotery A: Ranibizumab (Lucen-
tis) versus bevacizumab (Avastin): modelling cost effective-
ness. Br J Ophthalmol 2007, 91:1244-1246.
29. Final appraisal determination. Ranibizumab and pegaptanib
for age-related macular degeneration. 2008 [http://
www.nice.org.uk/guidance/index.jsp?action=download&o=40254].
30. GDP PPPs and Derived Indices for all OECD countries 2008
[ />0,3343,en_2649_34357_36202863_1_1_1_1,00.html].
31. Gillies MC, Wong TY: Ranibizumab for neovascular age-related
macular degeneration [letter]. N Engl J Med 2007, 356:748-750.
32. Rosenfeld PJ, Brown DM, Schneider S: Ranibizumab for neovascu-
lar age-related macular degeneration [authors' reply]. N Engl
J Med 2007, 356:749-750.
33. Colquitt JL, Jones J, Tan SC, Takeda A, Clegg AJ, Price A: Ranibizu-
mab and pegaptanib for the treatment of age-related macu-
lar degeneration: a systematic review and economic
evaluation. Southampton Health Technology Assessments Centre 2007
[ />bAssessmentReport.pdf].