Báo cáo y học: "Cost-effectiveness of a pressure ulcer quality collaborative" pot
Bạn đang xem bản rút gọn của tài liệu. Xem và tải ngay bản đầy đủ của tài liệu tại đây (928.4 KB, 13 trang )
Makai et al. Cost Effectiveness and Resource Allocation 2010, 8:11
/>Open Access
RESEARCH
© 2010 Makai et al; licensee BioMed Central Ltd. This is an Open Access article distributed under the terms of the Creative Commons
Attribution License ( which permits unrestricted use, distribution, and reproduction in
any medium, provided the original work is properly cited.
Research
Cost-effectiveness of a pressure ulcer quality
collaborative
Peter Makai*, Marc Koopmanschap, Roland Bal and Anna P Nieboer
Abstract
Background: A quality improvement collaborative (QIC) in the Dutch long-term care sector (nursing homes, assisted
living facilities, home care) used evidence-based prevention methods to reduce the incidence and prevalence of
pressure ulcers (PUs). The collaborative consisted of a core team of experts and 25 organizational project teams. Our
aim was to determine its cost-effectiveness from a healthcare perspective.
Methods: We used a non-controlled pre-post design to establish the change in incidence and prevalence of PUs in 88
patients over the course of a year. Staff indexed data and prevention methods (activities, materials). Quality of life (Qol)
weights were assigned to the PU states. We assessed the costs of activities and materials in the project. A Markov
model was built based on effectiveness and cost data, complemented with a probabilistic sensitivity analysis. To
illustrate the results of longer term, three scenarios were created in which change in incidence and prevalence
measures were (1) not sustained, (2) partially sustained, and (3) completely sustained.
Results: Incidence of PUs decreased from 15% to 4.5% for the 88 patients. Prevalence decreased from 38.6% to 22.7%.
Average Quality of Life (Qol) of patients increased by 0.02 Quality Adjusted Life Years (QALY)s in two years; healthcare
costs increased by €2000 per patient; the Incremental Cost-effectiveness Ratio (ICER) was between 78,500 and 131,000
depending on whether the changes in incidence and prevalence of PU were sustained.
Conclusions: During the QIC PU incidence and prevalence significantly declined. When compared to standard PU
care, the QIC was probably more costly and more effective in the short run, but its long-term cost-effectiveness is
questionable. The QIC can only be cost-effective if the changes in incidence and prevalence of PU are sustained.
Background
A pressure ulcer (PU) is a preventable condition that
affects patients with impaired mobility, especially the
elderly [1]. PUs are classified from grades 1 to 4, or least
to most severe. The average prevalence of PUs in the
Netherlands is 7.9% in assisted living homes and 18.3% in
nursing homes [2]. Incidence varies between 2.9% and
4.5% in intensive care [3]. No incidence data are available
for the Dutch long-term care sector. The probability of
healing within 90 days varies with severity: 67% (grade 2),
44% (grade 3) and 32% (grade 4) [4]. PUs can interfere
with recovery, cause pain and infection [1], and increase
mortality (OR = 1.4 after adjusting for risk factors) [5].
According to a study by Franks [6] the quality of life of PU
patients is no worse than the general population of nurs-
ing home patients; a study by Fleurence, [7] however,
claims that PUs decrease quality of life. The treatment of
PUs costs between € 89 million and 1.9 billion, or 0.1% to
1% of total Dutch healthcare costs [8,9]. Because they are
preventable, it is safe to say that PUs should not occur in
the first place.
Preventable conditions requiring a common and per-
haps demanding treatment like PUs are likely candidates
for Quality Improvement Collaboratives (QICs), [10,11],
in which different healthcare organizations address a cer-
tain problem by implementing specific solutions and
sharing the results [12]. A QIC program team includes
experts in both the health condition and methods of qual-
ity improvement. According to a recent systematic
review, QICs have shown moderate effectiveness in terms
of patient outcomes [10] and several studies suggest
effectiveness of QICs for PUs in particular [13,14].
Despite the popularity of QIC's, the cost-effectiveness of
* Correspondence:
1
Department of Health Policy and Management, Erasmus University
Rotterdam, the Netherlands
Full list of author information is available at the end of the article
Makai et al. Cost Effectiveness and Resource Allocation 2010, 8:11
/>Page 2 of 13
QICs is rarely considered [10], in fact only a study by
Huang addressed this aspect [15].
This is not surprising, since the costs of quality
improvement projects are not well established, and orga-
nizations generally do not or cannot assess the benefits of
participation [16]. There are currently no published stud-
ies on the cost-effectiveness of a PU QIC in particular.
Several studies have been published on the cost-effective-
ness of the materials for PU treatment and prevention
[7,17-19], and the one study we found that focused on
labor costs [20] considered only nurse staffing time and
disregarded preventive activities. We did identify a cost-
effectiveness study on a PU quality improvement project
[21], but it did not involve a QIC. This study adds to the
literature by giving a detailed account of the PU sub-pro-
gram of the "Care for Better" QIC, a Dutch healthcare
collaborative[22]. The aim of this article is to answer the
question: Was this PU QIC cost-effective when compared
to standard PU care?
Methods
Design
Our study was conducted from a healthcare perspective,
considering both direct costs of PU care and costs of the
QIC for a period of one year. A prospective pre-post
design was used with one-month measurement periods
to collect data on costs and effectiveness. We established
cost effectiveness by comparing data at the end of the
project year to standard care (i.e., the state of the sample
before the QIC intervention). We built a Markov model
to establish standard care (i.e. simulate a control group),
and to determine the effect of the collaborative after a
year. To extrapolate results to one additional year, we
have expanded this model. Probabilistic sensitivity analy-
sis was applied to treat uncertainty in the model parame-
ters. QALYs and ICERs were calculated for a two year
period (project year and extrapolated year).
Setting
The Care for Better QIC operates in the Dutch long term
care sector (nursing homes, residential care homes, and
home care). This study is limited to nursing and residen-
tial homes. Patients are not admitted with PU as a main
condition, but have underlying chronic conditions affect-
ing their daily functioning. The nursing home patients
typically stay in the facilities for two to three [23,24] years
until death, and are seldom discharged.
Description of the Collaborative
The overall goal of the Care for Better PU QIC was to
reduce the prevalence and incidence of PUs by 50% in 25
participating organizations over the course of a year by
increasing evidence-based preventive measures and
decreasing non-useful preventive measures (table 1) [1],
thereby reducing the need for treating PUs. The project
was implemented in three consecutive rounds because
not all 25 organizations could be accommodated by the
Care for Better PU QIC at one time.
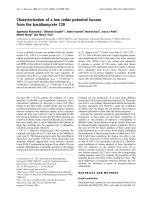
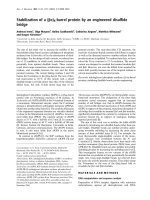
The Care for Better PU QIC carried out activities on
three intertwining levels: program, organizational, and
departmental (figure 1). The program level consisted of a
core team of experts who guided the organizations' proj-
ect teams, defined the collaborative's goals, and orga-
nized three "learning sessions" during the year at which
project teams could be taught about quality improvement
methods and preventive nursing measures, and share
their results with the other teams. Between the learning
sessions, the core team of experts provided project teams
with coaching.
The participating organizations formed project teams
who attended the learning sessions and were the effective
drivers of the implementation in pilot departments of the
organizations. Project teams had considerable freedom in
the type of preventive nursing measures implemented
and how they were applied, but were encouraged by the
experts to formulate SMART (Specific Measureable
Attainable Realistic Timely) goals and to work with PDSA
(Plan Do Study Act) cycles between the learning sessions.
The PDSA cycles began with "action plans" followed by
introducing new interventions at the departmental level.
Periodic measurement of results were documented. At
the end of the cycle, the new interventions were meant to
be used in the entire organization, and meant to be incor-
porated into the work of professionals. In this manner,
successful teams standardized the new interventions and
made changes permanent. In addition it was expected
from the teams that they learn methods of continuous
quality improvement, in other words teams were meant
to continue working with the PDSA cycle after the QIC
program was finished.
During the one-month measurement periods preceding
the learning sessions, project teams registered 18 differ-
ent preventive measures carried out by caregivers, as well
as the prevalence, incidence and severity of the PUs.
These registrations consisted of 12 measurement
moments, measuring every patient on the pilot depart-
ment every two to three days. The first measurement was
conducted end October to end November 2006 or from
beginning of November to the beginning of December
depending on the institution. The intermittent measure-
ment period was in June, and the last measurement
period was in November 2007. The measurements were
organized by the Dutch National Expertise Center for
Nursing and Caring, and were carried out by the project
teams themselves.
Case-selection and study population
To capture possible learning effects over the course of the
year, data was used from the third round. A total of seven
Makai et al. Cost Effectiveness and Resource Allocation 2010, 8:11
/>Page 3 of 13
Table 1: Patient characteristics, outcomes and changes in process
Non-selected patients Selected patients
Number of patients 254 88
BMI (average) 26 26 (5)
Age (average) 80 82
Females (average) 169 (67%) F 60 (68%) F
Patients at risk of pressure ulcers (average) 254 (100%) 88 (100%)
Comparison of clinical effects Baseline Baseline After
Prevalence
Grade 1 50 (20%) 21 (23.9%) 16 (18.2%)
Grade 2 9 (3.5%) 10 (11.4%) 2 (2.3%)
Grade 3 3 (1.2%) 1 (1.1%) 1 (1.1%)
Grade 4 5 (2%) 2 (2.3%) 1 (1.1%)
Total 59 (27%) 34 (38.6%) 20 (22.7%)*
Incidence (1 month)
Grade 1 19 (7%) 10 (14.7%) 4 (4.5%)
Grade 2 6 (3%) 3 (3.4%) 0 (0%)
Total 25 (9%) 13 (15%) 4 (4.5%)*
Useful interventions
Risk assessment 254 (100%) 88 (100%) 88 (100%)
Using a 30-degree side to side turn at least every 4 hours 24 (9%) 7 (8%) 9 (10%)
Preventive mattress 78 (30%) 24 (27%) 40 (45%)**
Involving patients in prevention 41 (16%) 3 (3%) 7 (8%)
Involving family/friends/caregivers in prevention 26 (10%) 3 (3%) 9 (11%)
Reactivation and mobilization by paramedics 10 (4%) 3 (3%) 11 (13%)
Smearing of the skin in case of incontinence 30 (11%) 8 (9%) 9 (11%)
Assessing nutritional state and preventing nutritional deficiency 13 (5%) 12 (14%) 4 (5%)
Inserting a catheter to prevent maceration of the skin 3 (1%) 1 (1%) 1 (1%)
Ensuring a clean, dry and square lower layer of bedclothes 52 (20%) 8 (9%) 12 (14%)
Makai et al. Cost Effectiveness and Resource Allocation 2010, 8:11
/>Page 4 of 13
departments in three different organizations were inves-
tigated in detail. The following criteria were used to select
cases:
1. Data was available for both first and last measure-
ment period.
2. At least one department had a low initial PU preva-
lence, at least one department had an average PU
prevalence, and at least one department had a high
PU prevalence.
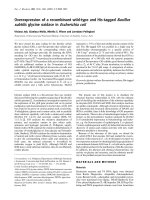
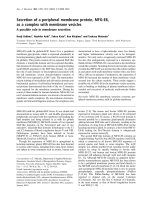
Using this criteria, 88 patients were selected - ranging
from 9-19 per department - to determine cost-effective-
ness (figure 2). Their characteristics compared to the
non-selected cases in the third round are described in
table 1. To determine the representativeness of the
selected cases vis-à-vis the entire patient population, we
compared the 88 patients' risk for PUs, age, sex, and BMI
to the non-included patients in round three of the project
using ANOVA at baseline.
Determination of effectiveness
We used effectiveness data on the prevalence and inci-
dence of PUs collected by the organizational project
teams. Prevalence was computed by averaging the num-
ber of patients with PU divided by 88 over the whole
measurement month. Incidence was computed as the
number of new PU cases during the measurement month
divided by 88. To determine effectiveness, we compared
the before- and after-project PU prevalence and inci-
dence of the 88 patients using a t-test.
Assessment of costs
Cost data associated with the project and the prevention
and treatment of PUs were collected for the central activ-
ities on the program level, the project activities within the
organizations, and the individual treatment of patients
(departmental level). Identification and valuation of costs
are displayed in table 2.
Program and organizational
Program costs were obtained from the central project
budget. Items included expected project time, lump sums
for materials, and miscellaneous costs. To ascertain orga-
nizational level costs, the organizations' project leaders
supplied us with detailed plans and reports. They also
furnished the individual amounts of time invested in the
project by the teams and other employees for various
activities (training, participation in learning sessions,
writing plans, project implementation). To establish the
project costs, we multiplied the number of hours spent
Non-useful interventions
Smearing the skin (with topical agents) to prevent disturbance in blood
supply caused by pressure
50 (20%) 23 (26%) 6 (7%)*
Massage 3 (4%) 0 (0%) 2 (2%)
Using a 90-degree side to side turn at least every 4 hours 2 (1%) 0 (0%) 3 (4%)
*P < 0.05
**p < 0.005
Table 1: Patient characteristics, outcomes and changes in process (Continued)
Figure 1 The structure of the collaborative. Figure 2 Selection process of the 88 patients.
Makai et al. Cost Effectiveness and Resource Allocation 2010, 8:11
/>Page 5 of 13
Table 2: Activities of caregivers and treatment material used
Program level Amount
Labor Program activities (project design,
expert meetings, recruitment,
organizing working conferences,
mid-term report, final report etc.)
Program experts 4696 hours
Program support Program experts 635 hours
Knowledge management
(publications, etc)
Program experts 175 hours
Materials Lump sum
Other costs Lump sum
Organizational level Average
Labor Project activities (coordinating the
project, writing action plans,
reports, etc.)
Project leader 8 hours (per week)
Clinical level project
implementation
Project member 2 hours (per week)
Learning session participation - Project leader - 2 Project members 76 hours (total each)
Staff knowledge testing - Nurses - Caregivers 30 min (total each)
Caregiver training - Specialized nurse - Caregivers 3.5 hours (total each)
Specialist training Nurses 8 hours (total each)
Project meetings - Project member - Nurses - Caregivers 8 hours (total each)
Measurements Nurses 1 hour (per month)
Departmental level Average/day/patient
Useful interventions Risk assessment Nurses 10 sec
30-degree side turn at least every 4
hours
Caregivers 35 min
Involving patients in prevention Nurses 2 sec
Involving family/friends/caregivers
in prevention
Nurses 0.4 sec
Makai et al. Cost Effectiveness and Resource Allocation 2010, 8:11
/>Page 6 of 13
Reactivation and mobilization by
paramedics
Paramedics 4 min
Smearing the skin with topical
agents in case of incontinence
Caregivers 2 min
Assessing nutritional state and
preventing nutritional deficiency
Caregivers 4 min
Inserting a catheter to prevent
maceration of the skin
Caregivers 3 min
Non-useful interventions Ensuring a clean, dry and square
lower layer of bedclothes
Caregivers 7 min
Smearing the skin (with topical
agents) to prevent disturbance in
blood supply caused by pressure
Caregivers 2 min
Massage Caregivers 1 min
90-degree side turn at least every 4
hours
Caregivers 30 min
Usual treatment grades 1-2 Caregivers 7 min
Usual treatment grades 3-4 Caregiver 15 min
Materials Type Number/patient
Basic mattress Start 1
Mattress (grades 1-2) SLK 1 1
Mattress (grades 1-2) Dionica 1
Mattress (grades 3-4) SLK 2 1
Mattress (grades 3-4) Duo-care 1
Mattress (grades 3-4) Quatro-care 1
Pillow (prevention) Foam pillow 1
Pillow (grades 1-2) Normal PU pillow 1
Pillow (grades 3-4) ROHO 1
Table 2: Activities of caregivers and treatment material used (Continued)
Makai et al. Cost Effectiveness and Resource Allocation 2010, 8:11
/>Page 7 of 13
on the project by the average hourly wages of the project
team members.
Departmental
We used project documentation to identify the before-
and after-project differences in PU preventive measures
and the number of mattresses and pillows used. The type
of mattresses and pillows were taken from the organiza-
tions' treatment protocols; their rental rates were col-
lected from the suppliers of the organizations (table 3).
Since other materials used for PU care (creams, dressings,
and the like) were not reliably administered, we assumed
they did not change during the project. Studies have also
shown these costs to be marginal compared to the total
cost of care [9]. We also didn't account for changes in
organizational overhead costs, because the changes all
took place in the departments themselves, and had no
effect on other parts of the organizations. Time spent by
staff on activities related to preventive care was collected
through interviews with project members, who were
asked to give an average, minimum, and maximum value
for each preventive measure. In the context of an average
long-term care stay of 2.8 years [25], with 66% remaining
until death [26], we assumed that PUs do not cause extra
days of care. We computed the cost of personnel at the
departmental level by multiplying the time spent on PU
care by the hourly wage of caregivers in the organizations.
We used the wage schedule of the 2006 collective agree-
ment of Dutch nursing home employees [27].
To compute an overall cost per patient value, the cost of
the collaborative was evenly allocated to the participating
project teams. Organizational level costs were evenly
allocated to the patients. Average daily costs were com-
puted per patient per disease state and converted into
monthly values.
Decision Analytical Model
To determine the effect of the collaborative compared to
standard care after a full year, we have built a decision-
analytical model (Markov model) based on our data from
the collaborative to simulate standard care (i.e. control
group). In building the model we have used the method
outlined by [28]. The model had health states consisting
of no PU, single PUs grades 1-4, and multiple PUs grades
1-4. For the first year (when the collaborative ran), we
used two sets of transition probabilities: one for the simu-
lated control-group, and one for the intervention group.
To establish standard care, we converted incidence and
PU healing during the first measurement month into
monthly transition probabilities, giving a simulation
under the assumption there was no collaborative. With
the intervention group we based transition probabilities
on the events of the first year (based on the data from the
first and last measurement month) and we transformed
these yearly transition probabilities into monthly transi-
tion probabilities. This monthly modeling was necessary
to give a more precise change in effects and costs over
this first year, and to make the two simulations compara-
ble. Both arms of the model were run 12 times to simulate
a one-year program.
To extrapolate the results for an additional year, we also
included mortality in the model by introducing a death
state into the model, and using the average mortality of
nursing home patients in the Netherlands [29] as a transi-
tion probability. The simulated control-group thus con-
sisted of no PU, single PUs grades 1-4, and multiple PUs
grades 1-4 and death, with the transition probabilities
adjusted accordingly. The intervention group, - in addi-
tion to a death state - three scenarios were created: total
sustainability, partial sustainability and no sustainability.
In the total sustainability scenario, we have assumed that
the process has the same dynamic as during the first year.
In the middle scenario, we have assumed that the
dynamic is broken, but the new measures are sustained,
as well as the achieved results. In the no sustainability
scenario, we assumed that the improvement is slowly
reversed, therefore we have used the inverse transition
matrix of the first year.
In order to get an idea if such a collaborative are worth
financing, it is important to place it in the context of a
policy decision environment, to allow a tradeoff between
costs and QUALY-s. Quality of life (Qol) weights for PU
patients and for the general geriatric population were
obtained from the literature. The Qol weight was 0.703
for pressure-ulcer free nursing home patients, 0.68 for
those with single PUs of grades 1 and 2; 0.5 for multiple
PUs of grades 1 and 2; and 0.36 for severe PUs (grades 3
and 4) [7,24,30]. Cost data were the costs collected from
the collaborative.
To establish the effect of the uncertainty in the parame-
ters of the base case we conducted a probabilistic sensi-
tivity analysis, assuming a lognormal distribution for
costs and effects. A Monte Carlo simulation was run with
10,000 iterations per scenario.
We used standard discount rates recommended by the
Dutch guideline for pharmaeconomic studies (4% for
costs 1.5% for effects) [31].
Results
Patient characteristics
The 88 selected patients were not significantly different
in age, sex, or BMI from the non-selected patients partic-
ipating in the third round of the project. This was true for
baseline and terminal measurement points.
Effectiveness
As can be seen in table 1, the prevalence and incidence of
PUs in the selected patient group is lower after the collab-
orative, primarily due to reduction of less serious ulcers
Makai et al. Cost Effectiveness and Resource Allocation 2010, 8:11
/>Page 8 of 13
(grades 1 and 2). The participating patient group also had
a lower prevalence and incidence of PUs compared to the
non-participating patients. The uptake of useful inter-
ventions generally increased or did not change signifi-
cantly over time. We also observed the uptake of non-
useful interventions.
Costs
Table 2 shows a breakdown of materials used and time
spent on activities by all participants. The most time-con-
suming activity was intermittently turning the patient to
the side. Materials and time are translated into costs in
table 3. The program experts have the highest hourly
Table 3: Wages of staff and prices of materials
Labor
Program experts 115.00
Project (hourly) Project leader 36.82
Project member 31.56
Departmental (hourly) Paramedic 31.56
Dietician 31.56
Specialized nurse 34.71
Nurse 31.56
Other caregiver 18.94
Materials
Project (totals) Project materials 50,000
Other collaborative costs 64,000
Departmental (daily rental price) Basic mattress 1.11
SLK 1 (grades 1-2) 2.56
Dionica mattress (grades 1-2) 0.64
SLK 2 (grades 3 & 4) 4.52
Duo-care mattress (grades 3-4) 3.29
Quatro-care mattress (grades 3-4) 13.15
Foam pillow 0.03
Normal PU pillow 0.04
Special PU pillow (ROHO) 0.18
Makai et al. Cost Effectiveness and Resource Allocation 2010, 8:11
/>Page 9 of 13
wage, the caregivers the lowest. The daily rental price of
mattresses varies substantially.
Table 4 shows that the project created a savings in vari-
able nursing costs while increasing costs of preventing
and treating PUs. Most of the cost goes to personnel, fol-
lowed by mattress rental. Costs fluctuated primarily by
the reduction of grades 1 and 2 PUs, since the number of
severe ulcers did not change. In addition, the one-year
project costs for the organizations were larger than the
possible savings of a reduction of PUs. Therefore, the ini-
tial investment can only be recovered over a longer time
period.
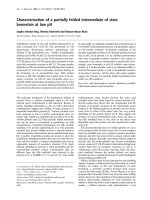
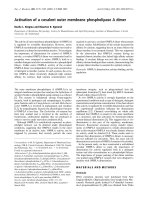
Modeling and sensitivity analysis
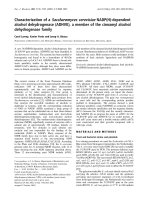
The prevalence of PUs over the course of the extrapolated
year depends on whether or not the change in incidence
and prevalence are sustained (figure 3). If changes are not
sustained at all, any success realized during the year in
terms of prevalence is lost. If changes are partially sus-
tained, prevalence slightly increases in the second year; in
the scenario where changes are fully sustained, preva-
lence remains low.
From a healthcare perspective, the costs of PU care
increased as a result of the project. At the same time, the
project raised the average Qol of patients. Although the
exact value of the QALY is debatable, there is a Dutch
policy advice [32] stating that the values should be maxi-
mally €80,000 for patients with high disease severity. The
QIC's incremental cost-effectiveness ratio after two years
is above this limit of 80,000 €/QALY except for the most
optimistic scenario where changes are completely sus-
tained (table 5).
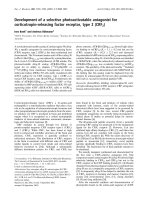
The sensitivity analysis (figure 4) allows us to investi-
gate the robustness of our results. The joint probability of
the ICER being below 80,000 along with a positive effect
on Qol is 37% for the not sustained scenario, 47% for the
partially sustained scenario, and 50% for the totally sus-
tained scenario. Therefore there is no clear indication of
the collaborative being effective after two years, and there
is a high probability that it is more costly in every sce-
nario.
Discussion
Summary of main results
The QIC significantly reduced the PU prevalence when
the measurements before and after the collaborative are
compared. This decrease was mainly due to the decrease
of non-severe PUs (grades 1 and 2). The Qol of patients
probably did not increase significantly.
Even though the variable costs of the organizations
decreased, the large project costs of the QIC increased
healthcare costs overall. Therefore, a QIC can only be
cost-effective if the efforts to reduce PUs are sustained. In
other words, short-term effectiveness is a necessary, but
not a sufficient condition for long-term cost-effective-
ness.
Sensitivity of the results
The sensitivity analysis showed considerable uncertainty
in the results of the model and thus it is not possible to
indicate clearly that the intervention was cost-effective.
The uncertainty lies in the effects of the collaborative; it is
only moderately probable that the patient's quality of life
will increase. This may be caused by the fact that the dif-
ference in quality of life of a regular nursing home patient
and a PU patient (independent of severity) is very small
[6], which makes detection of change difficult. In this
study, the difference in Qol between a patient without a
PU and a patient with a low-grade PU was minimal.
It is likely that the intervention is more costly than stan-
dard PU care; this study, however, works with a different
assumption than previous studies, therefore the savings
reached by preventing PUs are lower than that which can
be found in the literature [9]. This study assumed that
PUs in the long term care sector do not cause extra
patient days because 66% of nursing home patients
receive long-term care [26] or die as in-patients. There-
fore, we considered only the costs associated with PUs
and their prevention. This is contrary to a previous Dutch
study [9] that assumed PUs caused additional patient
days in the long term care sector.
Limitations and Strength
The main limitation of this study is that it was based on
an observational study. This limitation has far-reaching
consequences. Because of the lack of case-mix measures
for the population, we were only able to include the small
number of cases that survived the duration of the study,
while ignoring cases that died during the study. In addi-
tion, overrepresentation may be a problem because we
worked with self-reported data. Therefore we cannot say
with certainty that the selected cases were representative
of the whole population. Furthermore the results are
prone to the biases of any observational study, namely,
secular trends; therefore it is not certain that this decline
actually happened because of the collaborative. It should
be noted that secular trends were far slower then the
improvement in the selected patients: according to the
LPZ panel data from 2006 and 2007[33,34], the preva-
lence of pressure ulcers decreased from 24% to 18.3% in
Dutch nursing homes and from 11% to 7.9% in assisted
living facilities. Therefore it is not plausible that the
decline in PU-s in the collaborative was caused exclu-
sively by secular trends. Besides secular trends, selection
of the cases may have had an effect on the precise cost per
patient ratio. First including the costs of the remaining
teams (9 successful and 6 unsuccessful teams) would have
slightly increased the central cost per collaborative per
Makai et al. Cost Effectiveness and Resource Allocation 2010, 8:11
/>Page 10 of 13
Table 4: Costs per person treated for selected patients
PU Grade Average costs
STANDARD CARE 01 2 3 4
n/a single multiple single multiple single multiple single multiple monthly yearly
Pre-vention Labor Mattress Pillows 11.02
2.22
0.00
13.00
19.18
0.18
23.29
28.53
0.32
148.43
200.01
0.43
47.62
41.57
0.63
n/a 132.55
394.52
0.00
n/a 279.82
232.21
3.05
Treatment 0.00 68.38 64.82 59.17 68.64 n/a 142.01 118.34
Total standard care costs 13.15 100.73 114.57 408.04 115.89 n/a 669.09 n/a 657.10 84 1026
QIC Pre-vention Labor Mattress Pillows 30.80
7.38
0.34
45.86
42.37
0.45
110.25
49.57
0.51
123.30
47.95
0.41
n/a n/a 192.60
82.19
0.00
278.10
98.63
1.32
n/a
Treatment 0.00 59.17 66.27 56.81 n/a n/a 142.01 142.01 n/a
Total QIC clinical costs 38.52 147.86 226.86 228.46 n/a n/a 416.71 520.10 n/a 79 969
Program costs 323
Organizational costs 1550
Total QIC costs 2842
Makai et al. Cost Effectiveness and Resource Allocation 2010, 8:11
/>Page 11 of 13
patient. Second the project costs made by unsuccessful
teams would slightly raise the average project cost, but
since these teams did not complete the project these costs
are small in comparison to the costs made by the success-
ful departments. Therefore large biases are unlikely in the
average cost/patient ratio.
Caution is called for when interpreting the long term
effects of a collaborative. On one hand the small number
of cases made the decision-analytic modeling difficult
because the probabilities of incidence and healing in the
model may not be representative for the whole group. On
the other hand there is the question of which sustainabil-
ity scenario is most realistic. There is scarce evidence in
the literature about sustaining the changes of a QIC when
the project is over [10], raising the question of whether a
collaborative would ever be cost-effective. Even in organi-
zations where the results are sustained for an additional
year, the question of how far in the future the changes can
be sustained remains. This is especially important
because sustaining the changes is a prerequisite for the
organizations participating in the QIC to regain the initial
investment. The PU QIC involved staff training, and the
significant rate of labor fluctuation characteristic of
Dutch caregivers (10% annually) [35] may endanger sus-
tainability in the long run.
The major strength of this study is that it is one of the
first attempts to address the cost-effectiveness of a PU
QIC. This study gives detailed information on the costs
on the program level, the project costs within the organi-
zations, as well as the differences in the costs of nursing
Figure 3 Number of patients with pressure ulcers for two years after the start of the QIC.
Table 5: Incremental costs, quality of life and cost-effectiveness ratio
Not sustained Partially sustained Totally sustained
Difference in cost per person € 2.208
Probability = 0.97
€2.072
Probability = 0.97
€ 2.037
Probability = 0.97
Difference in Qol per person 0.016820965
Probability = 0.74
0.023361
Probability = 0.74
0.02594592
Probability = 0.75
ICER 131 253 88 692 78 517
Makai et al. Cost Effectiveness and Resource Allocation 2010, 8:11
/>Page 12 of 13
activities. In addition we have put serious effort into
decreasing the effect of design limitations. By simulating
a control-group based on the real data of first measure-
ment month we could visualize a situation where no
attention would have been paid to PU-s, a situation in
which all conditions are held the same. In other words we
have been able to control for every variable except for
changes caused by secular trends. Since control-groups
are usually not feasible for QICs, simulating control-
groups may be a feasible and promising approach to eval-
uate their cost-effectiveness, naturally with this limitation
in mind.
Additional research using an appropriate-case-mix
adjustment is needed to determine the effects of a PU
QIC and to establish incidence and healing rates in a
larger sample that includes the home care sector. Further-
more, additional research is needed on the effects of PU
collaboratives using cluster-randomization and Qol mea-
surements sensitive enough to detect changes in nursing
home patients. Finally, the long term effects are also wor-
thy of investigation, focusing especially on effective
methods for sustaining beneficial changes.
Conclusions
During the PU QIC the incidence and prevalence of PUs
significantly declined thus reducing variable costs of
organizations and probably realized small gains in quality
of life. From a healthcare perspective, the collaborative
was probably more costly and more effective in the short
run than standard PU care. Long term effects are highly
sensitive to the sustainability of the changes in nursing
method. Running a collaborative costs money and profit-
ability depends on the extent to which teams manage and
sustain new working methods. Further research is needed
to know how the improvement cycle plays out over a lon-
ger time period.
Competing interests
The authors declare that they have no competing interests.
Authors' contributions
PM has acquired and analyzed the data, drafted the manuscript and approved
the final version. MK has made substantial contribution to the interpretation of
the data, critically revised the manuscript for important intellectual content
and approved the final version. RB revised the manuscript and approved the
final version. AN has contributed to the study design, critically revised the man-
uscript for important intellectual content, and approved the final version.
Acknowledgements
We thank Mathilde Strating and Pepijn Vemer for their valuable comments.
Figure 4 Incremental costs and effects from Monte-Carlo simulation for three sustainability scenarios.
Makai et al. Cost Effectiveness and Resource Allocation 2010, 8:11
/>Page 13 of 13
Author Details
Department of Health Policy and Management, Erasmus University Rotterdam,
the Netherlands
References
1. Reddy M, Gill SS, Rochon PA: Preventing Pressure Ulcers: A Systematic
Review. JAMA 2006, 296:974-984.
2. Halfens RJGJM, Neyens JCL, Offermans MPW: Rapportage Resultaten:
Landelijke Prevalentiemeting Zorgproblemen 2008 Maastricht: Universiteit
Maastricht; 2008.
3. Shahin ES, Dassen T, Halfens RJG: Pressure ulcer prevalence and
incidence in intensive care patients: a literature review. Nursing in
Critical Care 2008, 13:71-79.
4. Kapoor A, Kader B, Cabral H, Ash AS, Berlowitz D: Using the Case Mix of
Pressure Ulcer Healing to Evaluate Nursing Home Performance.
American Journal of Medical Quality 2008, 23:342-349.
5. Berlowitz DR, Brandeis GH, Anderson J, Du W, Brand H: Effect of pressure
ulcers on the survival of long-term care residents. J Gerontol A Biol Sci
Med Sci 1997, 52:M106-110.
6. Franks PJ, Winterberg H, Moffatt CJ: Health-related quality of life and
pressure ulceration assessment in patients treated in the community.
Wound Repair and Regeneration 2002, 10:133-140.
7. Fleurence RL: Cost-effectiveness of pressure-relieving devices for the
prevention and treatment of pressure ulcers. International Journal of
Technology Assessment in Health Care 2005, 21:334-341.
8. Poos MJJC, Smit JM, Groen J, Kommer GJ, Slobbe LCJ: Kosten van Ziekten in
Nederland 2005 Bilthoven: RIVM; 2008.
9. Severens J, Habraken J, Duivenvoorden S, Frederiks C: The cost of illness
of pressure ulcers in The Netherlands. Adv Skin Wound Care 2002,
15:72-77.
10. Schouten LMT, Hulscher MEJL, Everdingen JJEv, Huijsman R, Grol RPTM:
Evidence for the impact of quality improvement collaboratives:
systematic review. BMJ 2008, 336:1491-1494.
11. Ovretveit J, Gustafson D: Evaluation of quality improvement
programmes. Qual Saf Health Care 2002, 11:270-275.
12. Mittman BS: Creating the Evidence Base for Quality Improvement
Collaboratives. Ann Intern Med 2004, 140:897-901.
13. Lynn J, West J, Hausmann S, Gifford D, Nelson R, McGann P, Bergstrom N,
Ryan JA: Collaborative Clinical Quality Improvement for Pressure Ulcers
in Nursing Homes. Journal of the American Geriatrics Society 2007,
55:1663-1669.
14. Baier RR, Gifford DR, Lyder CH, Schall MW, Funston-Dillon DL, Lewis JM,
Ordin DL: Quality Improvement for Pressure Ulcer Care in the Nursing
Home Setting: The Northeast Pressure Ulcer Project. Journal of the
American Medical Directors Association 2003, 4:291-301.
15. Huang ES, Zhang Q, Brown SES, Drum ML, Meltzer DO, Chin MH: The
Cost-Effectiveness of Improving Diabetes Care in U.S. Federally
Qualified Community Health Centers. Health Services Research 2007,
42:2174-2193.
16. Kilpatrick KE, Lohr KN, Leatherman S, Pink G, Buckel JM, Legarde C,
Whitener L: The insufficiency of evidence to establish the business case
for quality. Int J Qual Health Care 2005, 17:347-355.
17. Iglesias C, Nixon J, Cranny G, Nelson EA, Hawkins K, Phillips A, Torgerson D,
Mason S, Cullum N, Group PT: Pressure relieving support surfaces
(PRESSURE) trial: cost effectiveness analysis. BMJ 2006, 332:1416.
18. Thomson JS, Brooks RG: The economics of preventing and treating
pressure ulcers: a pilot study. J Wound Care 1999, 8:312-316.
19. McInnes E, Bell-Syer SEM, Dumville JC, Legood R, Cullum NA: Support
surfaces for pressure ulcer prevention. Book Support surfaces for pressure
ulcer prevention. (Editor ed.^eds.). City 2008.
20. Dorr DA, Horn SD, Smout RJ: Cost Analysis of Nursing Home Registered
Nurse Staffing Times. Journal of the American Geriatrics Society 2005,
53:840-845.
21. Vu T, Harris A, Duncan G, Sussman G: Cost-effectiveness of
multidisciplinary wound care in nursing homes: a pseudo-randomized
pragmatic cluster trial. Fam Pract 2007:cmm024.
22. Strating M, Zuiderent-Jerak T, Nieboer A, Bal R: Evaluating the Care for
better Collaborative Results of the First year of evaluation Institute of Health
Policy and Management Rotterdam; 2008.
23. de Veer AJE, Kerkstra A: Feeling at home in nursing homes. Journal of
Advanced Nursing 2001, 35:427-434.
24. Nijs KAND, de Graaf C, Kok FJ, van Staveren WA: Effect of family style
mealtimes on quality of life, physical performance, and body weight of
nursing home residents: cluster randomised controlled trial. BMJ 2006,
332:1180-1184.
25. RIVM Zorgkompas [ />ziekte/ziekten-en-aandoeningen/huid-en-subcutis/decubitus/welke-
zorg-gebruiken-patienten-en-kosten/]
26. Schols JMGACH, van Weel C: Nursing Home and Nursing Home
Physician: The Dutch Experience. Journal of the American Medical
Directors Association 2004, 5:207-212.
27. SOV&V: Collectieve Arbeidsovereenkomst Verpleeg en
Verzorgingshuizen. Book Collectieve Arbeidsovereenkomst Verpleeg en
Verzorgingshuizen (Sociaal overleg Verpleeg en Verzorgingshuizen). Den Haag
2006.
28. Briggs AMS, Claxton K: Decision Modelling for Health Economic Evaluation
Oxford: Oxford University Press; 2006.
29. CBS: Statline. [ />30. Drageset J, Eide GE, Nygaard HA, Bondevik M, Nortvedt MW, Natvig GK:
The impact of social support and sense of coherence on health-related
quality of life among nursing home residents A questionnaire survey
in Bergen, Norway. International Journal of Nursing Studies 2009,
46:66-76.
31. CVZ: Richtlijnen voor farmaco-economisch onderzoek, geactualiseerde
versie. Book Richtlijnen voor farmaco-economisch onderzoek,
geactualiseerde versie (College voor Zorgverzekeringen). Diemen 2006.
32. RvZ: Rechtvaardige en Duurzame Zorg. Book Rechtvaardige en
Duurzame Zorg (RvZ Raad in gezondheidszorg). Den Haag 2007.
33. Halfens MJRJG, Meijers JMM, Wansink SW: Landelijke Prevalentiemeting
Zorgproblemen: Resultaten negende jaarlijkse meting 2006 Maastricht:
University of Maastricht; 2006.
34. Halfens RJGJM, Neyens JCL, Offermans MPW: Rapportage resultaten:
Landelijke Prevalentiemeting Zorgproblemen 2007 Maastricht: Universiteit
Maastricht; 2007.
35. LEVV: Feiten & Cijfers 2008. 2008.
doi: 10.1186/1478-7547-8-11
Cite this article as: Makai et al., Cost-effectiveness of a pressure ulcer quality
collaborative Cost Effectiveness and Resource Allocation 2010, 8:11
Received: 1 April 2009 Accepted: 1 June 2010
Published: 1 June 2010
This article is available from: 2010 Makai et al; licensee BioMed Central Ltd. This is an Open Access article distributed under the terms of the Creative Commons Attribution License ( ), which permits unrestricted use, distribution, and reproduction in any medium, provided the original work is properly cited.Cost Effect iveness and Resou rce Allocation 2010, 8:11