Báo cáo y học: "Cost-effectiveness of a hypertension management programme in an elderly population: a Markov model" ppt
Bạn đang xem bản rút gọn của tài liệu. Xem và tải ngay bản đầy đủ của tài liệu tại đây (301.95 KB, 11 trang )
RESEARCH Open Access
Cost-effectiveness of a hypertension
management programme in an elderly
population: a Markov model
Gastón Perman
1,2*
, Emiliano Rossi
1
, Gabriel D Waisman
3
, Cristina Agüero
4
, Claudio D González
5
, Carlos L Pallordet
6
,
Silvana Figar
2
, Fernán González Bernaldo de Quirós
7
, JoAnn Canning
8
and Enrique R Soriano
8
Abstract
Background: Mounting evidence shows that multi-intervention programmes for hypertension treatment are more
effective than an isolated pharmacological strategy. Full economic evaluations of hypertension management
programmes are scarce and contain methodological limitations. The aim of the study was to evaluate if a
hypertension management programme for elderly patients is cost-effective compa red to usual care from the
perspective of a third-party payer.
Methods: We built a cost-effectiveness model using published evidence of effectiveness of a comprehensive
hypertension programme vs. usual care for patients 65 years or older at a community hospital in Buenos Aires,
Argentina. We explored incremental cost-effectiveness between groups. The mode l used a life-time framework
adopting a third-party payer’s perspective. Incremental cost-effectiveness ratio (ICER) was calculated in International
Dollars per life-year gained. We performed a probabilistic sensitivity analysis (PSA) to explore variable uncertainty.
Results: The ICER for the base-case of the “Hypertension Programme” versus the “Usual care” approach was 1,124
International Dollars per life-year gained. PSA did not significantly influence results. The programme had a probability
of 43% of being dominant (more effective and less costly) and, overall, 95% chance of being cost-effective.
Discussion: Results showed that “Hypertension Programme” had high probabilities of being cost-effective under a
wide range of scenarios. This is the first sound cost-effectiveness study to assess a comprehensive hypertension
programme versus usual care. This study measures hard outcomes and explores robustness through a probabilistic
sensitivity analysis.
Conclusions: The comprehensive hypertension programme had high probabilities of being cost-effective versus
usual care. This study supports the idea that similar programmes could be the preferred strategy in countries and
within health care systems where hypertension treatment for elderly patients is a standard practi ce.
Background
Over the last three decades, clinical research has sh own
that effective hypertension treatment lowers cardiovas-
cular events and rela ted deaths [1-12]. In spite of this
medical benefit there is increasing worldwide concern
about the economic b urden of hypertension a nd asso-
ciated cardiovascular outcomes [13].
Mounting evidence shows that multi-intervention pro-
grammes are more eff ective than an isolated pharmaco-
logical strategy [14-19 ]. Special attention is being giv en
to “ full-service disease management programs” , [20]
with its key characteristics based on: population identifi-
cation processes; evidence-based practice guidelines; col-
laborative practice models; patient self-management
education; process and outcome measurement, evalua-
tion and management; and routine reporting/feedback.
Full economic evaluations of hypertension management
programmes are scarce [21-24] and contain methodologi-
cal limitations. These limitations include: short-term
* Correspondence:
1
Medical Programmes, Hosp ital Italiano de Buenos Aires, (Perón 4253, 2°),
Ciudad de Buenos Aires, (C1199ABC), Argentina
Full list of author information is available at the end of the article
Perman et al. Cost Effectiveness and Resource Allocation 2011, 9:4
/>© 2011 Perman et al; licensee BioMed Central Ltd. This is an Open Access article distributed under the terms of the Creative Commons
Attribution License ( which permits unrestricted use, distribution, and reproduction in
any medium, provided the original work is properly cited .
analysis; lack of hard outcome measures; exclusive use of
secondary databases; and/or deficiencies in sensitivity
analysis.
Most economic evaluations in hypertension have
focused on the comparison of two drug treatments.
The major problem with these evaluations is that they
offer little direction to decision makers related to what
kind of health services to provide. They address ques-
tions limited to a few treatment options for only one
aspect -pharmacologic- of hypertension treatment.
Moreover, analysis has been primarily based on clinical
trials that analyze efficacy in ideal settings not real-life
effectiveness.
In year 2000, we started a multidisciplin ary antihyper-
tensive programme for elderly patients at Hospital Ita-
liano de Buenos Aires in Argentina. Its effectiveness was
demonstrated elsewhere [14]. In this study we evaluate
if our h ypertension management programme is cost-
effective compared to us ual care from the perspective of
a third-party payer.
Methods
Description of different treatment options
The effectiveness of a hypertension management pro-
gram in middle-class patients 65 years or older was
determined by a quasi-experim ental, individual-based
study [14] with a control group. This study had been
previously approved by an Ethics Committee. We com-
pared the intervention -“ Hypertension Programme” -
against “Usual care” -the control group- using a prag-
matic design (i.e. the study was designed to capture the
effects of i nterventions as they were usually performed,
avoiding artificial changes due to research protocol).
“ Usual care” consisted of attention by primary care
physicians (PCP). Visits to the PCP could be on a regular
basis or whenever the patient asked for an appointment.
There were no restrictions regarding studies, pharmacolo-
gical treatments or specialty consultations -cardiologists,
neurologists, etc., if the PCP agreed with them.
The new “ Hyper tension Programme” consisted of
usua l care descr ibed abov e pl us: personal and telephone
contact with patients by medical students; support with
non-pharmacological treatment such as diet and physi-
cal activity; educational material and optional workshops
focused on patient empowerment and self-efficacy;
information recorded on an electronic health record
that served as a link among health care workers.
Differences in systolic blood pressure (S BP) level and
in pe rcentage of well-controlled (< 140/90 mm Hg)
patients between groups were measured at baseline and
after 12 months of follow-up. Data were assessed by
intention-to-treat analysis. Two hundred and fifty
patients were evaluated in each group. There were no
baseli ne dif ferences between intervention and usual care
groups besides age (73 vs. 72 years, respective ly; p <
0.001; see Additional file 1, appendix). At baseline, mean
blood pressure (systolic/diastolic) in mm Hg (SD) was
138(20)/75(11) vs. 135(1 9)/75(11); and percenta ge of
well-controlled patients was 56.4% vs. 60.4%, respec-
tively. At the end of the study period, the difference of
mean change in systolic blood pressure between groups
was 7.1 mm Hg (95% confidence interval, 4-10 mm Hg).
Sixty-seven percent of patients in the intervention group
were well-controlled, versus 51% of patients in the con-
trol group (p < 0.001). With these improved results the
program w as implemented in the whole population of
hypertensive patients in the HMO. We used this infor-
mation to build our model.
Model construction
Even though we had patient-level data to perform a
cost-effectiveness analysis, we decided to build a theore-
tical model that considered these data because we could
nottracklong-termcostsand/or clinical outcomes in
the original study groups (after th e end of the study, the
intervention was implemented in the whole population).
The theoretical model built considered two possible
treatment options: “Hypertension Program me” or “Usual
Care”. We used a Markov model to allow f or repeated
cardiovascular events. Each cycle lasted 1 year. Costs
and outcomes were tracked through-out patient’ slife-
time. Even though this life-time perspective might be
controversial, we chose to not exclude very old patients
because of re cent evidence o f beneficial effects of hyper-
tension treatment in this age group [12]. Nevertheless,
we also explored the cost-effectiveness of the model
considering different follow-up times.
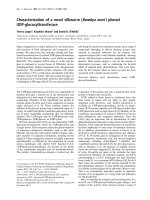
Independently of the treatment option chosen,
patients could follow one of three different paths in
each 1-year cycle, based on their transition probabilities
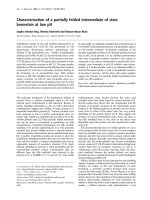
(figure 1): a) Continue in t he same health state without
suffering any event; b) Have an acute cardiovascular
event (acute myocardial infarction -AMI-, unstable
angina -UA- , ischaemic stroke, h aemorrhagic stroke,
transient ischaemic attack -TIA-, heart failure -HF- and
peripheral artery disease -PAD); or c ) Die from causes
other than cardiovascular disease. Patients who suffered
a cardiovascular event could have acute hospital atten-
tion or not. All patients suffering an acute event could
die during that year (cardiovascular death) or survive (at
least for that year).
Transition probabilities depended on age and the gen-
eral cardiov ascular risk equation in the Framingham
cohort study [25]. Because every patient had at least
65 years and hypertension at the start of the model, only
two categories were included: intermediate and high risk
(no patients with low risk). Irrespective of their basal risk,
patients who survived after a cardiovascular event started
Perman et al. Cost Effectiveness and Resource Allocation 2011, 9:4
/>Page 2 of 11
a new cycle in the high risk group. Ev ery patient that
completed each cycle in any state other than death
received 1 year of life gained (LYG). Yearly costs accord-
ing to the treatment group were also computed. If a
patient had suffered a cardiovascular event in that year,
hospital expenditures were charged only for those who
received hospital attention.
Assumptions
Given that this model tried to capture a real-life sce-
nario, we decided to include the probability of receiving
hospital attention or not during an acute event. This is
because of the relatively high proportion of patients
with asymptomatic or atypical symptoms of cardiovascu-
lareventsand/orsuddendeath. Patients assisted would
have higher costs (related to hospital attention) and bet-
ter survival outcome. These assumptions were the same
for both groups (programme and usual care) because we
considered that all hospitalized patients should have the
same quality of health care in acute cardiovascular
events.
Sources of cost data
We conducted a micro-costing analysis of all resource s
involved in running this program (see table 1). Total
cost per item was the unit cost times the quantity used.
Capital costs were calculated as equi valent annual costs
for a 5-year period using a 5% discount rate. We calcu-
lated all costs in 2006 Argentinean Pesos and adjusted
them to 2010 values using the average consumer pric e
index of different provinces from Argentina [26-31]. We
report values in International Dollars using the purchas-
ing power parity conversion rate suggested by the Inter-
national Monetary Fund [32].
Regarding hosp ital c osts fo r complications we could
not use data from the same c ohort studied in the origi-
nal trial because of time f rame restrictions and the sub-
sequent implementation of the intervention in the whole
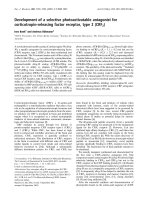
Figure 1 Diagram of the Markov model for each treatment option (usual care; and hypertension programme). Basal cardiovascular risk
status for patients could be intermediate risk (hypertension and age as only risk factors) or high risk (previous cardiovascular events and/or
diabetes mellitus and/or other cardiovascular risk factors that gave a high risk prediction according to Framingham’s algorithms). Both groups
could follow the same alternatives. Patients started each 1-year cycle at the left hand, according to their basal cardiovascular risk. They could
have an acute cardiovascular event or not or die from causes other than cardiovascular ones. Survival probabilities for an acute cardiovascular
event depended on whether the patient received acute hospital care or not. Red triangles at the right hand show the starting point for the next
one-year cycle: “Intermediate risk” continues in the intermediate risk group, “High risk” in the high risk group. Patients that died remained in that
state until the end of the model run.
Perman et al. Cost Effectiveness and Resource Allocation 2011, 9:4
/>Page 3 of 11
Table 1 Costs of the Hypertension Programme and Usual Care in 2010 International Dollars
Hypertension Programme Usual care
Concept Unit cost # Quantity * Annual cost & Unit cost # Quantity * Annual cost &
Hypertension programme
Labour
Physicians 15.73 3,168.00 49,820.80 NA NA NA
Fellows 10.27 4,752.00 48,808.07 NA NA NA
Monitors 5.29 15,744.00 83,272.20 NA NA NA
Education coordinator 24.22 204.00 4,940.97 NA NA NA
Educational workshops 20.76 564.03 11,708.14 NA NA NA
Secretary 6.60 528.00 3,485.35 NA NA NA
Nurse 7.93 13,305.60 105,507.51 NA NA NA
Epidemiologist 14.16 120.00 1,698.83 NA NA NA
Labour subtotal 309,241.87 NA
Labour subtotal per patient 10.31 NA
Capital
Coordinator’s furnishings 2,901.14 1.00 638.17 NA NA NA
Offices’ furnishings 2,238.88 1.00 492.49 NA NA NA
Sphygmomanometer 90.50 7.00 139.36 NA NA NA
Coordinator’s computers 1,703.98 5.00 1,874.16 NA NA NA
Offices’ computers 1,703.98 4.20 1,574.29 NA NA NA
Capital costs subtotal 4,718.48 NA
Capital cost subt per patient 0.16 NA
Land
Administrative office 112.09 7.50 10,088.39 NA NA NA
Medical office 112.09 7.50 10,088.39 NA NA NA
Support office 32.38 31.50 12,240.58 NA NA NA
Workshop space 16.61 564.03 9,366.51 NA NA NA
Land subtotal 41,783.86 NA
Land suptotal per patient 1.39 NA
Resources
Telephone
Effective call 0.12 7,959.96 971.57 NA NA NA
Ineffective call (non-response) 0.04 7,280.04 296.19 NA NA NA
Telephone subtotal 1,267.76 NA
Telephone subtotal per patient 0.04 NA
Brochures
Brochures 1.07 10,000.00 10,711.13 NA NA NA
Brochures subtotal 10,711.13 NA
Brochures subtotal per patient 0.36 NA
Surveillance software
Licence 4,151.60 NA NA NA
Hardware support 5,579.75 NA NA NA
Software maintenance 18.52 2,376.00 44,000.26 NA NA NA
Office 112.09 36.00 4,035.36 NA NA NA
Software development 11,588.72 NA NA NA
Server 3,397.26 NA NA NA
Computer 374.83 NA NA NA
Software subtotal 73,127.78 NA
Software subtotal per patient 2.44 NA
Programme total 440,850.89 NA
Programme subtotal per patient 14.70 NA
Overhead costs
Perman et al. Cost Effectiveness and Resource Allocation 2011, 9:4
/>Page 4 of 11
population (including the usual care group). Thus, we
decided to build a specific case-mix. We included all
hospital admittances from cardiovasc ular events (AMI,
UA, ischaemic stroke, haemorrhagic stroke, TIA, HF
and PAD, coded using SNOMED-CT [33] in adult affili-
ates from 01/01/20 06 to 12/31/2006. We tracked down
costs (micro-costing) for each episode and then calcu-
lated the mean hospital cost per cardiovascular event as
the average of all e pisodes during that period. Because
the distributio n was skewed to the right (as most cost
data), we used the lognormal transformation for sensi-
tivity analysis (see table 2).
The discount rate used for the base-case was 5% for
both costs and effectiveness, according to recommenda-
tions from the Panel on Cost-Effectiveness in Health and
Medicine [34]. In the sensitivity analysis we considered
up to a 12% discount rate according to suggestions from
the World Bank for Latin America and Argentina [35].
Sources of events and outcomes data
Annual rates of cardiovascular events for intermediate
and high risk patients were ca lculated from the general
cardiovascular risk equations in the Framingham cohort
study [25]. Cardiovascular risk reduction from decreased
Table 2 Variables for probabilistic sensitivity analysis: Costs in International Dollars for 2010
Cost Variables Base case Distribution type Distribution
Usual care
Cost drugs/year 206.43 Lognormal (4.36; 1.39)
Cost diagnostic/follow-up tests per year 29.10 Uniform (20.37;37.83)
Number of medical visits 7.68 Lognormal (1.68; 0.89)
Hypertension programme
Cost drugs/year 216.55 Lognormal (4.59; 1.26)
Cost diagnostic/follow-up tests per year 36.19 Uniform (25.33; 47.04)
Cost programme 14.66 Uniform (10.26; 19.06)
Number of medical visits 4.72 Lognormal (1.16; 0.85)
Common variables
Overhead cost (per visit) 1.98 Uniform (1.39; 2.57)
Cost per medical visit 9.63 Uniform (6.74; 12.52)
Cost ambulance/year 17.44 Uniform (12.21;22.67)
Proportion of drugs coverage 0.70 Uniform (0.40; 1.00)
Cost of cardiovascular event attention 10041.65 Lognormal (8.24; 1.39)
Cost of diagnostic tests first year 117.78 Uniform (82.44;153.11)
Table 1 Costs of the Hypertension Programme and Usual Care in 2010 International Dollars (Continued)
1.98 8.14 16.07 1.98 7.64 15.08
Overhead Subtotal (per patient) 16.07 15.08
Medical visits per patient §
Primary care physician 9.63 7.40 71.30 9.63 6.90 66.48
Specialist 9.63 0.74 7.13 9.63 0.74 7.13
Emergency ambulance service 1.45 12.00 17.44 1.45 12.00 17.44
Medical visits subtotal 95.87 91.04
Consumption per patient
Drugs 198.99 160.48
Diagnostic/follow-up tests § 36.19 29.10
Consumption subtotal per patient 235.18 189.58
Annual Total (per patient) 361.81 295.70
# Labour: cost/hour; Capital, Brochures and Software: cost per item; Land: cost per m2 per month or per hour rented.
Telephone: cost per call; Overhead and Medical visit: cost per medical visit.
* Labour: number of hours/year; Capital, Brochures and Software: number of items; Land: total m2 or hours rented.
Telephone: number of calls; Overhead and Medical visit: number of medical visits.
& Capital costs are expressed in equivalent annual costs (5% discount rate, 5 years for all items except for software
development, 10 years).
§ No co-payments were charged.
NA: Not applicable.
Perman et al. Cost Effectiveness and Resource Allocation 2011, 9:4
/>Page 5 of 11
SBP was calculate d as suggested by a meta-analysis of
individual data for one million adults i n 61 prospective
studies [ 36] using differences in final SBP levels between
“Usual Care” and “Hypertension Programme” groups. As
many references on outcomes did not report risks by
gender, we decided to use average results and to not
discriminate between sexes in the model.
Since we wanted the model t o capture the cost-effec-
tiveness as in a real-life setting, we considered those
potential patients that would not receive health care
attention during an acute cardiovascular event. Thus, we
calculated the proportion of patients not assisted taking
into account sudd en deaths -from cardiovascular origin-
and asymptomatic events -e.g. asymptomatic AMI- or
atypical presentations [37,38]. Mortality data from cardi-
ovascular events were taken from the same populations
used to fit other probabilities in the model [39-42].
Analysis
Since our aim was to inform decision makers from a
third-party p ayer on the c ost-effectiven ess of these two
approaches of hypertension treatment, we adopted this
perspective to perform analyses. We did not have data
from the original effectiveness study to also report
results from a societal perspective. For the same reason,
and budgetary constraints, we used life years gained
(LYG) as an effectiveness measure and not quality-
adjusted life years or other measure that considered
health-state values. We did not extrapolate quality of
life estimates from other populations due to clinically
important differences in health states valuation in our
region [43].
We calculated the incremental co st-effectiveness ratio
between the different options using difference in costs
in 2010 International Dollars divided by the di fference
in effectiveness in life years gained. All analyses were
done with TreeAge Pro 2009 (TreeAge Software, Inc.).
We performed a one-way sensitivity analysis to explore
the impact of each variable on results. A Tornado diagram
analysis was used to assess the relative weight of each vari-
able on overall uncertainty. We also explored variable
uncertainty and the impact of simultaneous changes in
variables included in the model with a probabilistic sensi-
tivity analysis using Monte-Carlo simulations [44]. The
model was run 100,000 times -iterations- taking different
random samples of all variables used (except for discount
rate). Tables 2 and 3 show variables used with its base
case value and distribution.
Discount rate was considered a structural variable in the
model. So, different analyses were performed with differ-
ent discount rates, from 0 to 12%. A theoretical willingness
topay(WTP)thresholdwassetatInt$45,000,corre-
sponding to 3 times the gross domestic product (GDP) of
Argentina in International Dollars for 2010 [32].
Due to its long-term perspective, model validation was
performed according to Weinstein et al [45]. Face validity
and verification were assessed during model construc-
tion, debugging and testing for internal consistency.
Model results were consistent with observed data from
mortality tables of populations were input data came
from [46,47]. Corroboration was supported by the
Markov model of the German hypertension treatment
programme, although it had different health states
and data sources [22]. Transparency and accreditation
were sought through the publication of this research in
an open access journal.
Results
Thebasecaseshowedthattheleastcostlybutleast
effective strategy was “ Usual care”.The“ Hypertension
Programme” had an incremental cost-effectiveness ratio
(ICER) of 1,124 International Dollars per life-year gained
(Int$/LYG). Results on total costs, effectiveness and
incremental costs and effectiveness are shown in table 4.
The variable that accounted for the majority of the
uncertaint y was the discount rate . It explained 91.7% of
the uncertainty in the model. The next one was the
starting age, explaining an extra 7.3%. Including the pro-
portion of patients in the cohort starting with high car-
diovascular risk, these 3 variables accounted f or 99.7%
of the overall uncertainty.
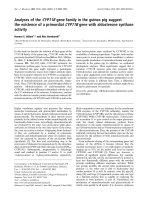
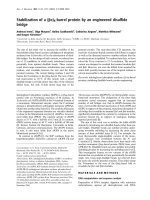
We performed a probabilistic sensitivity analysis
includi ng all variables in the model, except for discount
rate ( see tables 2 and 3). The ICER scatterplot of
“ Hypertension Programme” versus “ Usual care” is
shown in figure 2 for a discount rate of 5%. None of
iterations showed less effectiveness. In 43% of them,
“Hypertension Programme ” was dominant. In addition,
in 52% of cases the intervention had an ICER below a
predefined WTP threshold of 45,000 Int$/LYG. Only 5%
of iterations had an ICER above this threshold.
Being the discount rate the most sensitive variable, we
ran the model and performed probabilistic sensitivity
analyses for different values. Even at a discount rate of
12%, “ Hypertension Programme” was dominant in 43%
of cases. In 88.5% of times, the Programme was cost-
effective.
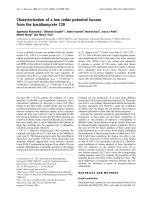
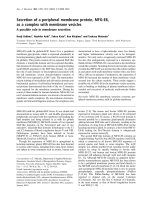
The cost-effectiveness acceptability curve (CEAC)
shows the probability of the “Hypertension Programme”
being cost-effective compared to “No Treatment” in a
wide range of willingness to pay thresholds (figure 3).
Considering a discount rate of 5%, at a WTP of 15,000
Int$/LYG (corresponding to Argentina’s GDP for 2010),
the “Hypertension Programme” had 82% probability of
being cost-effective. At a WTP threshold of 45,000 Int
$/LYG (3 times the GDP), the probability was 95%. See
additional file 2: graphic S1 for CEAC for different
discount rates.
Perman et al. Cost Effectiveness and Resource Allocation 2011, 9:4
/>Page 6 of 11
Discussion
Thi s study showed that this “Hyper tension Programme”
was more effective than “Usual care” at a relatively small
incremental cost. The base case result of ICER 1,124 Int
$/LYG is highly cost-effective in our local context.
Moreover, in 43% of 100,000 iterations performed in the
probabilistic sensitivity analysis, “ Hypertension Pro-
gramme” was dominant (mor e effective and les s costly).
Overall, in 95% of case s, the programme wa s cost-
effective.
This is the first study to include all the following
aspects: original (sho rt term) effect iveness data based on
a primary source; hard outcome measurements; a long-
term analysis; and a probabilistic sensitivity analysis.
A literature review of four previous studies showed a
combination of some methodological limitations in all
of them: short-term analyses [21,24]; intermediate out-
come measures [21,23]; a model based entirely on sec-
ondary sources [22]; or a biased sensitivity analysis [23].
In our model, the major determinant of uncertainty
was the discount rate used. In general, benefits of hyper-
tension treatments are seen several years after their
start. As a result, the bigger the discount rate used, the
lower the final benefit obtained. This is a common pro-
blem when considering cost-effectiveness of prevention
programmes. E ven though differen t discount rates pro-
duced different outputs, they would not significantly
alter decision-making (see additi onal file 2: graphic S1).
Table 4 Results for the base case
Strategy Mean Cost Incremental cost Mean Effect Incremental effect Average cost/effect ICER
Usual care (IC95%) $5,633.2
(2130 - 21027)
10.78 LYG
(10.15 - 11.24)
522.44 $/LYG
(163.92 - 2066.52)
Programme (IC95%) $5,828.5
(-9336 - 32499)
$195.3
(-11467 - 11472)
10.96 LYG
(10.37 - 11.37)
0.18 LYG
(0.08 - 0.29)
531.99 $/LYG
(194.80 - 1936.86)
1,124.49 $/LYG
(-75660 - 76230)
References: Mean effect: mean effectiveness; Incremental effect: incremental effectiveness; Average cost/eff: average cost-effectiveness; ICER: incremental cost-
effectiveness; IC95%: 95% confidence interval; $: 2010 International Dollars; LYG: life-years gained. Discount rate 5%.
Table 3 Variables for probabilistic sensitivity analysis: Outcomes
Probability variables Base-case Distribution type Distribution Reference
Reference population *
Risk event in medium risk 65-74 years 0.0255 Uniform (0.0223; 0.0285) [25,48]
Risk event in medium risk 75+ years 0.0400 Uniform (0.0300; 0.0500) [25,48]
Risk event high risk group 65-74 years 0.0325 Uniform (0.0300; 0.0350) [25,48]
Risk event in high risk group 75+ years 0.2000 Uniform (0.1500; 0.2500) [25,48]
Usual care group
Hazard ratio usual care group 0.6150 Normal (0.6150; 0.0089) [14,36]
Risk of event in middle risk group a
Risk of event in high risk group b
Hypertension programme group
Hazard ratio programme group 0.5124 Normal (0.5124; 0.0131) [14,36]
Risk of event in middle risk group c
Risk of event in high risk group d
Scenarios of HR in programme group 0.5100 Uniform (0.4500-0.5700) [14,36]
Common variables
Proportion initiate at medium risk 0.7000 Uniform (0.0000;1.0000) [14]
Starting age (years) 65 Uniform (65-80)
Risk of unrecognized event 0.3670 Uniform (0.2500; 0.4000) [38]
Risk of sudden death 0.1000 Uniform (0.0600; 0.1400) [37,50]
Mortality in assisted 65-74 years 0.1500 Uniform (0.1000; 0.2000) [39-42,46,47,50,52,53]
Mortality in assisted 75+ years 0.3000 Uniform (0.2500; 0.3500) [39-42,46,47,50,52,53]
Mortality in not assisted 65-74 years 0.3000 Uniform (0.2000; 0.4000) [39-42,46,47,50,52,53]
Mortality in not assisted 75+ years 0.6000 Uniform (0.5500; 0.6500) [39-42,46,47,50,52,53]
* A local reference population was used to calculate the risk reduction in both usual care and hypertension programme groups.
a) Risk of event in reference population (middle risk) × hazard ratio in usual care group.
b) Risk of event in reference population (high risk) × hazard ratio in usual care group.
c) Risk of event reference population (middle risk) × hazard ratio in programme group.
d) Risk of event in reference population (high risk) × hazard ratio in programme group.
Perman et al. Cost Effectiveness and Resource Allocation 2011, 9:4
/>Page 7 of 11
Nevertheless, a minimum 10 year-time horizon is
needed.
The probabilistic sensitivity analysis evaluated uncer-
tainty from all variables related to costs and outcomes
used in the model. For example, even though we had
exact costs for drug consumption (based on individual
patients’ dr ug purchase), we also included a variable for
percentage of drug coverage by the payer. This variable
tried to capture different economic burdens according
to the percentage of coverage provided.
Regarding variables on transition probabilities for
events and outcomes, we checked consistency of local
and international data before fitting the model. We
worked with diffe rent sources of systolic blood pressure
levels [48,49] to try to detect possible differences in
risks that could change outcomes in the model. Subtle
differences among different data sources did not affect
original cardiovascular risk probabilities.
Mortality data f rom cardiovascular events were tak en
from the same populations used to fit other probabilities
in the model [39-42]. Given the lack of data regarding
1 year-mortality of untreated cardiovascular events, we
decided to adjust these probabiliti es using nation al mor-
tality tables (adjusted for age and cause of death) and
observational studies [46,47,50] and to explore the range
in the sensitivity analysis.
Our study’s results are not directly comparable to pre-
viously published works [21,23,24] because they did not
evaluate hard outcomes and/or have a long-term per-
spective. On the other hand, the German study [22] used
a model that could allow broad comparisons. In general
it can be said that they had findings similar to ours. This
helps to corroborate results from both studies.
Of note, basal hypertension control in the usual care
groupfromthestudyusedtofitthemodelwashigh
-60.4%- and mean basal blood pressure was 135/75 mm
Hg [14]. In other settings, were basal control of hyperten-
sion is lower or the mean basal blood pressure is higher,
a greater difference in e ffective ness would be expected.
For example, compared to a general elderly population in
Argentina, the incremental effectiveness of “Hypertension
Programme” would have been 1,22 LYG [48].
Even though the incremental effectiveness was rela-
tively low for each patient, the model evaluated the effect
of both types of hypertension treatment in all hyperten-
sive patients in our population. Considering the impact
of the programme in the 30,000 hypertensive patients in
our setting, a total of 5,400 life years could be gained.
The model did not consider specific adverse events
related to hypertension treatme nt for t wo reasons: 1)
In previous studies, it was found that first-line anti-
hypertensive drugs do not have more side effects than
placebo [51]; and 2) to avoid double counting, because
eventual costs and consequences of adverse events in
hypertension treatment wouldbecapturedbythe
methodology used.
This study had some limitations. First, the effectiveness
study used to compare treatment strategies was not a
randomized controlled trial. It was impossible to perform
one in our setting because of organizational restrictions
Figure 2 Incremental cost-effect iveness scatter plot of
“Hypertension Programme” versus “Usual care”. Each blue dot
represents the result of an iteration (a set of sampled variables) out
of 100,000. The black circle represents the 95% confidence interval
of results. The dashed diagonal shows the willingness-to-pay
threshold of 45,000 Int$/LYG. Dotted lines mark 0 values for each
axis. Incremental costs expressed per 1,000 (K) international dollars.
Incremental effectiveness expressed in life years gained (LYG).
Figure 3 Cost-effectiveness acceptability curve (CEAC) for
treatment options. Green circles depict “Usual care"; blue
diamonds, “Hypertension Programme”. Willingness to pay (WTP) is
expressed per 1000 (K) international dollars per life-year gained
($/LYG). CEAC represent the probability for each intervention of
being the most cost-effective option for different WTP thresholds.
WTP is the maximum amount a society would be willing to pay,
sacrifice or exchange for a good or service. The CEAC helps
decision-makers to find the most probable cost-effective option
according to the local WTP.
Perman et al. Cost Effectiveness and Resource Allocation 2011, 9:4
/>Page 8 of 11
(i.e. that could not prevent contamination of interven-
tions between study groups). Nevertheless, “Hypertension
Programme” and “Usual Care” groups had similar basal
hypertension control in the originally published study, as
men tioned above [14]. It did not have major methodolo-
gical flaws, and its results were consistent with other stu-
dies [15-18]. Second, the study ’s pe rspective was not
societal. Third, outcomes did not capture quality of life.
Time-frame and budgetary restrictions prevented us
from considering resource use from a societal perspective
or from assessing utility measures during the original
study. In addition, after the success of this demonstration
study, all patients were treated according to the Hyper-
tension Programme, precluding us from assessing any
actual difference between groups. Given that the aim of
the study was to inform decision makers from a third-
party payer, the perspective adopted is all right. Never-
theless, a societal perspective might have given useful
informa tion and allowed analysis from other sectors. The
lack of consideration of health state values (e.g. through
QUALYs, etc.) is an important limitation. It is not possi-
ble to predict a possible influence of this fact. Effective-
ness could have been lower (for example stroke survivors
would have contributed with less than one QUALY per
each year survived), but the bigger proportion of patients
without cardiovascular events in the “ Hypertension Pro-
gramme” group could have summed more QUALYs
overall. Thus, it would be interesting to address this
important issue with a specific study designed “ad hoc”
(to assess this effect). Fourth, only the effect of (different
options of) hypertension treatment was evaluated. We
chose this approach because our original experience only
considered hypertension treatment. Nevertheless, a more
integral approach, considering also treatment of other
cardiovascular risk factors could have been adopted. This
would have probably increased the e ffectiveness seen.
Fifth, the study was based on urban populations from
middle income and high income countries. Results
should not be extrapolated to rural or low income popu-
lations . Finally, uncertainties inherent to the model were
not explored. Because of the time-horizon chosen, it
would have been impossible to avoid the use of a model,
although different assumptions could have been made.
Notwithstanding, the study had several strengths. First,
data on costs and effectiveness -intermediate outcomes-
used to fit the model were local and at patient-level. Costs
were evaluated in detail, and its real distribution was fitted
in the model. Second, resources used were informed in
appropriate physical units and valued in International Dol-
lars to favour comparisons in other settings. Third, consis-
tency of local and international data on events and
mortality was checked before fitting the model. The slight
differences observed did not modify model results. Fourth,
a hard-outcome measure -mortality- was used. Fifth, the
model was built to capture costs and outcomes of people
with and without hospital attention during acute cardio-
vascular events as in a “ real-life” scenario. Different
assumptions can be made in different settings according
to local access to health services and/or the rate of asymp-
tomatic events. Finally, a probabilistic sensitivity analysis
was performed with all variables included in the model.
Results were robust under a wide range of assumptions.
Conclusions
This is the first sound c ost-effectiveness study to assess
a comprehensive hypertension programme versus usual
care. Its results showed that the “ Hyp ertension Pro-
gramme” was cost-effective against “ Usual Care ” for
hypertension treatment a nd that its results were robust
against wide assumptions.
Our study supports the idea that similar programmes
could be the preferred strategy in countries and within
health care systems where hypertension treatment for
elderly patients is a standard practice.
Additional material
Additional file 1: Table S1 - Basal characteristics of patients in
original e ffec tivene ss study. Table showing basal clinical characteristics
of the intervention and control groups in the original effectiveness
study [14].
Additional file 2: Graphic S1 - Cost-effectiveness acceptability
curves for different discount rates. Additional file 2, graphic S1: Cost-
effectiveness acceptability curves for different discount rates: A) 0.0; B)
0.03; C) 0.07; D) 0.12. Each graph shows green circles for “Usual care” and
blue diamonds for “Hypertension Programme”. Willingness to pay
expressed per 1000 (K) international dollars per life-year gained.
Abbreviations
AMI: acute myocardial infarction; HF: heart failure; HMO: health maintenance
organization; ICER: incremental cost-effectiveness ratio; Int$: International
Dollars; Int$/LYG: International Dollars per life-year gained; LYG: life-years
gained; PAD: peripheral artery disease; PCP: primary care physician; PSA:
probabilistic sensitivity analysis; SNOMED-CT: Systematized Nomenclature of
Medicine-Clinical Terms; TIA: transient ischaemic attack; UA: unstable angina.
Author details
1
Medical Programmes, Hosp ital Italiano de Buenos Aires, (Perón 4253, 2°),
Ciudad de Buenos Aires, (C1199ABC), Argentina.
2
Epidemiology Section,
Internal Medicine Department, Hospital Italiano de Buenos Aires, (Perón
4253, 2°), Ciudad de Buenos Aires, (C1199ABC), Argentina.
3
Hypertension
Section, Internal Medicine Department, Hospital Italiano de Buenos Aires,
(Perón 4190, 2°), Ciudad de Buenos Aires, (C1199ABB), Argentina.
4
Financial
Department, Hospital Italiano de Buenos Aires, (Perón 4253, 2°), Ciudad de
Buenos Aires, (C1199ABC), Argentina.
5
Pharmacology Department, School of
Medicine, Universidad Austral, (Perón 1500), Derqui, (B1629AHJ), Provincia de
Buenos Aires, Argentina.
6
Fundación Capital, (Sinclair 3088), Ciudad de
Buenos Aires, (C1425FRD), Argentina.
7
Strategic Management, Hospital
Italiano de Buenos Aires, (Perón 4190, PB), Ciudad de Buenos Aires,
(C1199ABB), Argentina.
8
Health Informatics Department, Hospital Italiano de
Buenos Aires, (Perón 4272, 3°), Ciudad de Buenos Aires, (C1199ABD),
Argentina.
Authors’ contributions
All authors read and approved the final manuscript.
Perman et al. Cost Effectiveness and Resource Allocation 2011, 9:4
/>Page 9 of 11
GP, CG, CP, SF, FGBQ, JC and ES contributed to study conception and
design; GP, ER, GW and CA participated in the collection and assembly of
data; GP, ER, GW, CA, CG, CP and ES contributed to analysis and
interpretation of data; all authors participated in drafting of the article.
Competing interests
The authors declare that they have no competing interests.
Received: 15 February 2010 Accepted: 5 April 2011
Published: 5 April 2011
References
1. Prevention of stroke by antihypertensive drug treatment in older persons
with isolated systolic hypertension. Final results of the Systolic Hypertension
in the Elderly Program (SHEP): SHEP Cooperative Research Group. Jama
1991, 265(24):3255-3264.
2. Dahlof B, Lindholm LH, Hansson L, Schersten B, Ekbom T, Wester PO:
Morbidity and mortality in the Swedish Trial in Old Patients with
Hypertension (STOP-Hypertension). Lancet 1991, 338(8778):1281-1285.
3. Amery A, Birkenhager W, Brixko P, et al: Mortality and morbidity results
from the European Working Party on High Blood Pressure in the Elderly
trial. Lancet 1985, 1(8442):1349-1354.
4. Staessen JA, Fagard R, Thijs L, et al: Randomised double-blind comparison
of placebo and active treatment for older patients with isolated systolic
hypertension. The Systolic Hypertension in Europe (Syst-Eur) Trial
Investigators. Lancet 1997, 350(9080):757-764.
5. Coope J, Warrender TS: Randomised trial of treatment of hypertension in
elderly patients in primary care. Br Med J (Clin Res Ed) 1986,
293(6555):1145-1151.
6. Medical Research Council trial of treatment of hypertension in older adults:
principal results: MRC Working Party. BMJ 1992, 304(6824):405-412.
7. Turnbull F: Effects of different blood-pressure-lowering regimens on
major cardiovascular events: results of prospectively-designed overviews
of randomised trials. Lancet 2003, 362(9395):1527-1535.
8. Staessen JA, Wang JG, Thijs L: Cardiovascular prevention and blood
pressure reduction: a quantitative overview updated until 1 March 2003.
J Hypertens 2003, 21(6):1055-1076.
9. Staessen JA, Gasowski J, Wang JG, et al: Risks of untreated and treated
isolated systolic hypertension in the elderly: meta-analysis of outcome
trials. Lancet 2000, 355(9207):865-872.
10. Gueyffier F, Boutitie F, Boissel JP, et al: Effect of antihypertensive drug
treatment on cardiovascular outcomes in women and men. A meta-
analysis of individual patient data from randomized, controlled trials.
The INDANA Investigators. Ann Intern Med 1997, 126(10):761-767.
11. Neal B, MacMahon S, Chapman N: Effects of ACE inhibitors, calcium
antagonists, and other blood-pressure-lowering drugs: results of
prospectively designed overviews of randomised trials. Blood Pressure
Lowering Treatment Trialists’ Collaboration. Lancet 2000,
356(9246):1955-1964.
12. Beckett NS, Peters R, Fletcher AE, et al: Treatmen t of hypert ensio n in
patients 80 years of age or older. NEnglJMed2008,
358(18):1887-1898.
13. Narayan KM, Ali MK, Koplan JP: Global noncommunicable diseases–where
worlds meet. N
Engl J Med 363(13):1196-1198.
14. Figar S, Waisman G, De Quiros FG, et al: Narrowing the gap in
hypertension: effectiveness of a complex antihypertensive program in
the elderly. Dis Manag 2004, Fall 7(3):235-243.
15. Garcia-Pena C, Thorogood M, Armstrong B, Reyes-Frausto S, Munoz O:
Pragmatic randomized trial of home visits by a nurse to elderly people
with hypertension in Mexico. Int J Epidemiol 2001, 30(6):1485-1491.
16. Fahey T, Schroeder K, Ebrahim S: Interventions used to improve control of
blood pressure in patients with hypertension. Cochrane Database Syst Rev
2006, , 4: CD005182.
17. Roumie CL, Elasy TA, Greevy R, et al: Improving blood pressure control
through provider education, provider alerts, and patient education:
a cluster randomized trial. Ann Intern Med 2006, 145(3):165-175.
18. Agewall S, Wikstrand J, Samuelsson O, Persson B, Andersson OK,
Fagerberg B: The efficacy of multiple risk factor intervention in treated
hypertensive men during long-term follow up. Risk Factor Intervention
Study Group. J Intern Med 1994, 236(6):651-659.
19. Clark AM, Hartling L, Vandermeer B, McAlister FA: Meta-analysis: secondary
prevention programs for patients with coronary artery disease. Annals of
internal medicine 2005, 143(9):659.
20. Faxon DP, Schwamm LH, Pasternak RC, et al: Improving quality of care
through disease management: principles and recommendations from
the American Heart Association’s Expert Panel on Disease Management.
Stroke 2004, 35(6):1527.
21. García-Peña C, Thorogood M, Wonderling D, Reyes-Frausto S: Economic
analysis of a pragmatic randomised trial of home visits by a nurse to
elderly people with hypertension in Mexico. Salud Pública de México 2002,
44:14-20.
22. Gandjour A, Stock S: A national hypertension treatment program in
Germany and its estimated impact on costs, life expectancy, and cost-
effectiveness. Health Policy 2007, 83(2-3):257-267.
23. Rein DB, Constantine RT, Orenstein D, et al: A cost evaluation of the
Georgia Stroke and Heart Attack Prevention Program. Prev Chronic Dis
2006, 3(1):A12.
24. Johannesson M, Agewall S, Hartford M, Hedner T, Fagerberg B: The cost-
effectiveness of a cardiovascular multiple-risk-factor intervention
programme in treated hypertensive men. J Intern Med 1995, 237(1):19-26.
25. D’Agostino RB Sr, Vasan RS, Pencina MJ, et al: General cardiovascular risk
profile for use in primary care: the Framingham Heart Study. Circulation
2008, 117(6):743-753.
26. Instituto
Provincial de Estadísticas y Censos de la Provincia de Santa Fe.
[ />Ministerios/Gobierno-y-Reforma-del-Estado/Secretaria-de-Tecnologias-para-
la-Gestion/Direccion-Provincial-del-Instituto-Provincial-de-Estadistica-y-
Censos-de-la-Provincia-de-Santa-Fe/Indices-y-Precios/INDICES-Y-PRECIOS],
[cited August 10th 2010].
27. Dirección Provincial de Estadística y Censos de la Pronvicia de San Luis.
[ />PaginaId=76], [cited August 10th 2010].
28. Dirección General de Estadística y Censos de la Provincia de La Pampa.
[ />task=blogcategory&id=15&Itemid=23], [cited August 10th 2010].
29. Dirección de Estadística y Censos de la Provincia de Entre Ríos.
[ [cited August 10th 2010].
30. Dirección Provincial de Planeamiento Estadística y Censos - Provincia de
Jujuy. [ [cited August 10th 2010];.
31. Fundación Capital. [], [cited August 10th
2010].
32. International Monetary Fund: World Economic and Financial Surveys.
World Economic Outlook Database 2010, April 2010 Edition.
33. College of American Pathologists: SNOMED Clinical Terms Technical
Reference Guide. 2005.
34. Gold MR, Siegel JE, Russell LB, Weinstein MC: Cost-effectiveness in health
and medicine. Oxford University Press New York; 1996.
35. Lopez H: The Social Discount Rate: Estimates for Nine Latin American
Countries. World Bank Policy Research Working Paper Series; 2008.
36. Lewington S, Clarke R, Qizilbash N, Peto R, Collins R: Age-specific relevance
of usual blood pressure to vascular mortality: a meta-analysis of
individual data for one million adults in 61 prospective studies. Lancet
2002, 360(9349):1903-1913.
37. Kannel WB, Cupples LA, D’Agostino RB: Sudden death risk in overt
coronary heart disease: the Framingham Study. Am Heart J 1987,
113(3):799-804.
38. Kannel WB, Abbott RD: Incidence and prognosis of unrecognized
myocardial infarction. An update on the Framingham study. N Engl J
Med 1984, 311(18):1144-1147.
39. Blanco P, Gagliardi J, Higa C, Dini A, Guetta J, Di D: Infarto agudo de
miocardio. Resultados de la Encuesta SAC 2005 en la República
Argentina. Rev Argent Cardiol 2007, 75:163-170.
40. Rosamond W, Flegal K, Furie K, et al: Heart Disease and Stroke Statistics–
2008 Update: A Report From the American Heart Association Statistics
Committee and Stroke Statistics Subcommittee. Circulation 2008, 117(4):
e25-e146.
41. Sposato LA, Esnaola MM, Zamora R, Zurru MC, Fustinoni O, Saposnik G:
Quality of ischemic stroke care in emerging countries: the Argentinian
National Stroke Registry (ReNACer). Stroke 2008, 39(11):3036-3041.
Perman et al. Cost Effectiveness and Resource Allocation 2011, 9:4
/>Page 10 of 11
42. Grysiewicz RA, Thomas K, Pandey DK: Epidemiology of ischemic and
hemorrhagic stroke: incidence, prevalence, mortality, and risk factors.
Neurologic clinics 2008, 26(4):871.
43. Augustovski FA, Irazola VE, Velazquez AP, Gibbons L, Craig BM: Argentine
valuation of the EQ-5D health states. Value in Health 2009, 12(4):587-596.
44. National Institute for Health and Clinical Excellence: Guide to the Methods
of Technology Appraisal. 2004.
45. Weinstein MC, Toy EL, Sandberg EA, et al: Modeling for health care and
other policy decisions: uses, roles, and validity. Value Health 2001,
4(5):348-361.
46. Secretaría de Políticas Regulación e Institutos: Dirección de Estadísticas e
Información de Salud. Ministerio de salud de la Nación. Argentina.
Estadísticas Vitales - Información Básica Año 2006; 2007.
47. World Health Organization: United States of America. Mortality Table.
2005 [ [cited
July 2009].
48. Przygoda P, Janson J, O’Flaherty M, et al: Lack of effective blood pressure
control among an elder hypertensive population in Buenos Aires. Am J
Hypertens 1998, 11(8 Pt 1):1024-1027.
49. Franklin SS, Jacobs MJ, Wong ND, L’Italien GJ, Lapuerta P: Predominance of
isolated systolic hypertension among middle-aged and elderly US
hypertensives: analysis based on National Health and Nutrition
Examination Survey (NHANES) III. Hypertension 2001, 37(3):869-874.
50. Rothwell PM, Coull AJ, Silver LE, et al: Population-based study of event-
rate, incidence, case fatality, and mortality for all acute vascular events
in all arterial territories (Oxford Vascular Study). Lancet 2005,
366(9499):1773-1783.
51. Materson BJ, Reda DJ, Cushman WC, et al: Single-drug therapy for
hypertension in men. A comparison of six antihypertensive agents with
placebo. The Department of Veterans Affairs Cooperative Study Group
on Antihypertensive Agents. N Engl J Med 1993, 328(13):914-921.
52. Kleindorfer D, Panagos P, Pancioli A, et al: Incidence and short-term
prognosis of transient ischemic attack in a population-based study.
Stroke 2005, 36(4):720-723.
53. Perna E, Canella JPC, Marquez LL: Resultados finales del Registro
HOSPICAL; evolución a corto y largo plazo de pacientes con
insuficiencia cardíaca descompensada en Argentina. Rev Fed Arg Cardiol
2007, 36:152-161.
doi:10.1186/1478-7547-9-4
Cite this article as: Perman et al.: Cost-effectiveness of a hypertension
management programme in an elderly population: a Markov model.
Cost Effectiveness and Resource Allocation 2011 9:4.
Submit your next manuscript to BioMed Central
and take full advantage of:
• Convenient online submission
• Thorough peer review
• No space constraints or color figure charges
• Immediate publication on acceptance
• Inclusion in PubMed, CAS, Scopus and Google Scholar
• Research which is freely available for redistribution
Submit your manuscript at
www.biomedcentral.com/submit
Perman et al. Cost Effectiveness and Resource Allocation 2011, 9:4
/>Page 11 of 11