150 Practice ECGs: Interpretation and Review - Part 1 pps
Bạn đang xem bản rút gọn của tài liệu. Xem và tải ngay bản đầy đủ của tài liệu tại đây (282.38 KB, 27 trang )
150 Practice ECGs:
Interpretation and Review
Third Edition
Part I: How to Interpret ECGs
Chapter 1:
Baseline Data
Chapter 2:
Morphologic Changes in P, QRS, ST, and T
Part II: 150 Practice ECGs
Part III: Interpretation and Comments
For Marilyn
L1
150 Practice ECGs:
Interpretation and Review
Third Edition
George J. Taylor, MD
Professor of Medicine
The Medical University of South Carolina
The Ralph H. Johnson VA Medical Center
Charleston, South Carolina, USA
© 2006 George J. Taylor
Published by Blackwell Publishing Ltd
Blackwell Publishing, Inc., 350 Main Street, Malden, Massachusetts 02148-5020, USA
Blackwell Publishing Ltd, 9600 Garsington Road, Oxford OX4 2DQ, UK
Blackwell Publishing Asia Pty Ltd, 550 Swanston Street, Carlton, Victoria 3053, Australia
The right of the Author to be identified as the Author of this Work has been asserted in
accordance with the Copyright, Designs and Patents Act 1988.
All rights reserved. No part of this publication may be reproduced, stored in a retrieval
system, or transmitted, in any form or by any means, electronic, mechanical, photocopying,
recording or otherwise, except as permitted by the UK Copyright, Designs and Patents Act
1988, without the prior permission of the publisher.
First published 1997
Second edition 2002
Third edition 2006
Library of Congress Cataloging-in-Publication Data
Taylor, George Jesse.
150 practice ECGs : interpretation and review / George J. Taylor.—3rd ed.
p. ; cm.
Includes index.
ISBN-13: 978-1-4051-0483-8 (pbk. : alk. paper)
ISBN-10: 1-4051-0483-X (pbk. : alk. paper)
1. Electrocardiography—Problems, exercises, etc. I. Title. II. Title: One hundred fifty
practice ECGs.
[DNLM: 1. Electrocardiography—Examination Questions. WG 18.2
T241z 2006]
RC683.5.E5T34 2006
616.1’207547—dc22
2005017378
ISBN-13: 978-1-4051-0483-8
ISBN-10: 1-4051-0483-X
A catalogue record for this title is available from the British Library
Set in 10 on 13 pt Meridien by SNP Best-set Typesetter Ltd., Hong Kong
Printed and bound by Edwards Brothers Inc., USA
Commissioning Editor: Gina Almond
Development Editor: Vicki Donald
Production Controller: Kate Charman
For further information on Blackwell Publishing, visit our website:
www.blackwellcardiology.com
Notice: The indications and dosages of all drugs in this book have been recommended in
the medical literature and conform to the practices of the general community. The medica-
tions described do not necessarily have specific approval by the Food and Drug
Administration for use in the diseases and dosages for which they are recommended. The
package insert for each drug should be consulted for use and dosage as approved by the
FDA. Because standards for usage change, it is advisable to keep abreast of revised recom-
mendations, particularly those concerning new drugs.
The publisher’s policy is to use permanent paper from mills that operate a sustainable for-
estry policy, and which has been manufactured from pulp processed using acid-free and ele-
mentary chlorine-free practices. Furthermore, the publisher ensures that the text paper and
cover board used have met acceptable environmental accreditation standards.
Contents
Preface,vi
PART I: How to Interpret ECGS, 1
NormalIntervals,1
Chapter 1: Baseline Data, 3
AProtocolforReadingECGs,3
HowtoUseThisBook,3
TheECGIsaVoltmeter,4
MeasuringHeartRate,6
Intervals,7
PRInterval,7
QRSDuration,8
TWaveandtheQTInterval,9
Rhythm,11
SinusRhythmandSinusArrhythmia,11
HeartBlock,12
AtrialArrhythmias,18
VentricularArrhythmias,28
ElectricalAxis,33
QRSAxis,33
TWaveAxis,35
Chapter 2: Morphologic Changes
in P, QRS, ST, and T, 37
Atrial(PWave)Abnormalities,37
LeftAtrialAbnormality,37
RightAtrialAbnormality,38
v
IntraventricularConduction
Abnormalities,38
RightBundleBranchBlock,38
IncompleteRightBundleBranch
Block,41
LeftBundleBranchBlock,41
LeftAnteriorandPosteriorFascicular
Block,43
BifascicularBlock,43
VentricularHypertrophy,QRSAmplitude,
andRWaveProgression,44
LeftVentricularHypertrophy,45
RightVentricularHypertrophy,46
Delayed,orPoor,RWaveProgressionin
PrecordialLeads,47
LowQRSVoltage,48
PatternsofIschemiaandInfarction,49
STSegmentDepression,49
TWaveInversion,53
STSegmentElevation,55
QWavesandEvolutionofMyocardial
Infarction,58
PART II: 150 Practice ECGs, 63
PART III: Interpretation and
Comments, 215
Index,253
Notes,265
Preface
Your problem as a student of electrocardiography is that you may not get enough
practice to become good at it. The best way to get experience is to read ECGs from the
hospital’s daily accumulation, commit your interpretation to paper, then look over the
shoulder of the experienced person who is reading those ECGs for the record.
Unfortunately, most students and residents do not have that opportunity. Training
programs are placing an ever-increasing clinical load on their faculties. One-on-one
teaching experiences are hard to program. It is the rare institution that provides most of
its students and residents headed for primary care practice with an adequate ECG
reading experience.
This book is intended as an ECG curriculum that emphasizes practice. My goal is to
have you reading ECGs as quickly as possible. The introductory chapters are shorter
than those found in the usual beginner’s manual, but there is plenty there to get you
started. Where you want additional depth, refer to an encyclopedic text in the library.
The practice ECGs include clinical data and questions that are designed to make
teaching points. My brief discussion emphasizes daily issues in clinical medicine, as
well as material that you may encounter on Board exams (Internal Medicine, Family
Practice, Flex, and National Boards). Spend five evenings with these practice ECGs, and
you will be far more comfortable than the average house officer with this basic part of
the clinical examination.
Credit for the high quality of ECG reproduction in this book goes to Gordon Grindy
and his colleagues at Marquette Electronics, Inc. My partner, Wes Moses, proofread the
text and ECG interpretations, and I am also grateful to Dr. Hans Traberg who made
useful suggestions for the 3rd edition. I again acknowledge that Marilyn Taylor is a
patient woman, and I appreciate her forbearance during this writing adventure.
G.J.T.
vi
How to Interpret ECGs
PART I
Normal Intervals
Heart Rate 60–99 beats/min
bradycardia <60 beats/min
tachycardia >100 beats/min
PR 0.12–0.21 sec
PR prolongation ≥0.22 sec
QRS < 0.12
QRS axis -30° to +105°
QTc the corrected QT interval (calculated as QT ∏ interval).
It varies with age and gender, but is roughly <0.45 sec.
RR
Baseline Data
CHAPTER 1
A Protocol for Reading ECGs
The protocol that you should follow when reading ECGs is outlined in Table 1.1. It is
the approach cardiologists have taught generations of students, and it works. After
reading ECGs for decades—and for a living—I still use it. With experience, I am good
at pattern recognition. I glance at an ECG and promptly recognize major abnormalities.
As you gain experience, you will develop this ability, and you will be tempted to focus
immediately on the gross abnormalities that seem to jump out of the page. Resist that
temptation! Do what the pros do, and make yourself follow the steps outlined in Table
1.1. Regardless of your ability and experience, if you do not focus on the rate, rhythm,
intervals, and axis, you will miss subtle and important abnormalities. This is one of
those areas of clinical medicine where you should not cut corners. Not addressing
intervals, for example, would be like omitting the family history from a history and
physical exam.
That analogy is a good one. The beauty of the history and physical examination
format is that it allows you to collect meaningful data, even when the patient has an
illness that you do not understand. Collecting basic data from the ECG serves a similar
purpose for the novice.
How to Use This Book
First, read the introductory chapters that explain ECG findings and provide diagnostic
criteria. Although useful, this exercise will not teach you how to read ECGs. You will
take that step when you work through the practice tracings in Part II of this book.
When reading the unknown ECGs in Part II, write your interpretation. First, record
rate, rhythm, intervals, and QRS axis. Then, analyze QRS and ST-T wave morpholo-
gies, and record your impression beginning with “ECG abnormal due to. . . .” If you do
not commit yourself on paper, it does not count! Finally, check your interpretation with
mine, which is in Part III. Read five to ten tracings, or more, before checking
answers. You will get into a kind of rhythm when you read ECGs without
interruption.
50PracticeECGs:InterpretationandReview
Basic clinical data are provided with the ECGs, and I ask questions about manage-
ment and diagnosis that go beyond the formal ECG report. Reading ECGs is a great
opportunity to think (and teach) about heart disease, and I will not miss that opportu-
nity here.
The remainder of this and the next chapter deal with each item on the ECG reading
protocol (see Table 1.1). This book is for the near-beginner; most of you have had
some introduction to the ECG. I will avoid lengthy description of technical areas such
as the origin of lead systems. My goal is to provide brief yet clear explanations, and to
get you through the introductory material as quickly as possible. Then it’s on to the
practice ECGs.
The ECG is a Voltmeter
It measures the small amount of voltage generated by depolarization of heart muscle.
The vertical, or y axis, on the ECG is voltage, with each millimeter (mm) of paper equal
to 0.1 millivolt (mV) (Fig 1.1). For practical purposes, we often refer to the amplitude,
or height, of an ECG complex in millimeters of paper rather than in millivolts. At the
beginning or end of the ECG, you may see a square wave, machine induced, that is
10 mm tall; this is a 1-mV current entered by the machine for calibration. The gain can
be changed so that high-voltage complexes fit on the paper, or so that low-voltage
complexes are magnified. Changing the gain is uncommon, but it would be apparent
from the calibration marker.
Voltage may have either a negative or a positive value. This is because voltage is a
vector force with direction as well as amplitude. All the rules of vector analysis apply.
Note that the wave of depolarization moves through the heart in three dimensions,
but that each ECG lead records it in just one dimension, between two poles. Having 12
leads grouped in frontal and horizontal planes allows us to reconstruct electrical events in
three dimensions (Fig 1.2). The vectorcardiogram, popular 40 years ago and seldom used
now, displayed the wave of depolarization in three dimensions, using x, y, and z axes.
On the ECG, when the wave of depolarization moves toward the positive pole of an
individual lead the deflection is upright, or positive. For example, if depolarization pro-
gresses from the right side of the heart to the left, the net voltage is positive in lead I
(Fig 1.2). Downward deflections are negative. The general direction of the wave of
depolarization, the orientation of its vector in space, is referred to as the electrical axis.
Depolarization of the atria progresses from the upper right toward the lower left, so the
ECGReadingProtocol
Rate Conductionabnormality
Rhythm Atrialabnormality
Intervals Ventricularhypertrophy
QRSaxis STsegment—Twavechanges
Patternsofischemiaandinfarction
BaselineData 5
Thesquarewaveatthebeginningisa-mVcalibrationmarker.Atfullstandard,0mmof
paper
=mVofcurrent.TheECGpaperrunsat25mm/sec.Thus,eachmillimeter=0.0second,and
eachlargesquare(5mm)
=0.2second.Thetimebetweentwopositivedeflections,orRwaves,istheRR
interval.Ifthatissecond,theheartrateis60beats/min.Thispatient’sheartrateis00beats/min(60
secondsperminute
∏0.6secondperbeat).
Spatialorientationofthe2ECGleads.EachoftheECGleadsfunctionsasavoltmeterand
hasspatialorientation(asvoltageisavectorforce).Leadsthathaveaninferiororientationarebestat
detectingchangesfromtheinferiorsurfaceoftheheart.Anteriorprecordialleadsaremostsensitivein
detectinganteriorwallchanges,andthelateralleads,lateralwallabnormalities.
6 50PracticeECGs:InterpretationandReview
normal P wave axis is about 60
°
. Measurement of the QRS axis is discussed at the end
of this chapter.
The ECG records the voltage generated by depolarization of the different regions of
the heart through time. Following discharge of the sinoatrial (SA) node, the atria are
depolarized (the P wave, Fig 1.3). Current then passes through the atrioventricular
(AV) node, where there is delay (the PR interval). When the wave of depolarization exits
the AV node, it passes through the His bundle, then the bundle branches, and on to
the ventricles. Discharge of the muscular ventricles produces the QRS complex. This is
followed by repolarization of the ventricles (T wave).
Measuring Heart Rate
On older ECG machines, the paper moved at an arbitrarily set speed of 25 mm/sec. On
current machines the paper is stationary and the stylus moves at 25 mm/sec, yet we
customarily refer to “paper speed.” At this speed, each millimeter of ECG paper is equal
to 1/25, or 0.04 second (see Fig 1.1). ECG paper is boldly ruled at 5-mm, or 0.2-
second, intervals. And 5 of these large (5-mm) squares equals 1 second—straightfor-
ward arithmetic. Using this, there are a couple of fast ways to calculate heart rate
when the rhythm is regular.
Sequenceofcardiacactivation.Thesinoatrial(SA)node,locatedinthehighrightatrium,is
thecardiac
pacemaker.Itfiresatarateof60to00beats/min,andtherateisinfluencedbybothsympa-
theticandparasympathetictone.Atrialmuscledepolarizationproducesenoughcurrenttocauseadeflec
-
tiononthesurfaceECG,thePwave.Thewaveofdepolarizationisfunneledintotheatrioventricular(AV)
node,locatednearthejunctionoftheatrialandventricularsepta.CurrentisdelayedintheAVnode,pro
-
ducingthePRinterval.Thisdelayallowstimeforatrialcontraction(whichcompletesventricularfilling).
CurrentexitstheAVnodeintothebundleofHis,whichthendividesintotheleftandrightbundle
branches.Initialdepolarizationoftheinterventricularseptumtakesplacefromthelefttotherightside.
Currentthenmovessimultaneouslythroughtheleftandrightbundlebranchesintotheventricularmyocar
-
dium,producingtheQRScomplex.Theleftventricle(LV)ismuchthickerthantherightandthusgenerates
morevoltage.LVdepolarizationdominatestheQRScomplex.Theventriclesarethenrepolarized,producing
theTwaveontheECG.Normally,novoltageisapparentbetweentheendoftheQRSandtheTwave.This
STsegmentmayshiftupordownwithmyocardialischemia.
BaselineData
1. Check the distance (that is to say, the time) between two R waves. (The R wave is
the dominant and easily identified positive (upright) wave or deflection in the QRS
complex [see Fig 1.1].) That is the time for one cardiac cycle, or one heartbeat, and
it is called the RR interval. If the RR interval is 5 large squares, or 1 second, then
one heartbeat takes 1 second, and the rate is 60 beats/min. If the RR interval is 4
squares, or 0.8 sec/beat, then the heart rate is 60 sec/min divided by 0.8 sec/beat,
which equals 75 beats/min. Three squares: 60 ∏ 0.6 = 100 beats/min.
2. A simpler way to do the arithmetic, and the way I determine rate quickly, is to
measure the number of large squares between R waves, then divide that into 300:
for 2 large squares, rate = 150 beats/min; 3 squares, rate = 100 beats/min;
4 squares, rate = 75/min; 5 squares, rate = 60/min; 6 squares, rate = 50/min;
5.5 squares, rate = between 50 and 60/min. When the rhythm is regular, I select
an easily identifiable R wave that falls on, or near, a boldly scored line, then count
the number of large squares to the next R wave. It is a crude but fast way to
measure rate, but it does not work when the rhythm is grossly irregular. In most
cases, it allows you to determine quickly whether the patient has a normal rate,
bradycardia (less than 60 beats/min), or tachycardia (more than 100 beats/min).
Intervals
After emphasizing the importance of following the reading protocol (see Table 1.1), I
am already violating it by considering intervals before rhythm. This is useful, however,
because the intervals are at times necessary to determine rhythm. First, let us review
events of the normal cardiac cycle and the basic ECG nomenclature.
Depolarization of the SA node normally initiates the cardiac cycle (see Fig 1.3). This
neural structure is small, and its depolarization generates a small amount of current
that cannot be seen on the surface ECG (e.g., the 12-lead ECG measured from the
surface of the body). The wave of depolarization spreads through both left and right
atria, producing the P wave (see Fig 1.3).
Although the atria and ventricles have a broad area of surface contact, they are
effectively insulated from each other by connective tissue. The wave of depolarization
from the atrium is funneled through what I think of as a hole in the insulation, but it
is actually specialized conducting tissue called the atrioventricular (AV) node. Current
moves rapidly along nerves and fairly quickly through heart muscle. But the AV node
puts the brakes on the wave of depolarization. This slowing creates a delay between
atrial depolarization and ventricular depolarization. A pause in the AV node gives the
atria time to contract, providing the final increment of ventricular filling. According to
Dr. Starling, that is important; he discovered that greater ventricular volume—or indi-
vidual muscle fiber length—at the beginning of ventricular contraction produces stron-
ger contraction.
PR Interval
The interval that includes a measure of the AV node conduction delay is the PR inter-
val (see Fig 1.3). It is often easier to identify the beginning of the P wave than its end,
50PracticeECGs:InterpretationandReview
and by convention, this interval is measured from the start of the P wave. The interval
thus includes the time of atrial depolarization, the P wave itself, and the delay during
AV node conduction (roughly the time from the end of the P wave until the beginning
of the QRS complex). However, when the PR interval is prolonged, it is usually a result
of delayed AV node conduction; I know of no condition that lengthens the P wave
enough to cause prolongation of the PR interval.
A common question is which ECG lead to use for measuring the PR or other intervals.
What you are trying to measure with the PR interval is the time from initiation of
atrial depolarization until the beginning of ventricular depolarization. There are slight
variations in the sensitivities of particular ECG leads for recording the onset of the P
wave, and which lead is most sensitive will vary from patient to patient. It makes sense
to use the lead that records atrial depolarization earliest and ventricular depolarization
earliest.
Do you get the feeling that these are rough measurements, despite the fact that we
are dealing with milliseconds and microvolts? The truth is that they are, and that the
surface ECG is a crude tool. As a practical matter, measure intervals from a lead where
the onset of the waves—P and QRS—is well defined, and where the interval seems
longest. This general rule applies to the measurement of all intervals.
The normal PR interval ranges from 0.12 to 0.22 second (see page 1). First-degree
atrioventricular block (1° AV block) is defined as a PR interval of 0.22 second or more.
QRS Duration
Ventricular depolarization produces the QRS complex, the largest deflection on the
ECG (Fig. 1.4, and see Fig 1.3). As a rule, the voltage generated is proportional to the
amount of muscle depolarized, and the ventricles contain the bulk of cardiac muscle.
QRSnomenclature.AnypositivedeflectionisanRwave.AninitialnegativedeflectionisaQ
wave.AnegativedeflectionfollowinganRwaveisanSwave.Small,low-voltagedeflectionsmaybedesig
-
natedwithlowercaseletters.WhentherearetwoRwavesseparatedbyanSwave,thesecondmaybe
referredtoasR’(Rprime).
BaselineData
QRS nomenclature may seem confusing at first, but it follows quite simple conventions
(Fig 1.4).
The QRS duration, or interval, is a measure of the time it takes to depolarize the two
ventricles. Look again at Figure 1.3. Current exits the AV node and the His bundle and
moves simultaneously through the infranodal bundle branches. Normally, the ventricles
are activated at the same time, and the time of ventricular depolarization is roughly the
duration of the QRS.
On the surface ECG, measure the QRS duration where it seems longest and where
the beginning and end of the QRS are obvious. The normal duration is less than 0.12
second (3 mm). There are no illnesses that cause pathologic shortening of the QRS
complex.
T Wave and the QT Interval
Repolarization, or the return of muscle to its resting state, spontaneously follows depo-
larization in heart muscle. Repolarization of the thin-walled atrium produces no appar-
ent deflection on the surface ECG. Repolarization of the ventricles produces the T wave.
This usually has the same axis as the QRS complex; that is to say, in ECG leads where
the QRS complex is positive, the T wave is positive as well.
The QT interval is measured from the beginning of the QRS complex to the end of
the T wave (see Fig 1.3). Why measure from the beginning of the QRS, apart from
convention? It is probably because the beginning of the QRS often is easier to identify
than the end, and the QRS complex is short relative to the duration of the QT interval.
Measure the QT interval using the lead where it seems longest.
The normal duration of the QT interval varies with heart rate. The corrected QT
(QTc) is calculated using Dr. Bazett’s formula:
QTc QT RR interval= ÷
The RR interval, or the duration of one cardiac cycle, is a measure of heart rate.
Therefore, when the heart rate is 60 beats/min, and the RR interval is 1 second, the
QTc equals the measured QT. When the heart rate is greater than 60 beats/min and the
RR interval is less than 1 second, the QTc will be greater than the measured QT. Most
ECG manuals provide tables that give the top-normal QT (measured) for a given heart
rate, and these tables are based on Bazett’s formula with a top normal QTc that is
roughly 0.45 sec. The normal range varies with age and gender.
There is a quick and easy method for determining whether the QT interval is
normal, and it is the method I use when plowing through a stack of ECGs. If the mea-
sured QT is less than half the RR interval, then it is probably normal. If it is clearly
longer, then it is probably abnormal. Using this shortcut, my ECG interpretation
usually reads “QT normal for the rate” or “QT prolonged for the rate.” In borderline
situations I calculate the QTc. The QTc provided by the ECG computer is occasionally
inaccurate. Particularly with rapid heart rates, there is a tendency to overdiagnose QT
prolongation, even with careful measurement.
The T wave may contain a second hump, or even a separate wave, which is called
0 50PracticeECGs:InterpretationandReview
the U wave, and this is a part of the ventricular repolarization process. It may be a
normal finding. There is general agreement that it should be considered a part of the T
wave when thinking of QT, or QTU, prolongation. Hypokalemia, especially in combina-
tion with hypomagnesemia, causes an increase in U wave amplitude and prolongation
of the QTU interval.
QT interval prolongation is important. You will miss it unless you look for it on
every ECG you read. One place you will see it is on Board exams. Conditions and
drugs that prolong the QT interval are summarized in Table 1.2.
ConditionsandDrugsAffectingECGIntervals
PR °AVblock Digoxin,
b-adrenergicblockers,calcium
channelblockers,intravenousadenosine
QRS Ventricularconductionabnormalities, Quinidine,flecainide,propafenoneand
includingbundlebranchblock; otherantiarrhythmics;extreme
pre-excitation hyperkalemia
QT/QTU Myocardialischemia,hypothermia, Quinidine,procainamide,disopyramide,sotalol,
intracranialbleeding,longQT amiodarone,phenothiazineandphenothiazine
syndrome derivatives,erythromycin;hypokalemia,
hypomagnesemia,hypocalcemia
Recall the shape of the action potential of isolated nerve or muscle cells.
Repolarization (the return of the cell membrane to resting potential after depo-
larization) is a brief event, a sharp downward deflection. However, the repolar-
ization wave on the surface ECG is broad. That is because the T wave is generated
by repolarization of the large population of cardiac cells, some of which repolarize
early and others much later. Doesn’t the T wave look like a bell-shaped curve?
In a sense it is, with the average cell repolarizing at the peak of the T wave. A
broader T wave indicates greater heterogeneity of the repolarization process
among cardiac muscle cells so that it takes longer (electrophysiologists call this
temporal dispersion of refractoriness).
This is clinically important because increased heterogeneity of repolarization
is the substrate for reentry, which is the mechanism of most ventricular tachyar-
rhythmias. A long QT interval (a measure of the duration of repolarization) may
identify the patient at risk for ventricular arrhythmias and sudden death (Table
1.2).
The QT prolongation of hypocalcemia is an exception, with somewhat less
risk. That is probably because the heterogeneity of ventricular repolarization is
less affected. This is the only cause of QT prolongation where the duration of the
T wave is not prolonged—a normal T wave just occurs later.
BaselineData
Rhythm
My purpose is to help the student read through a stack of ECGs in the heart station
(and look good to the attending). I will review selected rhythms common in this setting,
but I will not attempt a comprehensive discussion of the rhythm abnormalities that
you will encounter in telemetry units.
Sinus Rhythm and Sinus Arrhythmia
Normal sinus rhythm is a regular rhythm between 60 and 100 beats/min, with a P
wave before each QRS complex and a QRS after each P wave. A faster rate defines
tachycardia and a slower rate, bradycardia. The term sinus indicates that the rhythm orig-
inates in the sinoatrial (SA) node, that there is atrial depolarization (a P wave before
each QRS), and that atrial contraction precedes ventricular contraction.
When you are excited, or when you walk up stairs and are short winded and your
pulse is 120 beats/min, you have sinus tachycardia. This usually is a benign rhythm,
but not always. It is a normal response of healthy people to exercise. But sinus
tachycardia in a patient who is at rest and pain free the day after an MI may indi-
cate severe left ventricular dysfunction. Cardiac output = stroke volume ¥ heart
rate. A depressed left ventricle generates less stroke volume, and increasing the
rate is the first compensatory response to maintain output. Although a heart rate
>90 beats/minute does not require specific treatment, it is a marker of decom-
pensation and poor prognosis in patients who have had an MI and in those with
congestive heart failure. Do not overlook other illnesses that may cause sinus
tachycardia, such as thyrotoxicosis, anemia, and fever. It may also be caused by
drugs, such as thyroid hormone, catecholamines, caffeine, and amphetamines.
Sinus bradycardia is a common finding. In the absence of conduction abnor-
malities, when all the intervals are normal, bradycardia at rest is a normal vari-
ant. It usually indicates good cardiovascular fitness, and it is common in trained
athletes. It can be a drug effect (digitalis, b-adrenergic blockers, or the calcium
channel blockers diltiazem and verapamil). A variety of illnesses can cause sinus
slowing, including the sick sinus syndrome, hypothyroidism, sleep apnea, and
other conditions that cause hypoxemia. Vasovagal attacks may include profound
sinus bradycardia, sinus pauses, and syncope.
During the respiratory cycle, the vagus nerve is intermittently activated, producing a
beat-to-beat variation in heart rate. On the 12-lead ECG (which is a relatively short
rhythm strip), this is seen as a variable RR interval. When pronounced, it may affect
your quick and easy calculation of heart rate using the technique just described. Be
aware of this, but do not worry as long as the rate is within the normal limits.
Sinus arrhythmia usually indicates good cardiovascular health. It disappears when
the heart is sick, as in the case of heart failure. The autonomic nervous system
2 50PracticeECGs:InterpretationandReview
compensates for low cardiac output by suppressing the parasympathetic nervous
system as well as increasing sympathetic tone. Resting heart rate increases. In addition,
the vagus nerve is not activated during the respiratory cycle, so there is little if any
variation in RR intervals. The rhythm becomes perceptibly more regular.
Precise quantification of sinus arrhythmia, or heart rate variability (HRV), has emerged
as a noninvasive test for increased risk of ventricular arrhythmias. It is not that vagal
activity prevents dangerous ventricular arrhythmias. Rather, an active vagus nerve
indicates good left ventricular function and therefore a low risk of arrhythmias. Those
with low HRV (reduced vagal tone) usually have poor left ventricular function and an
increased risk of ventricular arrhythmias and sudden cardiac death. HRV may be mea-
sured by calculating the mean and standard deviation of a large number of RR inter-
vals; the standard deviation serves as a measure of the variability.
Heart Block
Block can be a confusing term in cardiovascular medicine. Blocked arteries, blocked
valves, and blocked nerve conduction are different illnesses, and they may be confused
by patients (and medical students). The term heart block usually refers to interruption
of nerve conduction. It is an electrical problem, not one of fuel lines or valves
(although these conditions may coexist).
Nerve conduction can be interrupted, or blocked, at any level of the cardiac nervous
system (Fig 1.3). Block is uncommon within the SA node or in the body of the atrium.
But it is quite common in the AV node and in the nerves below the AV node (Fig 1.3).
These infranodal nerves include the His bundle, the bundle branches and their major
divisions, and the small terminal Purkinje fibers. The infranodal nerves may be referred
to as the His-Purkinje system.
Blocked conduction may alter intervals and may cause bradycardia. When block is
complete, there is no transmission to structures distal to the block, but the heart rarely
stops. Instead, an auxiliary pacemaker just below the level of block takes over. The
intrinsic rate (the rate of spontaneous depolarization) of the takeover pacemaker is
progressively slower the farther it is from the SA node. Control of heart rate reminds
me of the children’s game, King of the Mountain. Pacers highest on the mountain,
nearest the SA node, get the first chance to rule. When they fail, those just below take
over. As you go lower down the mountain, the pacers are slower.
For example, when complete block occurs in the AV node, a pacemaker in the His
bundle, just below the AV node, takes over with an intrinsic rate of 30 to 45 beats/
In addition to heart disease, autonomic dysfunction may also reduce heart rate vari-
ability, but with no increased risk of ventricular arrhythmias. This generally
occurs in illnesses that cause peripheral (sensory) neuropathy, including alcohol-
ism, diabetes, uremia, and Guillain-Barré syndrome. Dysfunction of medullary
centers that control autonomic function may also reduce heart rate variability,
such as cerebral hypoxia. It is a minor criterion for determining brain death.
BaselineData
min. It would be hard to exercise with a heart rate that slow, but syncope is uncom-
mon. If complete block occurs farther down, within the septum and beyond the divi-
sion of the two bundle branches (see Fig 1.3), the takeover pacemaker is in the body
of the ventricles. These deeper pacers have a much slower intrinsic rate, occasionally as
slow as 10 to 20 beats/min. In this case, syncope and even sudden death are more
likely.
From this outline of general principles, you begin to see that the level of block
determines prognosis, and identification of this level is critical. Now we turn to specific
ECG findings and clinical situations.
First-degree AV block is defined as a PR interval of 0.22 second or more, and without
variation (Fig 1.5). It is caused by a delay in conduction in the AV node. Increased
vagal tone, hyperkalemia, digitalis, calcium blockers (particularly diltiazem and vera-
pamil), and b-adrenergic blockers all may slow AV node conduction. It is common in
elderly patients, who may have degeneration of the AV node in the absence of isch-
emic heart disease. In other patients, ischemia may injure the AV node and either
delay or block conduction. The right coronary artery usually supplies the AV node as
well as the inferior wall of the heart, and AV nodal block is common with inferior
myocardial infarction (MI).
In addition to a slower intrinsic rate, takeover pacemakers from within the body
of the ventricle are less responsive to the autonomic nervous system. A pace-
maker in the AV node, or just below it, usually responds to catecholamine infu-
sion with an increase in rate. But deeper, ventricular pacemakers are unresponsive
to sympathetic stimulation, and heart rate does not increase. Furthermore, drugs
that suppress premature ventricular contractions, such as lidocaine, may also
suppress a takeover pacemaker originating from ventricular muscle. I recall an
inexperienced colleague treating “slow ventricular tachycardia” with lidocaine,
and the patient developed asystole.
An underappreciated physical finding that accompanies PR interval prolongation
is a soft first heart sound (S
1
). Because of delayed conduction between atria and
ventricles, contraction of the ventricle is much later than usual. During this delay,
atrial contraction finishes, and the mitral and tricuspid valves drift toward the
closed position. When the ventricles finally contract the valves do not have as
far to travel, so the closure sound is softer. This is one of the few causes of a
soft S
1
.
With second-degree AV block, some beats pass through the AV node to the ventricles
but others do not. This follows a pattern: when every other P wave captures the
50PracticeECGs:InterpretationandReview
ventricle (producing a QRS complex), the patient is said to have 2:1 block. When every
third P wave is conducted through the AV node, it is 3:1 block; and when two of three
P waves are conducted, it is 3:2 block.
Second-degree heart block is further classified into two types: Mobitz I and II. This
is a source of confusion. I find it easier to remember without the Mobitz designations,
instead thinking anatomically of where the conduction system block occurs.
Mobitz I block occurs within the AV node (exceptions are rare.) Injury to the node
causes it to tire with each succeeding beat until it is so tired that a P wave is com-
pletely blocked. On the ECG, we observe the Wenckebach phenomenon: progressive
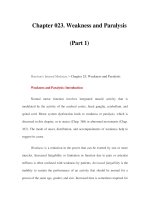
Second-degreeAVblock,MobitztypeI(orWenckebach).ThelevelofblockistheAVnode.
ThereisprogressivelengtheningofthePRintervaluntilthePwaveisnotconducted.Afterthedropped
beat,thePRintervalisshort(theAVnodehashadtimetorecuperate).Anadditionalfeature,notmen
-
tionedinthetext,isprogressiveshorteningoftheRRintervalbeforethedroppedbeat.NotethattheQRS
complexisnarrow,moreevidencethatthelevelofblockistheAVnode.
Think of Mobitz I or Wenckebach when you see group beating (groups of QRS
complexes regularly separated by pauses). Then look for progressive prolongation
of the PR, then a P wave not followed by a QRS, and then a shorter PR interval
following the blocked beat. The diagnosis is supported by a narrow QRS complex,
since the level of block is the AV node.
First-degreeAVblock.ThePRintervalislongerthan0.22second,anditdoesnotvary.
BaselineData 5
prolongation of the PR interval until there is a P wave that is blocked and not followed
by a QRS (Fig 1.6). Notice that the PR interval of the beat following the blocked beat,
or pause, is shorter. The AV node apparently recuperates during the pause. Often this
short PR is the best evidence of Wenckebach, and can be used to make the diagnosis
even when progressive PR prolongation is subtle and not certain.
Mobitz I block occurs at the level of the AV node, and the conduction system below
the node may be normal. In fact, a normal QRS duration excludes block below the AV
node. On the other hand, a wide QRS does not define block as infranodal. It is possible
for a patient with a preexisting intraventricular conduction abnormality (and wide
QRS) to develop AV nodal disease.
Mobitz II block, also a form of second-degree block, is caused by block below the AV
node. The AV node may be healthy. With Mobitz II there is no progressive prolongation
of the PR interval in the beats preceding the blocked beat (Fig 1.7). Because the
infranodal conduction system is diseased, the QRS is wide, usually meeting criteria for
bundle branch block. A narrow QRS excludes infranodal heart block. Mobitz II block
often precedes symptomatic, complete heart block (see Fig 1.7) and is an indicator for
pacemaker therapy.
Mobitz I second-degree AV block can be severe enough that every other beat is blocked
(e.g., 2:1 AV block). This would eliminate the variable PR interval as a diagnostic
marker. In fact, 2:1 AV block is a common rhythm with digitalis toxicity; it is Mobitz I,
as the level of block is the AV node. How do you know whether 2:1 block is Mobitz I
or Mobitz II? One way is to get a long rhythm strip: with Mobitz I block, there may be
brief sections where block will be less severe, with 3:2 or 4:3 conduction and typical
PR interval findings of the Wenckebach phenomenon.
Another way to tell is to focus on the QRS duration. I repeat this because it is
important (it will be the key to answering a Board question). When block occurs at the
level of the AV node, the infranodal conduction system usually is healthy, the ventri-
cles are activated in the normal sequence—that is, simultaneously—so the QRS dura-
tion is normal. When block occurs below the AV node (Mobitz II), the patient
invariably has an intraventricular conduction abnormality such as bundle branch block,
and the QRS duration is long.
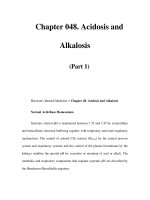
Second-degreeAVblock,MobitztypeII.Thepatientinitiallydropsasinglebeat,andthis
droppedbeatisanexampleofMobitzIIblock.Hethengoesintocompleteheartblock.Thelastbeatis
aventricularescapebeat.ThePRintervalofconductedbeatsisfixed;thereisnoevidenceofthe
Wenckebachphenomenon.Inaddition,theQRScomplexiswide;the2-leadECGshowedbifascicularblock
(Chapter2).AwideQRS,indicatingabnormalintraventricularconduction,isinvariablyseeninpatients
withinfranodalheartblock.
6 50PracticeECGs:InterpretationandReview
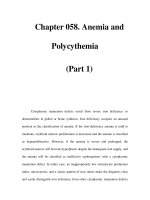
Hisbundlerecordingsfromthreepatients.ThegoalofEPSwhenevaluatingheartblockisto
determinetheanatomiclevelofconductiondelay.TheHis(H)spikeisgeneratedbydepolarizationofthe
Hisbundle,justbelowandadjacenttotheAVnode,andisrecodedwithabipolarcatheterpositionednext
tothetricuspidvalve.TheHspikeessentiallydividesthePRintervalintoitsAVnodal(theAHinterval)and
infranodal(HV)portions.Patient
:thePRintervalisnormalasistheHVinterval(<55msec).Patient:A
patientwithfirst-degreeAVblock(longPR).MarkedprolongationoftheAHintervalindicatesthatthelevel
ofblockistheAVnode.Infranodalconduction(theHVinterval)isnormal.Patient
:Anotherwithfirst-
degreeAVblock.TheAHintervalisnormal,sothereisnodelayinconductionintheAVnode.Thepro
-
longedHVintervalindicatesinfranodalconductiondelay.Withinfranodaldiseasethereisahigherriskof
developingsymptomaticheartblock.(ReproducedwithpermissionfromTaylorGJ.
Primary care management
of heart disease.St.Louis,MO:Mosby,2000.)
Here is how the electrophysiology laboratory assesses heart block. As noted, an
elderly person with infranodal disease—bundle branch block—may develop a
sick AV node and Mobitz I block. Whether it is really Mobitz I or II block can be
sorted out in the electrophysiology lab, especially when there is uncertainty about
a need for pacemaker therapy.
Depolarization of the proximal bundle of His, adjacent to the AV node, gener-
ates a small current that is not apparent on the surface ECG. This “H spike” can be
measured with an electrode that is near it, using an electrode catheter positioned
in the lower right atrium next to the tricuspid valve. The H wave allows parti-
tion of the PR interval into its nodal, and infranodal, or infra-His spike segments
(Fig 1.8). Block in the node causes A-H interval prolongation, and block below
the node—below the proximal His—causes H-V interval prolongation. Infranodal
block identified by a long H-V interval is an indication for a pacemaker.
BaselineData
Complete atrioventricular block is just that; nothing gets through to the ventricles.
There are P waves and QRS complexes, but they are unrelated; this is called AV dissocia-
tion (Fig 1.9). The term is used when P waves are not followed by QRS complexes; the
atria and ventricles operate independently. Complete heart block is just one of the con-
ditions where this occurs, and you will encounter other examples in Chapter 2.
How do you know whether block occurs within the AV node itself, or in the
infranodal conduction system? The issues are those discussed above with 2:1 AV block.
When block is at the level of the AV node, the takeover pacemaker is just below the
node, within the His bundle and before the division into the bundle branches (see Fig
1.3). The sequence of ventricular activation is therefore normal, and the QRS duration
is normal (unless there is coexisting bundle branch block). Furthermore, the takeover
pacemaker is relatively high in the conduction system and has an intrinsic rate ranging
from 35 to 45 beats/min. The rate would probably increase with catecholamine infu-
sion or administration of atropine.
When complete block develops in the infranodal conduction system, the takeover
pacer is in the body of the ventricle, the QRS is wide, and the rate is low. This may be
called an idioventricular rhythm, but it should not be mistaken as a ventricular
Threepatientswithcompleteheartblock.Theatriaarebeingdischargedataregularrate(P
waves)andtheventriclesataregularrate(QRScomplexes).Thetworhythmsappearunrelated;thereis
AV
dissociation.YoumaybetemptedtosaythatPwavescomingbeforeQRScomplexescouldbeconducted,
butthesedonotaltertheregularityoftheventricularescaperhythm.Patients
andhavewideQRS
complexesandslowventricularrates;theyprobablyhaveblockbelowtheAVnode,withatakeoverpace
-
makerinthebodyoftheventricle.Patient
hasamorerapidescaperate(55beats/min),andtheQRS
complexisnarrow;thelevelofblockistheAVnode.
50PracticeECGs:InterpretationandReview
arrhythmia. Suppressing it with an antiarrhythmic agent could lead to asystole and
death. The idioventricular pacing rate does not increase following treatment with atro-
pine or catecholamines.
Complete heart block may develop at the level of the AV node, but is uncommon.
The usual situation is congenital heart block that is detected on a routine ECG in an
asymptomatic young person (Fig 1.9C). The patient usually has a history of slow pulse,
as the takeover pacemaker in the upper His system has a rate in the mid-40s. The
heart rate may increase with exercise, although the response is subnormal. The QRS
duration is normal. Pacemaker therapy is not required in the absence of symptoms.
Heart block is a common complication of inferior MI, and it is uncommon with ante-
rior MI (Fig 1.10). It helps to remember how the location of block determines the
severity of the arrhythmia and prognosis. Heart block with inferior MI probably has
dual causation. First, patients with inferior MI have high vagal tone, possibly related to
the Bezold-Jarisch reflex. Second, there may be ischemia of the AV node, as the AV
node is supplied by the same artery that feeds the inferior wall. You may expect the
usual features of AV nodal block: PR interval prolongation and Mobitz I patterns are
common, the QRS is narrow, and the takeover pacer is fairly rapid if block is complete.
In addition, the AV node usually has collateral blood flow from other arteries, so per-
manent injury is uncommon and recovery of normal conduction is the rule. Permanent
pacemaker therapy is rarely needed, although temporary pacing is indicated for symp-
tomatic bradycardia. The heart rate usually increases with atropine therapy.
Anterior MI may injure the interventricular septum below the AV node, so the
pattern of heart block is infranodal: Mobitz II block is the rule, the QRS is wide, and,
when block is complete, the escape rhythm is slow. An anterior infarction large enough
to cause infranodal block is usually huge, spontaneous recovery from the heart block is
rare, and the prognosis is terrible. These patients need pacemakers, but despite pacing
they do poorly because of the degree of LV injury.
Atrial Arrhythmias
Atrial arrhythmias may be chronic or acute. They are common, and you will see them
almost daily when reading routine ECGs.
Infranodal complete heart block is common among elderly patients, and it usually
causes syncope. It may also present as increased fatigue or heart failure. When I
ask students about the cause of the arrhythmia the usual response is coronary
artery disease (the default response when in doubt). But infranodal heart block
in the elderly is rarely a complication of ischemic heart disease. In this age group,
the cause is fibrotic degeneration of the infranodal nerves (“frayed wires”). The
coronary arteries are often normal. A review of old ECGs usually shows evidence
of infranodal conduction disease, with bundle branch block (Chapter 2).
Infranodal complete heart block is an indication for pacemaker therapy.
BaselineData
HeartblockafterMI.ItisimportanttodistinguishbetweenblockattheleveloftheAV
nodeandblockbelowtheAVnode.ThetakeoverpacemakerwithAVnodalblockhasanadequateintrinsic
rateandrespondstoatropine.Deepventricularpacemakersthattakeoverafterinfranodalblockareless
responsiveandaretooslow.
Twopatientswithprematureatrialcontractions.:AnectopicPwaveisseenbeforethe
prematureQRS.
:BlockedPAC,causingapause.Theectopicwaveisseenasadistortionofthepreceding
Twave.Thisisacommoncauseofpauses.Inmostcases,theectopicPwaveishardertosee;lookforsub
-
tlechangesintheprecedingTwave.
Usually premature atrial contractions (PACs), also called PABs (beats) or APBs, are easy
to recognize. The premature beat has a narrow QRS, and the QRS is identical to
normal beats. A misshapen, ectopic P wave may precede it (Fig 1.11).