Basic Electrocardiography Normal and abnormal ECG patterns - Part 7 pot
Bạn đang xem bản rút gọn của tài liệu. Xem và tải ngay bản đầy đủ của tài liệu tại đây (1.5 MB, 18 trang )
P1: OTE/SPH P2: OTE
BLUK096-Bayes de Luna June 7, 2007 21:50
102 Chapter 11
VL it is probable that the occlusion of the artery is in the mid-low part of LAD
after first–second diagonal and also the first septal branches. This explains
that myocardial infarctions with Q waves in precordials but not in I and VL
are often not very extensive (apical MI) [51,52] and involve only the mid-low
part of septum and anterior wall and usually also the apex because the LAD
is long and wraps the apex (segment 17) [57].
r
The correlation between CMR and ECG patterns has allowed us to realize
that there are seven ECG patterns thatmatch verywell withseven ECG areas
of necrosis located in different areas of the left ventricle. This is the basis of
our new classification of Q-wave MI that we will explain later on (Table 15)
[33–35].
r
Finally, the recent consensus regarding the diagnosis of infarction by the
ESC/ACC (European Society of Cardiology/American College of Cardiology)
[49,50] accepts the diagnosis of infarction if troponin levels increase, accom-
panied by any of the other criteria listed in Table 15, not per se requiring the
presence of electrocardiographic changes. Consequently, there are infarctions
that involve less than the amount of necrotic tissue needed to modify the
ECG [50]. This implies that many unstable anginas are turned into infarctions
(microinfarctions or ‘necrosettes’). Until this definition was accepted, it was
uncommon to find a normal ECG in the acute stage of an infarction, and if it
occurred it was due to small LCX or RCA artery occlusion.
Concept of Q-wave infarction
In Figure 85 we can observe the most frequent changes in the T wave, ST seg-
ment and QRS complex that appear in the evolutionary course of an acute
coronary syndrome with ST-segment elevation evolving to a Q-wave myocar-
dial infarction (Figure 85). Subendocardial ischaemia pattern—tall and peaked
T wave (hyperacute phase)—followed by subepicardial injury pattern—ST el-
evation or equivalents—the Q wave of necrosis accompanied by the negative
Table 15 New criteria proposed for the diagnosis of infarction [49].
Either of the following two criteria is sufficient to establish the diagnosis of an evolving or recent
acute infarction
1 Typical increase and gradual decrease in troponins levels
∗
or other specific markers (CK-MB) of
myocardial necrosis in the presence of at least one of the following:
r
Symptoms of ischaemia (angina or equivalent)
r
Development of pathologic Q waves in the ECG (Table 14)
r
Electrocardiographic changes indicative of ischaemia (ST-segment elevation or depression and
or T wave inversion)
r
Interventional procedures in coronary arteries (e.g., PTCA)
2 Acute infarction anatomic-pathological changes
∗
It is convenient to remember the causes of a troponine increase in the absence of ischaemic heart
disease, which include heart failure, renal failure, hypertensive crisis, etc.
P1: OTE/SPH P2: OTE
BLUK096-Bayes de Luna June 7, 2007 21:50
Electrocardiographic pattern of ischaemia, injury and necrosis 103
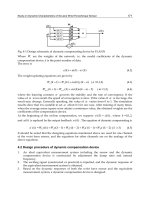
Figure 86 (A) Normal ventricular depolarisation; being very rapid in the subendocardium does not
generate detectable potentials as this zone is very rich in Purkinje fibres (QS in 1 and 2). Starting
from the border zone with subepicardium (3), morphologies with an increasing R wave (rS, RS, Rs)
are registered (3 to 5) up to an exclusive R wave in epicardium (6). As a consequence, in the case
of an experimental necrosis, the Q wave will be recorded only when it reaches subepicardium, as
the vectors of necrosis will move away from the more necrotic area when this is more and more
large. This originates qR morphology in 3, QR in 4 and 5, up to QS if the necrosis is transmural.
(B) This explains how clinical transmural infarction originates QS morphology while (C) an
infarction affecting subendocardium and a part of subepicardium may give rise to QR morphology
without being necessarily transmural. Finally, (D) an infarction affecting subendocardium and a
part of subepicardium, but in the form of patches, with necrosis-free zones, allows early formation
of depolarisation vectors that will be recorded as R waves although of small voltage.
T wave of subepicardial ischemia appear in a sequential manner. Usually more
than one of these patterns exist at the same time.
TheSTE-ACSusuallyevolvestoaQ-waveMIthatisoftentransmural(Figure
86B). However, a pathologic ‘q’ wave may be observed in non-transmural
infarctions (Figure 86C) as well, and occasionally, a tall R wave instead of a
pathologic ‘Q’wave may be observed as it appears in V1–V2 leads as a mirror
image, or a decrease of R wave voltage in V6 in the case of a transmural lateral
or inferolateral infarction of basal areas or involving areas of subepicardium
in form of patches (Figure 86D).
r
Transmural infarction may be seen in patients with and without Q waves
and the same may occur in cases of nontransmural infarction.
r
The presence of Q wave is more a marker of extensive than transmural
infarction.
P1: OTE/SPH P2: OTE
BLUK096-Bayes de Luna June 7, 2007 21:50
104 Chapter 11
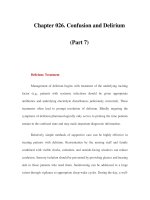
Figure 87 (A) Under normal conditions the global QRS vector (R) is formed by the sum of the
different ventricular vectors (1+2+3+4). (B) When a necrotic zone exists, the corresponding
vector (3 in the figure) has the same magnitude as before necrosis, but it is opposite in direction,
determining modifications of the direction of the global vector ( R
). (C) According to Wilson, the
necrotic zone is an electric window that allows us to record the QS morphologies recorded in the
left ventricular cavity.
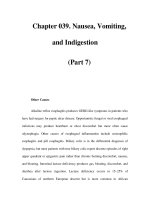
Mechanisms of Q wave
The appearance of the Q wave of necrosis may be explained [1] by the electri-
cal window theory of Wilson (Figure 87C) or by the formation of a necrosis
vector with the corresponding loop (Figure 88A and B). The vector of necro-
sis is equal in magnitude, but opposite in direction, to the normal vector that
would be generated in the same zone without necrosis. The onset of ventricu-
lar depolarisation changes when the necrotic area corresponds to a zone that
Figure 88 The necrosis vector is directed away from the necrotic zone. In inferior infarction it is
directed upwards (1-A) and in the anterior infarction, backwards (2-A). See at the bottom (B) two
examples of chronic myocardial infarction of anteroseptal and inferolateral zones.
P1: OTE/SPH P2: OTE
BLUK096-Bayes de Luna June 7, 2007 21:50
Electrocardiographic pattern of ischaemia, injury and necrosis 105
is depolarised within the first 40 ms of ventricular activation, which occurs in
a major part of the left ventricle except in the posterobasal parts.
Location and quantification of Q-wave myocardial infarction
Table 16 shows the correlation between leads with Q wave and area of
myocardial necrosis detected by CMR and the most probable place of
coronary occlusion responsible for MI [33–35]. However, in practice with new
treatments of acute phase very often the coronariangiography performed in
subacute or chronic phases usually shows a completely different coronary
pattern because even in the case of established necrosis the coronary artery
was lastly, at least partially, opened by treatment. We should bear in mind that
the current treatment of acute coronary syndromes may lead to a reduction
in infarct size (even 40–50%). Occasionally, an infarction may even be aborted
and therefore usually there is a discrepancy between the presumed location
of the occlusion and the final necrotic zone.
Figure 89 shows the old and new concepts of MI of the inferolateral
zone, and Table 16 provides the new classification based on the concordance
between Q-wave location in different leads and area involved detected by
contrast-enhanced cardiovascular magnetic resonance (CE-CMR) correla-
tions (global agreement 0.88%) [34,35]. Furthermore, the specificity of criteria
of Q wave that we have used (see Table 14) is high and the sensitivity is also ac-
ceptable, although it is lower especially in the case of mid-anterior and lateral
MI (Table 16).
A quantitative QRS score systemwas developed by Selvester [55] to estimate
extension of myocardial necrosis especially in thecase of myocardial infarction
of the anterior zone. The most significant number of mistakes was due to the
fact that the score system considered that Q wave in V1–V2 implies septal
involvement including the basal area. As we have already stated, this is not
true because the first vector (r in V1–V2) is generated in the mid-low anterior
part of the septum, but not in the basal part. In spite of the global value of
this score to estimate the involved mass, currently the CE-CMR gives us a
much more exact measurement of chronic infarcted area in a particular case
[53,56,57].
Examples of seven ECG patterns in the case of myocardial infarction of
inferolateral and anteroseptal zones and its location detected by CE-CMR are
shown in Figures 90–96. The infarcted areas are in white, due to the retention
of gadolinium in these areas (see Table 16). The planes of the heart in the CMR
images are explained in the figure legends, according to Figure 55 (see also
Table 16).
Differential diagnosis of pathologic Q wave
The specificity ofthe pathologic Q wavefor diagnosing amyocardial infarction
is high, especially in adults older than 40 years. Nevertheless, we should bear
in mind that similar or the same Q waves can be seen in other conditions. We
should remember that the diagnosis of myocardial infarction is based not only
P1: OTE/SPH P2: OTE
BLUK096-Bayes de Luna June 7, 2007 21:50
106 Chapter 11
Table 16 Location of Q wave.
Infarction area Most probable
Name Type ECG pattern (CE-CMR) place of occlusion
Anteroseptal,
zone
Septal A1 Q in V1–V2
SE: 100%
SP: 97%
Apical–
anterior
A2 Q in V1–V2 to
V3–V6
SE: 85%
SP: 98%
Extensive
anterior
A3 Q in V1–V2 to
V4–V6, I and
aVL
SE: 83%
SP: 100%
Mid-
anterior
A4 Q (qs or qr) in
aVL (I) and
sometimes in
V2–V3
SE: 67%
SP: 100%
Inferolateral,
zone
Lateral B1 RS in V1–V2
and/or Q wave
in leads I, aVL,
V6 and/or
diminished R
wave in V6
SE: 67%
SP: 99%
Inferior B2 Q in II, III, aVF
SE: 88%
SP: 97%
Inferolateral B3 Q in II, III, Vf
(B2) and Q in I,
VL, V5–V6
and/or RS in V1
(B1)
SE: 73%
SP: 98%
P1: OTE/SPH P2: OTE
BLUK096-Bayes de Luna June 7, 2007 21:50
Electrocardiographic pattern of ischaemia, injury and necrosis 107
Figure 89 According to the classical concept, MI of inferoposterior wall may present Q in II, III, VF
(inferior MI), or RS in V1–V2 (posterior MI). The presence of both criteria is seen in the case of
inferoposterior MI. If the MI also encompasses the lateral wall the only ECG new criterion may be
the presence of abnormal Q wave in lateral leads or very low R in V6. Currently, the MI of
inferolateral zone may be clustered in three groups: Q in II, III, VF (inferior MI with or without the
involvement of the inferobasal segment – old posterior wall); RS in V1 and/or abnormal ‘q’ in
lateral leads (lateral MI). Inferolateral MI encompasses both criteria (see Figure 59).
Name
Q in V1–V2
Septal
ECG pattern
Most probable
place of occlusion
Infarction area (CMR)
Vector cardiographic loops
Type
Figure 90 Example of large septal MI (type A-1) ECG criteria (Q in V1–V2 with rS in V3), most
probable site of occlusion, CE-CMR images and VCG loops. The septal infraction is very
extensive encompassing the greatest part of the septal wall less the most inferior, at all
levels—basal (A), mid (B) and apical (C) on transverse plane. There is small extension towards
the anterior wall at mid and apical levels (arrows).
P1: OTE/SPH P2: OTE
BLUK096-Bayes de Luna June 7, 2007 21:50
108 Chapter 11
Name
ECG pattern
Most probable
place of occlusion
Infarction area (CMR)
Vector cardiographic loops
Type
Figure 91 Example of apical-anterior MI (Q wave beyond V
2
). In the horizontal plane (A) the
septal and apical involvement is seen. The sagital plane (B) shows that the inferior involvement is
even larger than the anterior involvement, and in the mid and low transverse transections,
especially in D, the septal and inferior involvement is seen.
on electrocardiographic alterations but also on clinical evaluation and enzy-
matic changes. The pattern of ischaemia or injury accompanying a pathologic
Q wave supports the idea that the Q wave is secondary to ischaemic heart
disease. However, in 5–25% of Q-wave infarctions (with the highest incidence
in inferior infarction) the Q wave disappears with time, therefore its sensi-
tivity for detecting old myocardial infarction is not high. The main causes of
pathological Q wave due to causes other than myocardial necrosis are listed
in Table 17.
Myocardial infarction without Q wave
Table 18 shows different types of myocardial infarctions without Q wave. The
most typical is the non-Q-wave infarction. In this case, diagnosis should be
based on the presence of typical clinical symptoms of acute ischaemia ac-
companied by enzymatic changes and repolarisation alterations (ST and/or
negative T wave) and sometimes the presence of fractioned QRS (notches and
slurring in mid–late QRS complex) but without necrotic Q wave appearance.
Figure 70 shows the evolutive changes that frequently appear in the case of
P1: OTE/SPH P2: OTE
BLUK096-Bayes de Luna June 7, 2007 21:50
Electrocardiographic pattern of ischaemia, injury and necrosis 109
Name
Q in V1–V2 to
V4–V6,
I and aVL
Extensive
interior
ECG pattern
Most probable
place of occlusion
Infarction area (CMR)
Vector cardiographic loops
Type
Figure 92 Example of extensive anterior MI (type A-3) (Q in precordial leads and VL with qrs
in L). Most probable place of occlusion, CE-CMR image and the VCG loops of this case. CE-CMR
images show the extensive involvement of septal, anterior and lateral walls, less the highest part
of the lateral wall (see B and C). The involvement of segments 7 and 12 explain that in this MI
there isaQinVLthat is not present in MI of apical–anterior-type (A). Oblique sagittal view (B).
Longitudinal horizontal plane view and C to E. Transverse view. The inferior wall is the only
spared. The LAD is not very large and therefore the inferior involvement is not extensive (see A).
Due to that there is QS in aVL and R in II, III and aVF together with Q in VI to V5.
non-Q-wave MI. The incidence of myocardial infarctions without Q wave in-
creases as some ACS with ST elevation do not develop Q wave due to throm-
bolytic treatment. The prognosis is worse when signs of residual ischaemia
exist.
Diagnosis of necrosis in the presence of ventricular blocks,
pre-excitation or pacemaker
Complete right bundle branch block (Figure 97)
In the chronic phase, since cardiac activation begins normally the presence
of an infarction causes an alteration in the first part of the QRS complex that
can generate a necrosis Q wave, just as in the cases with normal ventricular
conduction. Furthermore, in the acute phase the ST–T changes can be seen as
in the cases with normal activation. Patients with an acute coronary syndrome
P1: OTE/SPH P2: OTE
BLUK096-Bayes de Luna June 7, 2007 21:50
Name
Q (qs or qr)
in aVL(I)
and sometimes
in V2–V3
Mid-anterior
ECG pattern
Most probable
place of occlusion
Infarction area (CMR)
Vector cardiographic loops
Type
Figure 93 Example of mid-anterior MI (type A-4) (QS in VL without Q in V5–6), most probable
place of occlusion, CE-CMR image and the VCG loop in this case. CE-CMR images shows in
transverse plane mid-low-anterior and lateral wall involvement (B,C).
Name
RS in V1–V2
and/or Q wave in
leads I, aVL, V6
and/or
diminished R
wave in V6
Lateral
ECG pattern
Most probable
place of occlusion
Infarction area (CMR)
Vector cardiographic loops
Type
Figure 94 Example of lateral MI with RS in V1 (type B-1). See the most probable place of
occlusion, the CE-CMR image and the VCG loops. The CE-CMR images show that in this case
the MI involves especially the basal and mid part of the lateral wall (A–C) (longitudinal horizontal
and transverse planes) but not the apical part (D).
110
P1: OTE/SPH P2: OTE
BLUK096-Bayes de Luna June 7, 2007 21:50
Name
Inferior
B2 Q in II, III, aVF
ECG pattern
Most probable
place of occlusion
Infarction area (CMR)
Vector cardiographic loops
Type
Figure 95 Example of inferior MI (Q in II, III, VF) with involvement of segments 4 and 10 (A and
D), and rS morphology in V1. There is no lateral and septal involvement (E).
Name
Q in II, III, Vf(B2)
+
Q in I, VL, V5–V8
and/or
RS in V1 (B1)
Inferolateral
ECG pattern
Most probable
place of occlusion
Infarction area (CMR)
Vector cardiographic loops
Type
Figure 96 Example of inferolateral MI (Q in II, III, VF and RS in V1). The most probable place of
occlusion (RCA), the CE-CMR image and the corresponding VCG loops. The CMR images show
the involvement of inferior wall and also part of lateral wall. (A) Saggital-like transection showing
the involvement of inferior wall. (B–D) Transverse transections at basal, mid and apical level
showing also the lateral involvement especially seen on mid and apical level.
111
P1: OTE/SPH P2: OTE
BLUK096-Bayes de Luna June 7, 2007 21:50
112 Chapter 11
Table 17 Pathologic Q wave not secondary to myocardial infarction.
1. During the evolution of an acute disease involving the heart
1.1. Acute coronary syndrome with an aborted infarction
1.2. Coronary spasm (Prinzmetal angina type)
1.3. Acute myocarditis
1.4. Presence of transient apical dyskinesia that also shows ST-segment elevation and a
transient pathologic ‘q’ wave. Probably corresponds to an aborted infraction: Tako–tsubo
syndrome.
1.5. Pulmonary embolism
1.6. Miscellaneous: toxic agents, etc.
2. Chronic pattern
2.1. Recording artefacts
2.2. Normal variants: VL in the vertical heart and III in the dextrorotated and horizontalised
heart
2.3. QS in V1 (hardly ever in V2) in septal fibrosis, emphysema, the elderly, chest
abnormalities, etc.
2.4. Some types of right ventricular hypertrophy (chronic cor pulmonale) or left ventricular
hypertrophy (QS in V1–V2), or slow increase in R wave in precordial leads, or abnormal ‘q’
wave in hypertrophic cardiomyopathy, sometimes deep but narrow and usually with normal
repolarisation
2.5. Left bundle branch conduction abnormalities
2.6. Infiltrative processes (amyloidosis, sarcoidosis, tumours, chronic myocarditis, dilated
cardiomyopathy, etc.)
2.7. Wolff–Parkinson–White syndrome
2.8. Congenital heart diseases (coronary artery abnormalities, dextrocardia)
2.9. Pheochromocytoma
Table 18 Myocardial infarction without Q wave or equivalents.
1 Non-Q wave infarction
r
ST-segment depression and/or negative T wave: new ST ≥0.5 mm or new flat or negative T
wave.
r
Sometimes with the presence of changes in mid-late QRS (fractioned QRS).
2 Infarctions located in areas that do not originate Q wave of necrosis
a Atria (an isolated location never exists): infarction is usually present in an extensive area.
b Basal segments: often secondary to theocclusionof a non-proximalLCX or RCA (sometimes
with fractioned QRS).
c Right ventricle (usually does not present isolated): it is accompanied by an inferior in-
farction. It is secondary to occlusion of a proximal RCA before the take-off of the right ventricle
marginal branches.
d Microinfarction (enzymatic).
5 Aborted Q wave
r
Acute coronary syndrome with ST-segment elevation (evolving infarction) but with quite early
and efficient reperfusion. troponins levels will tell us whether it is an unstable angina or a non-
Q-wave infarction.
6 Q of infarctions that disappear during the follow-up
7 Masked Q wave
r
Ventricular block;
r
Wolff—Parkinson–White;
r
Pacemakers.
⎫
⎪
⎬
⎪
⎭
May sometimes show
a pathologic Q wave.
P1: OTE/SPH P2: OTE
BLUK096-Bayes de Luna June 7, 2007 21:50
Electrocardiographic pattern of ischaemia, injury and necrosis 113
Figure 97 A typical example of RBBB plus acute MI of anteroseptal zone.
with ST elevation, which in itscourseshowsacomplete new-onset right bundle
branch block, usually have the LAD occluded before the first septal and first
diagonal. This is explained by the fact that the right bundle branch receives
perfusion from S1.
Complete left bundle branch block (Figure 98)
In the acute phase, the diagnosis of myocardial infarction in the presence of
a complete left bundle branch block may be suggested by specific ST-segment
deviations (any ST elevation or huge ST depression in case of R morphology,
and any ST depression or huge ST elevation in case of rS morphology [58]).
In thechronic phase, ventriculardepolarisationstartsinthepartproximalto
the base of the anterior papillary muscle of the right ventricle. This generates a
depolarisation vector (vector 1) directed forwards, downwards and to the left.
Subsequently, transseptal depolarisation of the left ventricle generates vectors
2, 3 and 4. As a result, even if important zones of the left ventricle are necrotic
the overall direction of the depolarisation vector does not change, and these
vectors continue topoint from rightto left, impeding inscriptionof a Qnecrosis
wave. Nevertheless, evident ‘q’ waves in I, V6 or tall R waves in V1 may be
occasionally observed (Figure 98). The correlation of clinical and ECG changes
with enzymatic changes and changes in radionuclide studies [59] confirmed
that the presence of Q waves in I, VL, V5, V6 and R in V1–V2 leads is the most
specific criterion for diagnosing myocardial infarction in the presence of a left
bundle branch block in the chronic phase.
P1: OTE/SPH P2: OTE
BLUK096-Bayes de Luna June 7, 2007 21:50
114 Chapter 11
Figure 98 A typical ECG pattern of necrosis in the presence of a left bundle branch block.
Observe the pathologic ‘Q’ wave in I, VL and V6, ‘r’ wave in V1 and polyphasic morphology in
V4–V5.
Hemiblocks
In general, necrosis associated with the superoanterior hemiblock may be
diagnosed without problems. Usually, we may assess in the case of ECG with
left AQRS deviationand Q wave inII, III, VFwhether the myocardial infarction
is isolated or associated with the superoanterior hemiblock (SAH). The loop–
hemifield correlations explain that in the absence of SAH in lead II there is
Qr morphology and in its presence the morphology is an isolated QS pattern
especiallyofWtype(Figures99A and B). In somecases,mainlyinsmallinferior
infarctions, the superoanterior hemiblock may mask myocardial necrosis. The
initial vector (vector 1) is directed more downwards than normal as a result of
SAH and masks a necrosis vector of small inferior infarction (Figure 99C). The
inferoposterior hemiblock (IPH) may mask or decrease the inferior necrosis
pattern by converting QS or Qr morphology in II, III and VF into QR or qR
(Figure 100). It may also originate a small positivity in I and VL in the case
P1: OTE/SPH P2: OTE
BLUK096-Bayes de Luna June 7, 2007 21:50
Figure 99 (A) Isolated inferior myocardial infarction with
ˆ
AQRS directed to the left. Qr morphology seen in lead II shows that the rotation of the loop on the frontal
plane is completely clockwise and therefore there is the final r wave at least in lead II. (B) Inferior infarction associated with the superoanterior hemiblock (SAH). In
this case, the QRS loop in the frontal plane is first clockwise and afterwards counterclockwise. Observe the QS morphology in II lead without positive terminal
forces. This means that SAH is present. (C) Small inferior infarction associated with SAH, the first vector of SAH masks necrosis (rS in III and II). Right: the VCG
curves in the three cases.
115
P1: OTE/SPH P2: OTE
BLUK096-Bayes de Luna June 7, 2007 21:50
116 Chapter 11
IVRV
1
V
4
II VL V
2
V
5
III
FP
HP
SP
VF V
3
V
6
Figure 100 The ECG and VCG curves in a patient with inferior myocardial infarction associated
with the inferoposterior hemiblock (IPH). See Rs in I and qR in II, III, and AVF, with a very open
loop suggestive of the associated IPH.
of lateral infarction because the initial vector (vector 1 in the case of IPH) is
directed more upwards than usual as a result of IPH and mask the necrosis
vector of small lateral infarction.
Pre-excitation and pacemakers
It is difficult to diagnose the association of myocardial infarction in the pres-
ence of pre-excitation. Sometimes it may be suggested by evident changes of
repolarisation especially in the acute phase of ACS.
Also in patients with pacemakers the changes in repolarisation, especially
ST elevation, may suggest ACS [60]. In the chronic phase the presence of a
spike-qR pattern, especially in V5–V6, is highly specific but little sensitive
sign of necrosis.
P1: OTE/SPH P2: OTE
BLUK096-Bayes de Luna June 7, 2007 21:23
CHAPTER 12
Miscellaneous
Value of ECG in special conditions [1,5,21]
The most characteristic ECG patterns of different special clinical conditions as
ionic imbalance (A), hypothermia (B) and athletics (C) are shown in Figures
101–103 (see legends). Athletes may present first and even second degree AV
block of vagal origin and also rSr’ in V1 due to delay of activation of right
ventricular and sometimes some degree of right ventricular enlargement (see
Case 22).
ECG pattern of poor prognosis
Figures 104–106 show the most characteristic ECG patterns of genetically in-
duced conditions such as long QT syndrome (Figure 104), Brugada’ssyndrome
(Figure 105) and arrhythmogenic right ventricular dysplasia (Figure 106). The
most characteristic features of ECG in hypertrophic cardiomyopathy are strik-
ing signs of LV enlargement and the presence of abnormal ‘q’wave (see section
‘Left ventricular enlargement’ in Chapter 8 and Table 17).
ECG of electrical alternans [1] (Figure 107, Table 19)
Alternans of ECG morphologies signifies the repetitive and alternans change
in the morphology of the QRS complex, ST segment or, rarely, P wave. The
presence of certain changes in QRS morphology during sinus rhythm may oc-
casionally be observed in precordial leads, particularly in very thin persons
during respiration. True alternans of QRS complexes (change in morphol-
ogy without change of width) in patients with sinus rhythm is suggestive
of cardiac tamponade (Figure 107A). Alternans of QRS morphology may also
be observed during supraventricular arrhythmias, especially in patients with
WPW. Nevertheless, true alternans of QRS complexescan be confoundedwith
QRS changes appearing in the form of bigeminy such as alternans bundle
branch block, alternans WPW and ventricular bigeminy with very late ven-
tricular ectopic beats (in the PR). In these situations, two clearly distinct QRS-T
morphologies exist with different QRS width and sometimes with changes in
the PR interval.
Alternans of ST–T may be observed in the hyperacute phase of severe my-
ocardial ischaemia (Figure 107B), in the congenital long QT syndrome and in
significant electrolytic imbalance (Figure 107C).
Recently, T-wave alternans detected by microvoltage techniques has been
found to be a marker of poor prognosis in post-MI patients and patients
with other heart diseases.
117
P1: OTE/SPH P2: OTE
BLUK096-Bayes de Luna June 7, 2007 21:23
Figure 101 (1A) ECG alterations observed in successive stages of hyperkalemia. The atrial and
ventricular action potential has been superimposed. With the increase of Ke, the level of DTP,
height of Phase 0, and its rate of rise (the points of the dotted line are closer together) are all
decreased. The surface ECG shows that the QRS duration is increased and the P wave
disappears (adapted from [64]). (2A) A 20-year-old male with chronic renal failure who had
periodic hemodialysis during the 2 years prior to the recording. There is severe hypertension
(210/130 mmHg) and an elevated potassium level (6.4 mEq/L). Note the tall and peaked T wave
and elevation of the ST segment in V2 and V3. In leads I, II, and III, QT is relatively long at the
expense of the ST segment due to associated hypocalcemia. (1B) ECG alterations observed in
successive stages of hypokalemia. The ventricular action potential has been superimposed. On
the left is the DTP value, and below, the Ke level. Note how the action potential duration
progressively increases at the expense of a decrease in the velocity of phase 2. The ECG shows a
progressively bigger U wave and lesser T wave, together with an evident descent of the ST
segment (adapted from [64]). (2B) A 45-year-old patient with advanced mitro-aortic valve disease
who was treated with excessive doses of digitalis and diuretics. The Ke value is 2.3 mEq/L. An
ECG alteration representing phase C (above) is clearly seen, particularly in V2–V4.
Figure 102 The ECG in the case of hypothermia. See the Osborne wave at the end of QRS, the
presence of bradycardia and the oscillatory QRS baseline.
V
2
Tipo A Tipo B Tipo C Tipo D
V
2
V
2
V
2
Figure 103 The four most evident repolarisation abnormalities found in athletes without evidence
of heart disease. However, it is necessary to take a thorough history and often an echocardiogram
and an effort test to rule out any heart diseases (hypertonic cardiomiopathy, coronary heart
disease, etc.).
Cromos. 3
Cromos. 7 Cromos. 11
V
5V
5
V
5
Figure 104 The typical ECG patterns in the case of long QT syndrome related to genetic
alterations in chromosomes 3, 7 and 11.
118
P1: OTE/SPH P2: OTE
BLUK096-Bayes de Luna June 7, 2007 21:23
Figure 105 The Brugada pattern. On the left (A) is the typical one with the typical coved
ST-segment elevation and on the right (B) the more difficult to recognise with r
and saddle pattern
elevation of ST. In the atypical Brugada pattern usually the r
is wider than in the case of pectus
excavatus (see Figure 22G) or athletes [61].
III
II
I
VR
VL
VF
V
1
V
2
V
3
V
4
V
5
V
6
100uv
50uv
-
-
-
-
-
-
-
-
-
-
Figure 106 Arrhythmogenic right ventricular dysplasia (ARVD). Note the image of atypical right
bundle branch block, negative T wave in the V1–V4 leads, and premature ventricular complexes of
the right ventricle with left bundle branch block morphology. QRS duration is much longer in
V1–V2 than in V6. On the right very positive late potentials are seen in the signal averaging ECG.
Below: a typical echocardiographic image of right ventricle dyskinesia (see the arrow) in a patient
with ARVD.
119