Cardiovascular Imaging A handbook for clinical practice - Part 7 pot
Bạn đang xem bản rút gọn của tài liệu. Xem và tải ngay bản đầy đủ của tài liệu tại đây (527.62 KB, 31 trang )
lying supine and standing upright. This maneuver demonstrates a large right-
to-left shunt through a PFO while the patient is in an upright position and no
significant shunt while in a recumbent position.
Uncommon cardiac conditions associated with dyspnea
Pulmonary vein stenosis
Atrial fibrillation is a common arrhythmia that is found in 1% of persons older
than 60 years and it is a predictor of stroke. Pulmonary vein ablation offers the
potential to cure patients with atrial fibrillation. However, the risk of significant
pulmonary vein stenosis or occlusion after radiofrequency catheter ablation of
refractory atrial fibrillation has been reported. The clinical manifestations of
pulmonary vein stenosis are variable, including chest pain, cough, hemoptysis,
recurrent lung infection, pulmonary hypertension, and dyspnea. In patients
with dyspnea and a history of radiofrequency catheter ablation for atrial fibril-
lation, pulmonary vein stenosis should be suspected. In echocardiographic ex-
amination, two-dimensional echocardiography alone is not sufficient to detect
this anomaly. Color Doppler imaging can easily demonstrate turbulent flow
from the entry point of the pulmonary vein and thus suggest obstruction. Trans-
esophageal echocardiography is well suited to examination of the pulmonary
veins and to diagnosis of pulmonary venous obstruction. Frequency aliasing
observed by transthoracic color Doppler imaging is also an important clue in the
diagnosis of pulmonary vein stenosis. Doppler echocardiography can be used in
the quantitative analysis of severity of functional abnormality. However, in
some instances of increased angle to flow, the actual pressure gradient produced
by the obstruction may be underestimated.
Constrictive pericarditis
Constrictive pericarditis is a form of diastolic heart failure as a fibrotic, thick-
ened, and adherent pericardium restricts diastolic filling of the heart. The
symmetrical constricting effect of the pericardium results in elevation and
equilibrium of diastolic pressures in all four cardiac chambers. In patients with
dyspnea and other symptoms and signs of right heart failure, constriction
should be included as a possible diagnosis. Hatle et al.
11
described the unique
feature of respiratory variation in mitral inflow and hepatic vein velocities in
patients with constrictive pericarditis, and this substantially improved the accu-
racy for diagnosis. However, a subset of patients with constrictive pericarditis
do not demonstrate such respiratory variation in Doppler velocities, and mitral
inflow velocities may be indistinguishable from those of other causes of heart
failure.
Recently, it was shown that E¢ measured by TDI is reduced in patients with
restrictive cardiomyopathy, whereas it is relatively normal or even accentuated
in constrictive pericarditis.
12,13
Recording of E¢ by TDI is another useful means
of diagnosing constrictive pericarditis when mitral inflow velocity reveals a re-
strictive filling pattern without sufficient respiratory variation. Therefore, the
172 Chapter 14
BCI14 6/15/05 8:37 PM Page 172
recording of E¢ by TDE should be an essential part of echocardiographic Doppler
evaluation of all patients with heart failure, especially when constrictive
pericarditis is suspected. Most patients with constrictive pericarditis show
characteristic two-dimensional echocardiographic abnormalities. These in-
clude abnormal ventricular septal motion with prominent respiratory septal
“bounce,” calcified or thickened pericardium, and dilated inferior vena cava.
These abnormal two-dimensional echocardiographic findings should raise the
diagnostic possibility of constrictive pericarditis. Further demonstration of
characteristic Doppler findings such as respiratory variation in mitral inflow
velocity and a normal to increased E¢ will confirm a diagnosis of constrictive
pericarditis.
Conclusions
Chronic dyspnea is often challenging to evaluate because there are many
causes for this non-specific symptom. Echocardiography is an ideal imaging
tool to evaluate cardiac function, structure, and hemodynamics comprehen-
sively in patients with dyspnea. The capability to assess diastolic function and
filling pressures at rest and with exercise by echocardiography enhances our
diagnostic ability and allows better management of patients with chronic
dyspnea.
References
1Bergeron S, Ommen S, Bailey K, Oh J, McCully R, Pellikka P. Exercise echocardio-
graphic findings and outcome of patients referred for evaluation of dyspnea. J Am Coll
Cardiol 2004;43:2242–6.
2 Ommen S, Nishimura R, Appleton C, et al. Clinical utility of Doppler echocardio-
graphy and tissue Doppler imaging in the estimation of left ventricular filling pres-
sures: a comparative simultaneous Doppler–catheterization study. Circulation 2000;
102:1788–94.
3 Nagueh S, Middleton K, Koplen H, Zoghbi W, Quinones M. Doppler tissue imaging: a
non-invasive technique for evaluation of left ventricular relaxation and estimation of
filling pressures. J Am Coll Cardiol 1997;30:1527–33.
4 Nishimura R, Tajik A. Evaluation of diastolic filling of left ventricle in health and
disease: Doppler echocardiography is the clinician’s Rosetta Stone. J Am Coll Cardiol
1997;30:8–18.
5 Pinamonti B, Zecchin M, Di Lenarda A, Gregori D, Sinagra G, Camerini F. Persistence
of restrictive left ventricular filling pattern in dilated cardiomyopathy: an ominous
prognostic sign. J Am Coll Cardiol 1997;29:604–12.
6 Sohn D, Chai I, Lee D, et al. Assessment of mitral annulus velocity by Doppler tissue
imaging in the evaluation of left ventricular diastolic function. J Am Coll Cardiol
1997;30:474–80.
7 Nagueh S, Sun H, Kopelen H, Middleton K, Khoury D. Hemodynamic determinants
of the mitral annulus diastolic velocities by tissue Doppler. J Am Coll Cardiol
2001;37:278–85.
8 Kitzman D, Higginbotham M, Cobb F, Sheikh K, Sullivan M. Exercise intolerance in
Chronic dyspnea 173
BCI14 6/15/05 8:37 PM Page 173
patients with heart failure and preserved left ventricular systolic function: failure of
the Frank–Starling mechanism. J Am Coll Cardiol 1991;17:1065–72.
9 Ha J, Lulic F, Bailey K, et al. Effects of treadmill exercise on mitral inflow and annular
velocities in healthy adults. Am J Cardiol 2003;91:114–5.
10 Ha J, Oh J, Pellikka P, et al. Diastolic stress echocardiography: a novel non-invasive di-
agnostic test for diastolic dysfunction using supine bicycle exercise Doppler echocar-
diography. J Am Soc Echocardiogr In press.
11 Hatle L, Appleton C, Popp R. Differentiation of constrictive pericarditis and restrictive
cardiomyopathy by Doppler echocardiography. Circulation 1989;79:357–70.
12 Garcia M, Rodriguez L, Ares M, Griffin B, Thomas J, Klein A. Differentiation of con-
strictive pericarditis from restrictive cardiomyopathy: assessment of left ventricular
diastolic velocities in longitudinal axis by Doppler tissue imaging. J Am Coll Cardiol
1996;27:108–14.
13 Ha J, Ommen S, Tajik A, et al. Differentiation of constrictive pericarditis from restric-
tive cardiomyopathy using mitral annular velocity by tissue Doppler echocardio-
graphy. Am J Cardiol 2004;94:316–9.
174 Chapter 14
BCI14 6/15/05 8:37 PM Page 174
CHAPTER 15
Resynchronization therapy
Ole-A. Breithardt
Introduction
Cardiac resynchronization therapy (CRT) aims to normalize the disturbed elec-
trical activation sequence that is frequently observed in patients with systolic
dysfunction and left ventricular (LV) dilatation in order to improve cardiac he-
modynamics. This ambitious goal is typically achieved by the implantation of a
LV pacing lead through the coronary sinus tributaries to allow for advanced
stimulation of the delayed activated posterolateral wall of the LV. Several
prospective trials demonstrated that this strategy is likely to be successful in
terms of symptomatic and hemodynamic improvement in the majority of pa-
tients with heart failure and left bundle branch block (LBBB).
However, not all heart failure patients respond to therapy. The therapeutic ef-
ficacy of a CRT device depends on several factors, including the LV pacing site,
device programing (atrioventricular [AV] delay, right–left interventricular [VV]
delay), the extent of myocardial scars in ischemic cardiomyopathies, the pres-
ence of valvular disease, and the individual degree of dyssynchrony. Most of
these factors can be evaluated and monitored at the bedside by transthoracic
echocardiography. Other imaging techniques may also be suited to answer
some of these issues, such as cardiac magnetic resonance imaging for the identi-
fication of scars and radionuclide angiography for the measurement of ejection
fraction and quantification of interventricular dyssynchrony, but are techni-
cally more demanding and less widely available.
Pathophysiology of cardiac dyssynchrony in LBBB
The physiologic AV contraction sequence with a short PQ interval (less than
150–200 ms) is optimal to allow for complete ventricular emptying and filling.
Within the ventricles the electrical activation wavefront spreads rapidly
through the His bundle and the Purkinje fibers with a short time delay between
the earliest and latest activated myocardial segment of less than 40–50 ms.
1
Left
ventricular pre-ejection pressure is slightly higher than in the right ventricle
and septal motion is normal.
2
This well-coordinated contraction sequence opti-
mizes the myocardial energy expenditure and its hemodynamic performance.
In the failing heart, myocardial contractility is depressed and highly depend-
ent on pre- and afterload. The presence of an electrical conduction delay
—
most
175
BCI15 6/15/05 8:38 PM Page 175
frequently a LBBB and a prolonged PQ interval more than 150–200 ms
—
further impairs myocardial energy consumption and the hemodynamic per-
formance of the heart. The LV is activated slowly through the septum from the
right side and the LV endocardial activation time may exceed 100 ms.
3
Left ven-
tricular pre-ejection pressure is lower than in the right ventricle and septal mo-
tion is abnormal. This results in an uncoordinated contraction sequence and
delays LV ejection at the expense of diastolic filling.
4
Echocardiography in CRT candidates
A careful echocardiographic evaluation is one of the most important steps to se-
lect good clinical responders before implantation. Information on the presence
and extent of mechanical cardiac dyssynchrony can be derived from conven-
tional echocardiographic parameters during every routine examination. Newer
techniques such as tissue Doppler imaging (TDI) and three-dimensional (3D)
echocardiography help to characterize the disturbed contraction patterns more
precisely, but are technically more demanding.
Data from several small, single-center studies suggest that such echocardio-
graphic information about mechanical asynchrony and its impact on hemody-
namics is a better predictor for CRT success than baseline QRS width alone. It is
frequently observed that CRT does not decrease QRS width, but nevertheless
reduces mechanical dyssynchrony and improves hemodynamics.
Conventional echocardiographic parameters
Table 15.1 provides an overview on the available conventional parameters that
are valuable for the assessment of dyssynchrony before CRT implantation and
for follow-up.
Parasternal M-mode
Beyond the measurement of ventricular dimensions, the classic parasternal
M-mode provides information about the intraventricular septal to posterior
wall motion delay (SPWMD). In a small trial on 20 patients, the baseline
SPWMD predicted the CRT-related LV reverse remodeling effect better than
preimplant QRS width.
5
The SPWMD is measured between the first peak of sys-
tolic posterior motion of the septum and the peak anterior motion of the poste-
rior wall. Alternatively, the onset of septal and posterior wall thickening can be
compared. A preimplant SPWMD of more than 130–140 ms is seen in good
long-term responders. During successful CRT, the SPWMD should be reduced
significantly below the cut-off value of 130 ms; frequently it will be close to zero
(Fig. 15.1).
Pre-ejection interval by Doppler
The time interval between the onset of electrical activation and the onset of
ventricular outflow is defined as the ventricular pre-ejection delay (PEI). It is
176 Chapter 15
BCI15 6/15/05 8:38 PM Page 176
Resynchronization therapy 177
Table 15.1 Parameters valuable in the assessment of dyssynchrony.
Method Measure Objective Comment
Parasternal long- SPWMD >130–140 ms Intraventricular Often difficult to
axis M-mode dyssynchrony (septum– acquire, limited
posterior wall) prospective data
2D apical four- and Biplane ejection Document presence of Not a marker for
two-chamber view fraction systolic HF and baseline dyssynchrony
and volumes volumes for FU
CW Doppler of RV–LV pre-ejection Interventricular Robust and
pulmonary and interval (DPEI) >40 ms dyssynchrony reproducible,
aortic outflow (RV vs. LV) affected by
afterload
PW Doppler of Diastolic filling time Hemodynamic impact Robust,
mitral inflow <40–45% of cycle of dyssynchrony on reproducible; only
length diastole indirect measure,
affected by heart
rate
CW Doppler of Slope of regurgitant Non-invasive estimate Tends to
mitral regurgitation jet for estimation of of LV peak + dP/dt underestimate
jet (if present) LV peak + dP/dt invasive peak +
dP/dt, only indirect
measure
CW, continuous wave; FU, follow-up; HF, heart failure; LV, left ventricle; peak + dP/dt, peak
positive rate of pressure rise; PEI, pre-ejection interval; PW, pulsed wave; RV, right ventricle;
SPWMD, septal posterior wall motion delay.
LBBB CRT
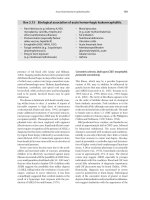
Figure 15.1 Parasternal anatomic M-mode (post-processed M-mode from 2D data set)
in left bundle branch block (LBBB, left) and during cardiac resynchronization therapy
(CRT, right). In LBBB, biphasic septal motion with early inward motion is present.
Inward motion of the posterior wall is delayed by approximately 240 ms. During
successful CRT both walls show simultaneous inward motion (right).
BCI15 6/15/05 8:38 PM Page 177
measured by Doppler echocardiography from the onset of the QRS to the open-
ing click of the pulmonary valve (RV-PEI) and to the opening click of the aortic
valve (LV-PEI). Typical values in LBBB patients are 100 ms for the RV-PEI and
150 ms for the LV-PEI. However, these values may differ substantially between
measurements and patients, depending on the applied Doppler technique
(pulsed wave [PW] or continuous wave [CW]) and on the reference point on
the ECG tracing (onset of QRS). Thus, it is most important to use the same
Doppler modality and reference points when calculating the “interventricular
mechanical delay” (IVMD), as the difference between the LV-PEI and the
RV-PEI:
IVMD = LV-PEI - RV-PEI
The IVMD by Doppler echocardiography is typically prolonged (more than
40 ms) in heart failure patients with LBBB resulting from the delayed ejection of
the LV (Fig. 15.2). CRT normalizes the IVMD to values below 20–30ms by syn-
chronizing both ventricles.
Diastolic filling time
In the normal heart, more than 60% of the cycle length at rest is reserved for
178 Chapter 15
Pulm. Valve
Aortic Valve
Figure 15.2 Continuous wave
Doppler across the pulmonary (above)
and aortic valve (below). The
pulmonary pre-ejection interval,
measured from the onset of the QRS
complex as the reference point to the
onset of pulmonary ejection, is
significantly shorter than the aortic
pre-ejection interval. The resulting
calculated interventricular
mechanical delay is approximately
60 ms.
BCI15 6/15/05 8:38 PM Page 178
diastolic filling. A long PR interval and the delayed activation in LBBB go at the
expense of the diastolic filling time (dFT), which can be measured by PW
Doppler between the opening and closure of the mitral valve as the total dura-
tion of the E-wave and the A-wave. In patients with marked dyssynchrony, the
dFT lies below 40–45% of the corresponding cycle length and frequently the
early and late diastolic filling waves are fused. CRT and proper AV delay opti-
mization may improve the dFT by more than 15–20% of its baseline value and
restore a normal inflow pattern with a separated E- and A-wave.
6,7
These
changes can be easily followed online while reprograming the pacemaker (Fig.
15.3; see also p.184).
Functional mitral regurgitation and LV systolic performance
A characteristic feature of delayed AV conduction in heart failure is the presence
of presystolic mitral regurgitation (Fig. 15.4, left). The delayed onset of the LV
pressure rise after termination of active atrial filling leads to incomplete mitral
valve closure with presystolic regurgitation. Presystolic mitral regurgitation
should be eliminated by AV delay optimization (Fig. 15.4, right).
Additional important information on LV systolic function can be obtained
from the regurgitation jet. The slope of the regurgitant jet by CW Doppler allows
estimation of the LV rate of pressure rise (LV peak + dP/dt)
8
and is an indicator
for hemodynamic improvement by CRT (Fig. 15.4). Quantification of LV peak +
dP/dt at baseline may enable later comparison during follow-up and allows the
identification of hemodynamic responders.
6,9
Resynchronization therapy 179
LBBB CRTÆ
Figure 15.3 Effect of CRT on the mitral inflow profile. During LBBB, the early and late
diastolic filling waves are fused and the diastolic filling time is markedly reduced to less
than 40% of the corresponding cycle length (left, first two beats). Immediately with the
onset of CRT, the diastolic filling time increases above 50% of cycle and the inflow
profile normalizes with clear separation of the early and late diastolic filling wave.
BCI15 6/15/05 8:38 PM Page 179
Aortic stroke volume
Invasive and non-invasive studies demonstrated that successful CRT acutely in-
creases aortic stroke volume by 10–15%.
7
This effect can be accurately meas-
ured by PW Doppler and has been evaluated in several trials. However,
calculation of stroke volume is relatively time-consuming, because it requires
careful positioning of the PW Doppler sample volume at the level of the LV out-
flow tract, measurement of the LV outflow tract diameter, and averaging of sev-
eral beats, which makes it less attractive in daily practice. Alternatively, in
patients with a stable heart rate, the velocity time integral (“stroke distance”) by
aortic CW Doppler can be used to compare the acute changes with CRT.
In summary, conventional echocardiographic parameters provide helpful in-
formation about the funtional status of possible CRT candidates and on the im-
pact of asynchrony on LV function. During follow-up these measurements help
to verify CRT efficacy and can be used to optimize the pacemaker settings. The
analysis can be performed online on every standard echocardiographic scanner
and requires no specific expertise. However, a complete analysis is time-
consuming and most of the described parameters provide only indirect infor-
mation about mechanical synchrony.
180 Chapter 15
CRT OFF CRT ON
pre-systolic
MR
Estimation of LV+dP/dt
max
:
Dt
(100-300cm/s)
= 49ms Æ
LV+dP/dt
max
~650mmHg/s
Estimation of LV+dP/dt
max
:
Dt
(100-300cm/s)
= 71ms Æ
LV+dP/dt
max
~450mmHg/s
Figure 15.4 Continuous wave Doppler of functional mitral regurgitation in a patient
with LBBB and a prolonged PQ interval of more than 300 ms (left). Presystolic mitral
regurgitation is present and left ventricular systolic function is poor, as estimated by the
slow increase of the regurgitant velocity (LV peak dP/dt). During CRT and successful AV
delay optimization, the presystolic component of the regurgitant signal is eliminated
and systolic function is improved (right).
BCI15 6/15/05 8:38 PM Page 180
Tissue Doppler imaging
Tissue Doppler imaging (TDI) measures the velocity of myocardial motion with
a high temporal resolution and therefore seems ideally suited to identify LV dys-
synchrony and to quantify the resynchronization effect. Unlike conventional
Doppler, the high-frequency, low-amplitude signals of myocardial blood flow
are filtered out and myocardial tissue velocities are displayed as a spectral
Doppler waveform (PW-TDI) or in a color-coded manner similar to color flow
Doppler. Today, the temporal resolution of both TDI techniques is high enough
to resolve the short-lived cardiac events. Frame-rates above 100–120 s
-1
are
required to identify reliably the isovolumic events and the onset of regional
motion.
Several strategies have been tested to identify synchrony of myocardial mo-
tion based on the myocardial velocity profile. Some investigators identified dys-
synchrony by the presence and extent of post-systolic shortening (delayed
longitudinal contraction, DLC) in the basal segments and demonstrated that
CRT reduces the extent of DLC.
10
However, most investigators followed a more
quantitative approach and concentrated either on the timing of the onset of sys-
tolic myocardial motion or on the timing of peak systolic velocity.
6,11-15
In the normal heart, the onset of systolic motion occurs briefly after the iso-
volumic velocity spike and almost simultaneously in all myocardial segments.
Earliest onset of systolic motion is typically observed in the posterobasal seg-
ment with a short delay of the other walls, resulting in synchronous longitudi-
nal contraction and a negligible inter- and intraventricular delay. In contrast,
most patients with heart failure and a conduction delay frequently show a sig-
nificantly increased inter- and intraventricular delay of more than 50–100 ms.
16
The prevalence of inter- and intraventricular dyssynchrony is generally higher
in patients with LBBB and wide QRS prolongation; however, the correlation
between the QRS width and the degree of dyssynchrony is poor. In particular, in
patients with normal (less than 120 ms) or relatively narrow QRS (less than
150 ms), the intraventricular delay cannot be reliably predicted by the QRS
duration alone. Thus, in this subgroup echocardiography is of particular value
to identify patients with correctable inter- and intraventricular dyssyn-
chrony.
11,16
A similar comparison was performed by Bleeker et al.
17
who focused on septal
and lateral peak systolic motion in the basal segments obtained by color-coded
TDI (Fig. 15.5). The authors found a poor overall correlation between QRS
duration and the septal–lateral peak systolic delay (SL-delay). Up to 40% of
patients with a QRS width above 120 ms showed no dyssynchrony by TDI
(SL-delay less than 60 ms) and almost 30% of patients with normal QRS width
(less than 120 ms) presented with clear signs of dyssynchrony, defined as a SL-
delay more than 60 ms. In two other publications, the same group demon-
strated that the SL-delay with a cut-off value of 60–65 ms is a good predictor for
identifying clinical CRT responders,
13
that the degree of baseline dyssynchrony
predicts the extent of reverse remodeling during follow-up,
18
and that the im-
Resynchronization therapy 181
BCI15 6/15/05 8:38 PM Page 181
provement in ejection fraction is directly correlated to the reduction in the SL-
delay.
13
A third approach was tested by Yu et al.
6,14,19
who also measured the timing of
regional peak systolic velocity but extended the analysis to the basal and mid
segments in three apical views. From this 12-segment model they calculated the
average delay from the onset of the QRS to the regional peak systolic velocity
(Ts), the average of Ts from all segments, and the standard deviation of Ts (Ts-
SD) as a marker for dyssynchrony. They were able to show that Ts-SD is signifi-
cantly elevated in patients with heart failure and LBBB and that CRT reduces
Ts-SD significantly.
6
In another series, the authors demonstrated that their
dyssynchrony index Ts-SD was a good predictor for LV reverse remodeling,
segregating responders (cut-off of more than 32 ms) from non-responders.
Furthermore, they also confirmed that heart failure patients with normal QRS
width can present with significant dyssynchrony: systolic dyssynchrony de-
fined as a Ts-SD of more than 32 ms was found in 43% of patients with normal
QRS duration and in 64% of patients with prolonged QRS of more than
120 ms.
19
A clear disadvantage of the approach by Yu et al. is the time-consuming meas-
urement of Ts in 12 different segments if the analysis is performed manually.
However, new software algorithms promise a semi-automated online measure-
182 Chapter 15
Lateral
Septal
Figure 15.5 Color-coded tissue Doppler imaging in a patient with LBBB. The post-
processed velocity curves from the basal septum (yellow) and the basal lateral wall
(green) clearly indicate asynchronous longitudinal motion. Peak apical velocity of
motion of the septum (arrow) occurs clearly before the lateral wall (dashed arrow).
Arrowhead = QRS complex.
BCI15 6/15/05 8:38 PM Page 182
ment of Ts-SD from the complete LV. In combination with new matrix array
transducers, a quick measurement of Ts-SD from three simultaneously ac-
quired apical views becomes possible (Fig. 15.6).
Three-dimensional echocardiography
In an early, small study, Breithardt et al.
20
analyzed the effects of LBBB and CRT
on LV dyssynchrony in 34 patients with heart failure and ventricular conduc-
tion delay from the Path-CHF study. A semi-automatic method for endocardial
border delineation was applied to quantify the degree of LV dyssynchrony in
two-dimensional (2D) echocardiographic sequences from the apical four-
chamber view, thus focusing on the septal–lateral relationship. Regional wall
movement curves were compared by a mathematical phase analysis, based on
Fourier transformation. The resulting septal–lateral phase angle difference, a
quantitative measure for intraventricular synchrony, was significantly elevated
if compared with normal controls. CRT reduced the septal–lateral phase angle
difference significantly and the degree of dyssynchrony before implantation of
the CRT system predicted the acute hemodynamic response to optimized resyn-
chronization therapy. An obvious limitation of this approach is the restriction to
a single imaging plane. Any dyssynchrony in other walls will be overlooked and
thus the precise extent of dyssynchrony cannot be measured adequately.
Resynchronization therapy 183
Figure 15.6 Example of a new semi-automated tissue Doppler imaging analysis tool
(triplane tissue synchronization imaging, TSI). Three 2D imaging planes, corresponding
to the conventional apical four-chamber, two-chamber, and long-axis views, are
acquired simultaneously with a 3D matrix array transducer. Time to peak systolic
velocity is automatically measured and displayed in a color-coded fashion (green, early
systolic peak; yellow/red, late systolic peak). Six basal and six mid LV segments are
analyzed and the calculated indices are displayed on the right side, indicating a
significant delay within the left ventricle.
BCI15 6/15/05 8:38 PM Page 183
These limitations may be overcome by 3D echocardiography. With the intro-
duction of real-time 3D echocardiography it is now possible to acquire 3D infor-
mation more rapidly and without the necessity for time-consuming offline
reconstruction. New matrix array transducers allow scanning of the complete
LV within a few cardiac cycles. The acquired digital 3D data set can then be trans-
ferred to a separate workstation for offline analysis. Regional wall motion pat-
terns can be visualized and quantified after segmentation of the LV chamber
with semi-automatic contour tracing algorithms. Preliminary reports suggest
that this approach enables a comprehensive analysis of LV wall motion before
and during CRT with a direct comparison of endocardial wall motion between
all LV segments. Segmental wall motion over time is measured in relation to a
center point and can be quantitatively expressed as a regional stroke volume or
ejection fraction. Preliminary experience has been reported;
21,22
however, the
clinical feasibility of real-time 3D echocardiography still has to be proven.
Optimization of the atrio-ventricular delay
Atrio-ventricular synchronization is as important as resynchronizing the ven-
tricles. In most patients a sensed AV delay in the range 100–150ms is associated
with the best hemodynamic performance. However, in some patients (approx-
imately 25%) shorter or longer AV delays may yield better results. Thus, it is
mandatory to verify that the programed AV delay (often the standard settings of
the pacemaker) is beneficial and to optimize it further if necessary. Ritter et al.
23
proposed an algorithm for the optimization of the AV delay in patients with con-
ventional DDD pacemakers, which requires the pacemaker to be programed to
two different AV delays (short and long) and the transmitral inflow profile to be
recorded at every stage. The principle is widely accepted and has been validated
in small trials.
24
However, it has not been systematically validated in patients
with advanced heart failure and LV-based pacing.
Most centers today use a simplified, iterative approach for AV delay optimiza-
tion. The transmitral inflow is recorded at a long AV delay with complete
ventricular capture, then shorter AV delays are tested until the A-wave is
prematurely terminated. Finally, the shortest AV delay that produces the
longest diastolic filling time without premature truncation of the A-wave is
programed.
Optimization of the interventricular pacing interval
(VV delay)
Modern CRT devices allow the pacing of both ventricles independently with a
programable offset between RV and LV stimulation, the so-called VV-delay. This
important option allows further optimization in many patients, in particular
those who do not seem to benefit clinically and hemodynamically from “classic”
simultaneous biventricular stimulation. Invasive hemodynamic studies have
demonstrated that such a sequential stimulation protocol with individual opti-
184 Chapter 15
BCI15 6/15/05 8:38 PM Page 184
mization of the VV delay is associated with an approximately 10% additional
absolute improvement in systolic function as measured by LV peak + dP/dt
25,26
and in improved resynchronization of wall motion.
27
In most patients, optimal
resynchronization is achieved either by simultaneous stimulation (VV delay =
0) or by moderate LV pre-excitation of 20–30 ms before the RV is stimulated. In
patients with an ischemic cardiomyopathy more extreme offsets of up to
60–70 ms LV pre-excitation may be required
26
and in some individuals even RV
pre-excitation is superior. It should be noted, however, that the responses to se-
quential CRT may vary widely and depend on the presence of non-viable tissue
and the individual lead position.
Echocardiographic-guided optimization of the VV delay involves the same
variables that have been discussed for the assessment of dysynchrony and for
verification of CRT efficacy during follow-up. For practical purposes, a limited
number of LV–RV offsets should be tested and compared, e.g. simultaneous
stimulation and pre-excitation of 20, 40 and 60 ms of either ventricle. Depend-
ing on the experience of the operator and equipment, the effects can be fol-
lowed either by conventional Doppler variables
25
or by TDI modalities.
27
Conclusions
Echocardiography offers a variety of parameters that help to identify dyssyn-
chrony, its hemodynamic impact, and the effects of resynchronization therapy.
Important information can be obtained from every routine examination, but
newer techniques such as TDI and
—
in the near future
—
3D echocardiography
will help to localize and quantify the degree of dyssynchrony more precisely.
28
It is yet unclear whether a single echocardiographic parameter will be able to
serve all needs in daily clinical practice: to identify the ideal candidate, to verify
CRT efficacy, and to optimize CRT settings during follow-up. However, there is
certainly enough firm evidence already to select a good CRT candidate and to
verify CRT efficacy if all the available echocardiographic information on hemo-
dynamics and mechanics is combined and correctly interpreted.
References
1 Cassidy DM, Vassallo JA, Marchlinski FE, Buxton AE, Untereker WJ, Josephson ME.
Endocardial mapping in humans in sinus rhythm with normal left ventricles: activa-
tion patterns and characteristics of electrograms. Circulation 1984;70:37–42.
2 Little WC, Reeves RC, Arciniegas J, Katholi RE, Rogers EW. Mechanism of abnormal
interventricular septal motion during delayed left ventricular activation. Circulation
1982;65:1486–91.
3Vassallo JA, Cassidy DM, Marchlinski FE, et al. Endocardial activation of left bundle
branch block. Circulation 1984;69:914–23.
4 Grines CL, Bashore TM, Boudoulas H, Olson S, Shafer P, Wooley CF. Functional ab-
normalities in isolated left bundle branch block: the effect of interventricular asyn-
chrony. Circulation 1989;79:845–53.
5 Pitzalis MV, Iacoviello M, Romito R, et al. Cardiac resynchronization therapy tailored
Resynchronization therapy 185
BCI15 6/15/05 8:38 PM Page 185
by echocardiographic evaluation of ventricular asynchrony. J Am Coll Cardiol 2002;
40:1615–22.
6Yu CM, Chau E, Sanderson JE, et al. Tissue Doppler echocardiographic evidence of re-
verse remodeling and improved synchronicity by simultaneously delaying regional
contraction after biventricular pacing therapy in heart failure. Circulation 2002;105:
438–45.
7Breithardt OA, Stellbrink C, Franke A, et al. Acute effects of cardiac resynchronization
therapy on left ventricular Doppler indices in patients with congestive heart failure.
Am Heart J 2002;143:34–44.
8 Bargiggia GS, Bertucci C, Recusani F, et al. A new method for estimating left ventricu-
lar dP/dt by continuous wave Doppler echocardiography: validation studies at car-
diac catheterization. Circulation 1989;80:1287–92.
9 Oguz E, Dagdeviren B, Bilsel T, et al. Echocardiographic prediction of long-term re-
sponse to biventricular pacemaker in severe heart failure. Eur J Heart Fail 2002;4:
83–90.
10 Sogaard P, Egeblad H, Kim W, et al. Tissue Doppler imaging predicts improved systolic
performance and reversed left ventricular remodeling during long-term cardiac re-
synchronization therapy. J Am Coll Cardiol 2002;40:723–30.
11 Faber L, Lamp B, Hering D, et al. Analyse der inter- und intraventrikulären Asyn-
chronie mittels Fluss- und Gewebe-Dopplerechokardiographie [Analysis of inter-
and intraventricular asynchrony by tissue Doppler echocardiography]. Z Kardiol
2003;92:994–1002.
12 Bax JJ, Molhoek SG, van Erven L, et al. Usefulness of myocardial tissue Doppler
echocardiography to evaluate left ventricular dyssynchrony before and after biven-
tricular pacing in patients with idiopathic dilated cardiomyopathy. Am J Cardiol
2003;91:94–7.
13 Bax JJ, Marwick TH, Molhoek SG, et al. Left ventricular dyssynchrony predicts bene-
fit of cardiac resynchronization therapy in patients with end-stage heart failure be-
fore pacemaker implantation. Am J Cardiol 2003;92:1238–40.
14 Yu CM, Fung WH, Lin H, Zhang Q, Sanderson JE, Lau CP. Predictors of left ventricu-
lar reverse remodeling after cardiac resynchronization therapy for heart failure sec-
ondary to idiopathic dilated or ischemic cardiomyopathy. Am J Cardiol 2002;91:
684–8.
15 Schuster P, Faerestrand S, Ohm OJ. Colour tissue velocity imaging can show resyn-
chronization of longitudinal left ventricular contraction pattern by biventricular pac-
ing in patients with severe heart failure. Heart 2003;89:859–64.
16 Rouleau F, Merheb M, Geffroy S, et al. Echocardiographic assessment of the interven-
tricular delay of activation and correlation to the QRS width in dilated cardiomyopa-
thy. Pacing Clin Electrophysiol 2001;24:1500–6.
17 Bleeker GB, Schalij MJ, Molhoek SG, et al. Relationship between QRS duration and
left ventricular dyssynchrony in patients with end-stage heart failure. J Cardiovasc
Electrophysiol 2004;15:544–9.
18 Bax JJ, Bleeker GB, Marwick TH, et al. Left ventricular dyssynchrony predicts
response and prognosis after cardiac resynchronization therapy. J Am Coll Cardiol
2004;44:1834–40.
19 Yu CM, Lin H, Zhang Q, Sanderson JE. High prevalence of left ventricular systolic and
diastolic asynchrony in patients with congestive heart failure and normal QRS dura-
tion. Heart 2003;89:54–60.
20 Breithardt OA, Stellbrink C, Kramer AP, et al. Echocardiographic quantification of left
186 Chapter 15
BCI15 6/15/05 8:38 PM Page 186
ventricular asynchrony predicts an acute hemodynamic benefit of cardiac re-
synchronization therapy. J Am Coll Cardiol 2002;40:536–45.
21 Kapetanakis S, Cooklin M, Monaghan MJ. Mechanical resynchronization in biven-
tricular pacing illustrated by real-time transthoracic three-dimensional echocardio-
graphy. Heart 2004;90:482.
22 Franke A, Breithardt OA, Rulands D, Sinha AM, Kuhl HP, Stellbrink C. Quantitative
analysis of regional left ventricular wall motion patterns in patients with cardiac re-
synchronization therapy using real-time 3D echocardiography [Abstract]. Circulation
2003;108(Suppl S):2231.
23 Ritter P, Dib JC, Mahaux V, et al. New method for determing the optimal atrioventric-
ular delay in patients paced in DDD mode for complete atrioventricular block [Ab-
stract]. PACE 1995;18:855.
24 Kindermann M, Fröhlig G, Doerr T, Schieffer H. Optimizing the AV delay in DDD
pacemaker patients with high degree AV block: mitral valve Doppler versus imped-
ance cardiography. PACE 1997;20:2453–62.
25 van Gelder BM, Bracke FA, Meijer A, Lakerveld LJ, Pijls NH. Effect of optimizing the
VV interval on left ventricular contractility in cardiac resynchronization therapy. Am
J Cardiol 2004;93:1500–3.
26 Perego GB, Chianca R, Facchini M, et al. Simultaneous vs. sequential biventricular
pacing in dilated cardiomyopathy: an acute hemodynamic study. Eur J Heart Fail
2003;5:305–13.
27 Sogaard P, Egeblad H, Pedersen AK, et al. Sequential versus simultaneous biventricu-
lar resynchronization for severe heart failure: evaluation by tissue Doppler imaging.
Circulation 2002;106:2078–84.
28 Bax JJ, Ansalone G, Breithardt OA, et al. Echocardiographic evaluation of cardiac re-
synchronization therapy: ready for routine clinical use? A critical appraisal. J Am Coll
Cardiol 2004;44:1–9.
Resynchronization therapy 187
BCI15 6/15/05 8:38 PM Page 187
CHAPTER 16
Hypertrophic cardiomyopathy
Petros Nihoyannopoulos
Introduction
Definitions
Cardiomyopathies are heart muscle conditions of no apparent cause. Car-
diomyopathies are typically divided in four categories depending on morpho-
logic and functional characteristics:
1 Hypertrophic
2 Dilated
3 Restrictive
4 Arhythmogenic right ventricular
However, this classification is based on the morphologic and functional charac-
terization of genetically defined disease and patients often present with a com-
bination of appearances. It is therefore possible that a patient with hypertrophic
cardiomyopathy (HCM) may deteriorate in the long term and become dilated or
even restrictive.
HCM is currently defined as an inherited, primary disease of the heart
muscle characterized by ventricular hypertrophy, impaired diastolic function,
and vigorous ventricular contraction in the absence of a cardiac or systemic
cause.
1-3
There are several genes and hundreds of mutations that have been
identified, involving primarily the sarcomeric proteins of the heart. This makes
the condition genetically heterogeneous so it could include several disease
entities.
Pathophysiology
Functional abnormalities include a forceful, ventricular contraction often with
complete emptying, achieving an ejection fraction of 80–100%. The powerful
contraction and complete emptying of the ventricle often occurs in association
with intraventricular pressure gradients. When the gradient is subaortic, it oc-
curs in association with a systolic anterior movement of the mitral valve (SAM).
Gradients may be persistent at rest, labile (spontaneously variable), or appear
only on provocation, and do not correlate with prognosis. Although initially
HCM was thought to be mainly a disorder of left ventricular systolic function, it
is now recognized that the main problem lies in diastole with impaired ventric-
ular relaxation.
It has become progressively more difficult to define diagnostic limits of pa-
188
BCI16 6/15/05 8:39 PM Page 188
tients with “unexplained left ventricular hypertrophy,” mainly because of the
inability to exclude the disease unless a genetic screen is performed. The result
has been that the clinical spectrum of HCM has widened with great heterogene-
ity of age, clinical presentation and natural history, and underscores the need to
define the molecular basis of the condition. Until then, idiopathic hypertrophy
represents the cornerstone of clinical diagnosis.
Diagnosis
The diagnosis of HCM is based upon the demonstration of unexplained, left
ventricular hypertrophy producing a small, non-compliant, vigorously con-
tracting left ventricle. The clinical findings of dyspnea, chest pain, dizziness, or
syncope are the most frequent symptoms that lead to a discovery of HCM but
they are present in only half of patients. In the remainder, particularly in chil-
dren and adolescents, the diagnosis is made as a result of family screening or fol-
lowing the discovery of a murmur, or the electrocardiographic evidence of left
ventricular hypertrophy. The wide use of echocardiography has brought to light
many instances of HCM in patients thought to have had innocent murmurs,
mitral valve prolapse, coronary artery disease, or normal hearts. The most
dreaded symptom is sudden cardiac death. In a large study, Maron et al.
4
showed
that 46% of patients who died suddenly were entirely asymptomatic and
sudden death was the first manifestation of the disease.
The role of echocardiography
The diagnosis of HCM is made on the basis of the echocardiographic appearance
of left ventricular hypertrophy in the absence of an underlying cause. However,
echocardiography should have a supportive role in the clinical diagnosis of
HCM, as the diagnosis of the condition is clinical and requires the exclusion of
other causes of left ventricular hypertrophy.
The original M-mode recording techniques were invaluable in describing the
early diagnostic criteria for HCM:
1 The presence of asymmetric hypertrophy of the ventricular septum (ASH),
defined as the ratio of septal and posterior left ventricular wall thickness at end-
diastole of ≥1.3 cm
5
2 The systolic anterior motion of the mitral valve (SAM)
3 The premature, mid-systolic closure of the aortic valve in the presence of a
small and vigorously contracting left ventricle (Fig. 16.1)
An inherent disadvantage of M-mode echocardiography, however, is that
only a small section of the left ventricle can be examined with a single ultra-
sound beam, usually passing through the anterior septum and posterior walls.
Patients with HCM may show a wide distribution of ventricular hypertrophy.
Two-dimensional echocardiography produces whole anatomic sections of
the heart so that the true size and shape of the valves and cavities may be appre-
ciated. The presence of ASH is not a prerequisite for the diagnosis of HCM. Other
conditions such as systemic hypertension, athlete’s heart, or even aortic steno-
Hypertrophic cardiomyopathy 189
BCI16 6/15/05 8:39 PM Page 189
sis can cause the ventricular septum to appear thicker than the left ventricular
free wall and, conversely, in many patients with HCM the septum and the free
wall may be of similar thickness (concentric hypertrophy). The recent recogni-
tion of a group of patients with HCM but without left ventricular hypertrophy
5
has demolished the last cornerstone of a firm echocardiographic diagnosis of the
condition.
The parasternal long-axis view is important in the visualization of the ven-
tricular septum, left ventricular outflow tract, together with the mitral appara-
190 Chapter 16
A
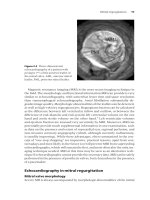
Figure 16.1 A representative M-mode echocardiogram from a patient with
hypertrophic cardiomyopathy (HCM) highlighting the four main echocardiographic
features of the condition. (A) Mid-systolic closure of the aortic valve (arrowhead).
(B) Systolic anterior motion of the mitral valve (arrow) and asymmetric left ventricular
hypertrophy together with a small, vigorously contracting left ventricle.
BCI16 6/15/05 8:39 PM Page 190
tus (Fig. 16.2). It is the view of choice for the visualization of SAM of the mitral
valve and mid-systolic closure of the aortic valve. While M-mode provides a
better temporal resolution, two-dimensional echocardiography provides better
spatial resolution. High-frequency phenomena, such as SAM and mid-systolic
closure of the aortic valve, can thus be better appreciated using M-mode
tracings.
Parasternal short-axis view is useful to localize and describe the extent of
ventricular hypertrophy (Fig. 16.3). Serial parasternal short-axis views are cru-
cial for the definition of the extent and shape of left ventricular hypertrophy.
They provide the opportunity to determine whether segmental hypertrophy
exists in other areas of the left ventricle, such as the posterior septum, antero-
lateral free wall, and posterolateral free wall. From these serial short-axis views
the left ventricle can be divided into four segments at mitral and papillary mus-
cle level and two at the apex, so that the anterior, lateral inferior, and posterior
septal walls can be measured (Fig. 16.4). Thus, by combining the parasternal
long- and short-axis views, the left ventricular walls can be examined compre-
hensibly and the localization and extent of ventricular hypertrophy can be fully
Hypertrophic cardiomyopathy 191
Figure 16.2 Two-dimensional
echocardiogram of the parasternal
long-axis view of the left ventricle in
diastole showing marked ventricular
septal hypertrophy, small end-diastolic
dimensions (41 mm). Note that the
mitral valve is impinging the
ventricular septum (arrow). At the
point of contact with the ventricular
septum the anterior mitral leaflet and
the endocardial surface of the septum
are more echogenic, implying fibrosis.
Figure 16.3 Short-axis parasternal
view of a HCM patient with marked
septal hypertrophy and normal
posterior wall at mid-ventricular level.
BCI16 6/15/05 8:39 PM Page 191
described. Occasionally, members of the same families with HCM may manifest
a similar pattern of ventricular hypertrophy. Echocardiographic imaging of the
right ventricle is also important, as approximately one-third of patients with
HCM may have right ventricular hypertrophy.
6
Echocardiographically, HCM is a condition characterized by:
1 Hypertrophy of all (concentric) or a portion of the left ventricular walls, that
is, ventricular septum (asymmetric), or apex (distal)
2 Dilated left atrium
3 Small, non-dilated ventricles
4 Absence of any other cardiac or systemic condition producing hypertrophy
(aortic stenosis
—
valvular, subvalvular, supravalvular, coarctation, systemic
hypertension, renal failure, amyloidosis)
5 Normal or super-normal (vigorous) ventricular contraction in the absence of
other hyperdynamic states (fever, pregnancy, hyperthyroidism)
Associated findings such as SAM or mid-systolic closure of the aortic
valve should not be considered diagnostic. When all the echocardiographic
features are present, together with the suggestive clinical picture, a firm diag-
nosis of HCM can be made. When only a number of these findings is present, the
diagnosis can only be made after exclusion of other causes of ventricular
hypertrophy.
192 Chapter 16
Figure 16.4 Serial short-axis, cross-sectional views of the left ventricle at mitral valve,
papillary muscles level and apex, demonstrating the segments of myocardial wall
measured routinely in patients with hypertrophic cardiomyopathy.
BCI16 6/15/05 8:39 PM Page 192
Patterns of ventricular hypertrophy
Asymmetric septal hypertrophy (ASH) is the most frequent form of left ventric-
ular hypertrophy and has been regarded as the hallmark of HCM. Although this
hypertrophy usually involves the basal anterior septum to a variable extent and
severity, it may also involve the apical, mid, or posterior septum in isolation.
7
ASH may be confined to the most proximal septum as a discrete “tumor-like”
swelling in an otherwise normal ventricular septum. Variations in ventricular
hypertrophy in HCM emphasize the need to obtain serial parasternal short-axis
views at multiple levels along the left ventricle, so that the complete distribution
of the ventricular hypertrophy can be ascertained.
Concentric or symmetrical left ventricular hypertrophy is also frequently
seen in patients with HCM and when this occurs the echocardiographic differ-
entiation from secondary causes of left ventricular hypertrophy such as sys-
temic hypertension, cardiac amyloidosis, or “athlete’s heart,” may be difficult
(Fig. 16.5).
Predominantly distal (apical) distribution of left ventricular hypertrophy is
also found in a substantial number of patients (Fig. 16.6). Japanese authors in-
dicate that patients with giant, negative T-waves have hypertrophy confined to
the left ventricular apex, mild symptoms, and few adverse prognostic features.
8
This distribution of hypertrophy characteristically creates a spade-like defor-
mity of the left ventricular cavity during diastole and this is well seen by two-
dimensional echocardiography from the apical four-chamber projection.
HCM is seen with increasing frequency in the elderly. However, few patients
have the “classic” clinical and echocardiographic features with left ventricular
outflow tract gradient. Others are discovered incidentally while undergoing in-
vestigations of coronary artery disease and yet others have been discovered dur-
ing investigation of hypertension. An association of elderly patients with HCM
and mitral annular calcification has also been reported.
9
These patients also
tend to have an angulated ventricular septum. The prognosis of these patients is
Hypertrophic cardiomyopathy 193
Figure 16.5 Parasternal long-axis
view from a patient with HCM of the
concentric type. Note that both the
septum and the posterior wall are of
similar thickness.
BCI16 6/15/05 8:39 PM Page 193
194 Chapter 16
Figure 16.6 Parasternal long-axis and
serial parasternal short-axis views of the
left ventricle from a patient with
hypertrophic cardiomyopathy of the
apical type. Note that the wall thickness is
normal at the base (upper panel),
marginally thickened (13 mm) at
papillary muscle level (middle panel) and
clearly hypertrophied (22 mm) at the
apex.
BCI16 6/15/05 8:39 PM Page 194
good, because they have survived the test of time, and it can be argued whether
this patient group really represents the same disease.
Diagnostic difficulties
Patients with HCM present great phenotypic and genotypic heterogeneity. It is
therefore reasonable to consider that no single diagnostic technique is cur-
rently sufficient to cover the entire spectrum of the disease and many clinical,
electrocardiographic, and echocardiographic skills are needed to diagnose
HCM.
It is important to investigate suspected cases of HCM in order to exclude the
diagnosis, particularly in high-risk families. Although the absence of ventricu-
lar hypertrophy can, in most instances, be sufficient to exclude the diagnosis of
HCM, in some cases showing mild, perhaps localized hypertrophy and good
ventricular function it may be very difficult to exclude the diagnosis.
Although two-dimensional echocardiography is the diagnostic tool of choice,
other entities that simulate HCM must be recognized. These include misinter-
pretations of normal variants of left ventricular shape, or can be caused by
oblique longitudinal sections of the left ventricle (off-axis views) and the pres-
ence of other causes leading to ventricular hypertrophy. ASH may be a sensitive
marker for HCM, but it is not specific for this condition.
One should be aware of the possible false diagnosis of asymmetrical septal hy-
pertrophy when acute angulation of the ventricular septum occurs (sigmoid
septum) (Fig. 16.7). In the elderly population the ventricular septum tends to
continue from the anterior aortic wall in an acute angle, so that it easily gives the
false impression of a localized subaortic septal thickening when viewed from
left parasternal projections. Such angulation appears to form a localized septal
thickening at the proximal portion of the anterior septum, particularly when
the M-mode beam transects the septum at this level and can easily be misinter-
preted as ASH and thus HCM. Left ventricular wall thickening, small outflow
Hypertrophic cardiomyopathy 195
Figure 16.7 Parasternal long-axis
view from an 81-year-old patient with
a markedly angulated ventricular
septum. Note that the very proximal
portion of the septum is sharply angled
towards the left ventricle outflow
which risks being misinterpreted as
hypertrophic cardiomyopathy.
BCI16 6/15/05 8:39 PM Page 195
tract dimensions, and a small incomplete SAM may complete the illusion of
HCM.
ASH is relatively common in infants with congenital heart disease. The
overall prevalence of disproportionate septal hypertrophy in one study was
10% and exceeded 20% in patients with pulmonary stenosis or pulmonary
hypertension.
ASH may occur in conditions causing thinning or thickening of the left
ventricular posterior wall relative to the septum. This abnormal septum to pos-
terior wall thickness ratio is commonly encountered in patients with coronary
artery disease either because of segmental hypertrophy of the septum (i.e. sec-
ondary to systemic hypertension) or, more commonly, as a result of transmural
myocardial infarction of the posterior wall, causing thinning that produces an
abnormal ratio even in the presence of normal septal thickness.
Concentric hypertrophy is the predominant pattern in secondary left ventric-
ular hypertrophy. Patients with hypertensive heart disease, aortic stenosis, car-
diac amyloidosis, and chronic renal failure show predominant concentric
hypertrophy and may have echocardiograms with an appearance mimicking
that of HCM with or without a gradient. The vigorous left ventricular systolic
contraction, however, seen in HCM should, in the majority of cases, differenti-
ate patients with HCM from those with cardiac infiltration where ventricular
contraction is depressed. There is a subset of patients with small left ventricular
cavity, moderate left ventricular hypertrophy, and hyperdynamic systolic func-
tion secondary to long-standing systemic hypertension. These patients are usu-
ally elderly and may exhibit a systolic anterior motion of the mitral valve, an
outflow tract gradient, and impaired diastolic function. In practice, the diagno-
sis of HCM should not be made in these patients because the hypertrophy is sec-
ondary to a known aetiology. It is conceivable, however, to have a common
disease such as systemic hypertension in association with a rare cardiac condi-
tion such as hypertrophic cardiomyopathy, in which case the differential diag-
nosis is extremely difficult clinically and should be avoided. Future genetic
markers may perhaps be able to differentiate the two conditions.
Cardiac amyloidosis may occasionally prove difficult to differentiate from
HCM patients with concentric hypertrophy, particularly at an early stage of the
disease. Both may show a similar degree of concentric left and right ventricular
hypertrophy and the described “sparkling” myocardial texture lacks specificity
for cardiac amyloidosis. The depressed systolic function in cardiac amyloidosis
usually contrasts well with the usual vigorous ventricular contraction seen in
HCM. The thickened valves and atrial septum (with amyloid infiltration) may
on occasion be of some help in the differential diagnosis. A low-voltage electro-
cardiogram in patients with cardiac amyloidosis will add to the differential diag-
nosis but cardiac biopsy will conclusively differentiate the two conditions.
Another major diagnostic difficulty occurs in some athletes who present with
symmetric or even asymmetric left ventricular hypertrophy involving the sep-
tum more than the free wall. Ventricular hypertrophy may represent either a
physiologic adaptation with more hypertrophy than usual or abnormal hyper-
trophy because of underlying HCM, putting the patient at risk for sudden death.
196 Chapter 16
BCI16 6/15/05 8:39 PM Page 196