Báo cáo y học: " Kinetics of hepatitis C virus RNA load during pegylated interferon alpha-2a and ribavirin treatment in naïve genotype 1 patients" potx
Bạn đang xem bản rút gọn của tài liệu. Xem và tải ngay bản đầy đủ của tài liệu tại đây (248.99 KB, 5 trang )
BioMed Central
Page 1 of 5
(page number not for citation purposes)
Comparative Hepatology
Open Access
Research
Kinetics of hepatitis C virus RNA load during pegylated interferon
alpha-2a and ribavirin treatment in naïve genotype 1 patients
Denis Ouzan
1
, Hacène Khiri
2
, Guillaume Pénaranda*
3
, Hélène Joly
1
and
Philippe Halfon
2
Address:
1
Arnault Tzanck Institut, Saint Laurent du Var, France,
2
Virological Department, Alphabio Laboratory, Marseille, France and
3
Biostatistics
and Epidemiology Department, CDLPharma, Marseille, France
Email: Denis Ouzan - ; Hacène Khiri - ; Guillaume Pénaranda* - ;
Hélène Joly - ; Philippe Halfon -
* Corresponding author
Abstract
Background: Pegylated interferon given for 24 or 48 weeks constitutes the most effective initial
therapy for the treatment of chronic hepatitis C. It has been shown that viral load at week 2 appears
the best time for predicting response to treatment. The objectives of this study were to assess
whether the hepatitis C virus (HCV) RNA viral decline is predictive of sustained virological
response (SVR) and to determine the best time for predicting complete response in our cohort of
naïve patients treated with pegylated interferon alpha-2a (Peg-IFN alpha-2a) and ribavirin.
Results: Twenty patients treated with Peg-IFN alpha-2a and ribavirin for 48 weeks were studied.
Six months after the end of treatment, a SVR (negative HCV RNA measured by PCR six months
after the end of therapy) was obtained in 9 patients. Samples were obtained before and at week 2,
4, 8, and 12. At the end of week 2, viral load decreased more than 1.39 log in 8 out of the 9 patients
with SVR and in 1 out of the 11 other patients. When we considered the viral load reduction from
baseline to each week of treatment, week 2 appeared to be the best point time for predicting SVR,
with a sensitivity of 91% (95%CI: 59;99), a specificity of 89% (52;98), a positive predictive value of
91% (59;99) and a negative predictive value of 89% (57;98).
Conclusion: During treatment with Peg-IFN alpha-2a plus ribavirin in genotype 1 patients, when
the main objective of the treatment is viral eradication, viral kinetics showed that week 2 appeared
to be the best time point for predicting SVR. Our results must be further confirmed on a larger
cohort.
Background
Interferon alpha plus ribavirin and more recently
pegylated interferon (Peg-IFN) given for 24 or 48 weeks
constitutes the most effective initial therapy for the treat-
ment of chronic hepatitis C [1-4]. In relapsers, we have
previously shown that viral load decline at week 2 appears
the best time for predicting the response to treatment [5].
Understanding the kinetics and dynamics of human
immunodeficiency virus (HIV) and of hepatitis B virus
(HBV) has greatly improved the understanding of the life
Published: 21 December 2005
Comparative Hepatology 2005, 4:9 doi:10.1186/1476-5926-4-9
Received: 24 May 2005
Accepted: 21 December 2005
This article is available from: />© 2005 Ouzan et al; licensee BioMed Central Ltd.
This is an Open Access article distributed under the terms of the Creative Commons Attribution License ( />),
which permits unrestricted use, distribution, and reproduction in any medium, provided the original work is properly cited.
Comparative Hepatology 2005, 4:9 />Page 2 of 5
(page number not for citation purposes)
cycle of these viruses and their response to therapy [6].
Studies of the kinetics of hepatitis C virus (HCV) after ini-
tiation of IFN monotherapy have revealed that IFN alpha-
2b causes a rapid dose-dependent reduction in HCV RNA
levels within 24 to 48 hours. Mathematical calculations
revealed that HCV has a serum half-life of 3 hours and a
viral production rate of 1.0 × 10
12
virions/day [2,7]. This
rapid decline appears to be a strong predictor of response
to treatment [8,9]. After this rapid decline, there is a
slower phase of viral decline that varies widely among
patients and is attributed to the death rate of infected
hepatocytes. The rate of decline of the second phase,
which is probably mediated by immune clearance of
infected hepatocytes, appears as the strongest viral kinetic
predictor of early viral clearance. Mathematical modelling
of viral dynamics revealed that turnover rates of pre-treat-
ment viral production and clearance were high and that in
vivo half-lives were a few hours for free HCV virions and
1–70 days for productively infected cells [10]. Infected cell
death rate, which determines the second phase decline, is
also predictive of response to treatment [11].
In the present study, viral kinetics during Peg-IFN alpha-
2a plus ribavirin treatment were determined at week 2, 4,
8, and 12 of treatment in 20 patients after a first course of
48 weeks of Peg-IFN alpha-2a plus ribavirin. Our objec-
tives were to assess: 1) whether the HCV RNA viral decline
is predictive of a sustained virological response (SVR); and
2) the best time for predicting complete response in our
cohort of patients.
Results
Epidemiological data for each patient are shown in Table
1. The mean age was (Mean ± SE) 50 ± 11 years and 70%
of patients were men. According to Metavir fibrosis stag-
ing, 7 patients were staged F0F1 (absent-minimal fibrosis)
and 13 were F2-F4 (significant fibrosis to cirrhosis) with
one case of cirrhosis (F4).
The difference in logarithmic values of viral load was cal-
culated between the different times: Baseline – Week 2,
Baseline – Week 4, Baseline – Week 8, Baseline – Week 12.
When we considered the reduction of the viral load (in
log
10
) from baseline to each of the first weeks of treat-
ment, week 2 point time tend to be better than other time
points for predicting SVR, with an area under receiver
operating characteristic (ROC) curve of 0.93 (95% confi-
dence interval: 0.72;0.99), a sensitivity of 91% (59;99), a
specificity of 89% (52;98), a positive predictive value
(PPV) of 91% (59;99) and a negative predictive value
(NPV) of 89% (57;98) (P non-significant) (Table 2). Viral
load decline in the patients with SVR and without SVR is
Table 1: Demographics, virological status, and response to treatment of the 20 genotype 1 patients
ID Sex Age Genotype 1
subtype
Liver
Biopsy
(Metavir)
Baseline
ALT
(IU/L)
Baseline Viral
Load*(log
10
copies/ml)
HCV RNA viral load decline
(log
10
copies/ml)
SVR**
W2 W4 W8 W12
1 M 45 B 1 58 6.46 0.46 0.74 1.52 2.22 0
2 M 47 - 1 92 5.86 0.92 2.70 3.04 3.07 0
3 F 66 B 3 90 6.56 1.42 3.06 3.06 3.06 1
4 M 53 - 3 57 6.31 1.21 2.69 3.25 2.81 0
5 M 54 B 3 52 5.69 1.66 2.51 2.91 2.91 0
6 M 45 A 2 150 6.88 1.45 3.38 3.38 3.38 1
7 M 55 A 2 92 6.30 1.15 2.63 2.80 3.04 1
8 M 54 A 4 327 6.87 3.37 3.37 3.29 3.29 1
9 F 47 B 0 58 5.78 2.04 2.28 2.28 2.28 1
10 M 63 B 3 218 6.52 2.11 3.02 3.02 3.02 1
11 M 74 - 2 57 7.09 0.65 0.81 1.53 2.18 0
12 M 34 A 2 36 6.79 1.88 3.29 3.29 3.29 1
13 F 54 B 2 75 7.22 0.39 0.98 1.32 1.80 0
14 F 55 B 2 58 7.46 1.32 2.23 3.54 3.96 0
15 F 54 B 1 36 6.31 1.38 2.81 2.81 2.81 0
16 M 44 A 2 39 6.25 1.22 2.40 2.75 2.75 0
17 M 42 A 1 74 6.62 3.12 3.12 3.12 3.12 1
18 M 54 - 2 134 6.38 2.18 2.60 2.88 2.88 1
19 M 38 A 1 65 7.17 0.47 0.66 1.16 1.68 0
20 F 25 A 0 70 5.54 -0.08 0.64 2.04 2.04 0
* Initial viral load Versant™ 3.0 HCV. ** Response, 6 months after the end of the treatment (0 = no response; 1 = response).
Comparative Hepatology 2005, 4:9 />Page 3 of 5
(page number not for citation purposes)
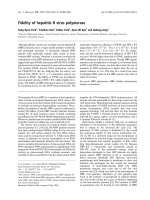
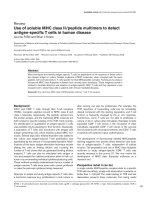
shown in Figure 1. Patients with unfavourable virological
response had a slight viral load decline of 3 log during the
first 8 weeks of treatment. Patients with SVR had the same
viral load decline (3 log) in only four weeks of treatment.
At the end of week 2, a viral load drop of more than 1.39
log was observed in 8 out of the 9 patients with SVR and
in only 1 out of the 11 other patients.
Discussion
Viral load measurements provide an indication of viral
replication, thereby serving as a valuable tool for guiding
the initiation of therapy and subsequent changes. The ear-
liest time to estimate the viral decline that may be predic-
tive of SVR is not clearly defined. Many studies have
reported the viral dynamics during the 24–48 hours after
treatment initiation [12-17] and have shown that inter-
feron resistance seems to be a dose related phenomenon,
rather than an intrinsic characteristic of the virus. Based
on pivotal trials in large multicenter studies, positive and
negative predictions of SVR using viral load kinetics have
been established and now serve as recommendations on
antiviral therapy management both by American and by
European international consensus conferences. The abil-
ity for predicting either a positive or a negative therapeutic
response is of an obvious benefit either to clinicians or to
patients. Positive predictive evidence early in the course of
treatment could be used for reinforcing the importance of
compliance in ensuring a successful outcome. Conversely,
negative predictive capability would allow clinicians to
discontinue therapy early during treatment, which would
save health care resources and, even more important,
could prevent drug-related adverse events [1-3].
In the present study, when we considered the median
reduction of the viral load (in log
10
) from baseline to
week 2, 4, 8, and 12 of treatment, week 2 point time tend
to be better than other time points for predicting SVR,
with a PPV of 91% and a NPV of 89% and a very good sen-
sitivity and specificity (despite a non-significant P-value).
Other studies have reported the same observation at week
2 [18-20], whereas Zeuzem et al. reported that the absence
of a 3 log
10
viral decline after one month of therapy is
associated with an absence of SVR [2]. The low number of
patients included in our study can lead to confusing biases
on the predictive values; therefore, our results must be
confirmed on a larger cohort.
Nine out of the 11 non-responders failed to have SVR after
having early virological response (EVR) at week 12 (NPV
of 100% and PPV of 50%). These results are in the same
range as those of recent studies, which showed that failure
to achieve EVR at week 12 of therapy is highly predictive
of the absence of therapy (97%–100% negative predictive
value), whereas the predictive value of achieving SVR after
EVR at week 12 is not so strong (PPV = 65%) [3,21,22].
Methods introduced for analysing HIV dynamics in vivo
can be modified to give insights into the HCV dynamics,
the mechanisms of action of interferon as well as the con-
sequences of varying dosages of interferon [14]. The high
turnover rates of HCV explain the rapid generation of viral
diversity and the opportunity for viral escape from host
immune surveillance and antiviral therapy. Ideally, inter-
feron alpha serum levels should provide constant pressure
on the virus and should prevent viral rebound, thereby
avoiding continued viral replication and minimising the
potential of emergence of drug-resistant quasi-species
[23].
Conclusion
When the main objective of the treatment is viral eradica-
tion, the study of viral kinetics during the first twelve
weeks of Peg-IFN alpha-2a plus ribavirin treatment
showed that week 2 tend to be the best time point for pre-
dicting sustained virological response. The early identifi-
cation of patients with no SVR may lead for proposing an
interruption of therapy for avoiding side effects and addi-
tional costs, or an early change of therapy [24]. This obser-
Table 2: Diagnostic values and viral drop threshold for Week 2, 4, 8 and 12 analyses.
Week Viral Drop
Threshold
(log
10
copies/ml)
Area Under
ROC Curve
(95% CI)
Sensitivity (95% CI) Specificity (95% CI) PPV (95% CI) NPV (95% CI)
2 1.39 0.93 (0.72;0.99) 91 (59;99) 89 (52;98) 91 (59;99) 89 (57;98)
4 2.81 0.89 (0.67;0.98) 100 (71,100) 67 (30;92) 79 (52;92) 100 (61;100)
8 2.81 0.79 (0.55;0.94) 73 (39;94) 78 (40;97) 80 (45;94) 70 (35;85)
12 2.81 0.81 (0.57;0.95) 73 (39;94) 89 (52;98) 89 (52;98) 73 (39:94)
The ROC curve method was used to determine the best cut-off that corresponds to the higher rate of sensitivity and specificity of predictions at
week 2, week 4, week 8, and week 12. The accuracy of the test is measured by the area under the ROC curve. This area measures the
discrimination, that is, the ability of the test to correctly classify patients with SVR and those without SVR. The analysis shows that the best results
are obtained for week 2 viral drop, with a viral drop threshold of 1.39, an area under curve of 0.93, and a sensitivity, a specificity, a PPV, and a NPV
rate of respectively 91%, 89%, 91%, and 89%. (P was non-significant for all areas under ROC curves comparisons.)
Comparative Hepatology 2005, 4:9 />Page 4 of 5
(page number not for citation purposes)
vation, after being validated on a larger cohort of
genotype 1 patients, should have an impact in clinical
routine in order to optimise antiviral therapy [25].
Methods
Patients
A total of 20 consecutive patients were prospectively
enrolled after a first course of combination (Peg-IFN
alpha-2a plus ribavirin) and just before starting interferon
and ribavirin therapy for chronic HCV infection, at the
Hepatology and Gastroenterology Department of the
Arnault Tzanck Institute (St Laurent du Var, France). All
patients tested positive for HCV RNA. All other causes of
chronic hepatitis were excluded by appropriate serological
testing and liver histology. All patients were treated with
ribavirin 1 g once a week, orally, plus Peg-IFN alfa-2a (180
µg subcutaneous injection once a week) for 48 weeks.
Written consent was obtained from each patient, and the
study was approved by the local Ethics Committee in
accordance with the 1975 declaration of Helsinki. Those
patients were all genotype 1. Virological response was
assessed by a qualitative HCV RNA assay with a lower sen-
sitivity of 50 IU/ml (HCV Amplicor 2.0 Roche Diagnos-
tics, Meylan, France). According to the qualitative HCV
RNA results, patients were defined as virologic sustained
responders (HCV RNA negative 6 months after the end of
therapy) or as non-responders. SVR was obtained in 9 out
of 20 patients. All patients had liver biopsy assessment
according to Metavir histological staging.
Measurement of serum HCV RNA
HCV RNA levels were measured at the same time on
blood samples collected at baseline and at weeks 2, 4, 8,
and 12 after the initiation of Peg-IFN alpha-2a treatment.
Blood was collected in plasma preparation tubes (Becton
Dickinson) that were centrifuged directly after collection
in order to minimize RNA breakdown [26]. Viral load was
assessed using a quantitative bDNA assay (Versant™ 3.0
superscript, Roche, Puteaux, France) with a detection limit
of 615 IU/ml (3,200 copies ml). The sensitivity and line-
arity of the assay were validated for all the genotypes [27].
Genotypes were determined by sequence and phyloge-
netic analysis of the 5' non-coding of the genome [28].
There were 8 genotype 1A and 8 genotype 1B patients,
and, in 4 cases, genotype 1 subtype was undetermined.
Statistical analysis
The ROC curve method was used to determine the best
cut-off between week 2, week 4, week 8, and week 12 viral
load measurements, by comparing the areas under the
ROC curves. The Hanley-McNeil test was used for testing
the statistical significance of the difference between the
areas under ROC curves. The significant (alpha) level was
set at 5%.
Competing interests
The author(s) declare that they have no competing inter-
ests.
Authors' contributions
DO was responsible for the conception, the design of the
study, and the drafting of the paper. HJ has been involved
in drafting and revising the paper HK has been responsi-
ble for testing the serums. GP has been responsible for the
statistical analysis. PH has been involved in writing the
paper. All authors have read and approved the content of
this work.
References
1. Manns MP, McHutchison JG, Gordon SC, Rustgi VK, Shiffman M, Rein-
dollar R, Goodman ZD, Koury K, Ling M, Albrecht JK: Peginter-
feron alfa-2b plus ribavirin compared with interferon alfa-2b
plus ribavirin for initial treatment of chronic hepatitis C: a
randomised trial. Lancet 2001, 358(9286):958-965.
2. Zeuzem S, Herrmann E, Lee JH, Fricke J, Neumann AU, Modi M,
Colucci G, Roth WK: Viral kinetics in patients with chronic
hepatitis C treated with standard or peginterferon alpha2a.
Gastroenterology 2001, 120(6):1438-1447.
3. Fried MW, Shiffman ML, Reddy KR, Smith C, Marinos G, Goncales
FLJ, Haussinger D, Diago M, Carosi G, Dhumeaux D, Craxi A, Lin A,
Hoffman J, Yu J: Peginterferon alfa-2a plus ribavirin for chronic
hepatitis C virus infection. N Engl J Med 2002, 347(13):975-982.
4. Hadziyannis SJ, Sette HJ, Morgan TR, Balan V, Diago M, Marcellin P,
Ramadori G, Bodenheimer HJ, Bernstein D, Rizzetto M, Zeuzem S,
Pockros PJ, Lin A, Ackrill AM: Peginterferon-alpha2a and ribavi-
rin combination therapy in chronic hepatitis C: a rand-
omized study of treatment duration and ribavirin dose. Ann
Intern Med 2004, 140(5):346-355.
5. Halfon P, Khiri H, Tran A, Penaranda G, Courcambeck J, Joly H,
Ouzan D: Hepatitis C virus RNA load in relapsed patients:
week two of treatment is the best time to predict the com-
plete response. Eur J Gastroenterol Hepatol 2003,
15(10):1067-1071.
6. Herrmann E, Lee JH, Marinos G, Modi M, Zeuzem S: Effect of riba-
virin on hepatitis C viral kinetics in patients treated with
pegylated interferon. Hepatology 2003, 37(6):1351-1358.
Estimated median [range] viral load decline during the first 12 weeks in patients with (SVR) and without (Non-SVR) sus-tained response to Peg-IFN alpha-2a + ribavirinFigure 1
Estimated median [range] viral load decline during the first 12
weeks in patients with (SVR) and without (Non-SVR) sus-
tained response to Peg-IFN alpha-2a + ribavirin. The viral
load detection limit of the quantitative assay was 615 UI/ml
(3.5 Log).
3,50 [3.50;5.49]
5.65 [4.75;6.83]
6.46 [5.54;7.46]
4.90 [3.50;6.51]
3.53 [3.06;6.01]
3.50 [3.26;3.58]
4.41 [3.50;5.43]
3.50 [3.50;3.78]
3.50 [3.50;3.58]
6.56 [5.78;6.88]
2
3
4
5
6
7
024681012
Weeks
Log (Viral Load) (cp/ml )
Non-SV R SVR
Publish with BioMed Central and every
scientist can read your work free of charge
"BioMed Central will be the most significant development for
disseminating the results of biomedical research in our lifetime."
Sir Paul Nurse, Cancer Research UK
Your research papers will be:
available free of charge to the entire biomedical community
peer reviewed and published immediately upon acceptance
cited in PubMed and archived on PubMed Central
yours — you keep the copyright
Submit your manuscript here:
/>BioMedcentral
Comparative Hepatology 2005, 4:9 />Page 5 of 5
(page number not for citation purposes)
7. Layden-Almer JE, Ribeiro RM, Wiley T, Perelson AS, Layden TJ: Viral
dynamics and response differences in HCV-infected African
American and white patients treated with IFN and ribavirin.
Hepatology 2003, 37(6):1343-1350.
8. Sarrazin C: Highly sensitive hepatitis C virus RNA detection
methods: molecular backgrounds and clinical significance. J
Clin Virol 2002, 25 Suppl 3:S23-9.
9. Major ME, Dahari H, Mihalik K, Puig M, Rice CM, Neumann AU, Fein-
stone SM: Hepatitis C virus kinetics and host responses asso-
ciated with disease and outcome of infection in
chimpanzees. Hepatology 2004, 39(6):1709-1720.
10. Bekkering FC, Brouwer JT, Hansen BE, Schalm SW: Hepatitis C
viral kinetics in difficult to treat patients receiving high dose
interferon and ribavirin. J Hepatol 2001, 34(3):435-440.
11. Halfon P, Neumann AU, Bourliere M, Rieu A, Chadapaud S, Khiri H,
Ouzan D, Cacoub P: Slow viral dynamics of hepatitis C virus
genotype 4. J Viral Hepat 2003, 10(5):351-353.
12. Fukutomi T, Nakamuta M, Fukutomi M, Iwao M, Watanabe H, Hiro-
shige K, Tanabe Y, Nawata H: Decline of hepatitis C virus load in
serum during the first 24 h after administration of inter-
feron-beta as a predictor of the efficacy of therapy. J Hepatol
2001, 34(1):100-107.
13. Bekkering FC, Stalgis C, McHutchison JG, Brouwer JT, Perelson AS:
Estimation of early hepatitis C viral clearance in patients
receiving daily interferon and ribavirin therapy using a math-
ematical model. Hepatology 2001, 33(2):419-423.
14. Tsubota A, Arase Y, Someya T, Suzuki Y, Suzuki F, Saitoh S, Ikeda K,
Akuta N, Hosaka T, Kobayashi M, Kumada H: Early viral kinetics
and treatment outcome in combination of high-dose inter-
feron induction vs. pegylated interferon plus ribavirin for
naive patients infected with hepatitis C virus of genotype 1b
and high viral load. J Med Virol 2005, 75(1):27-34.
15. Bruno R, Sacchi P, Ciappina V, Zochetti C, Patruno S, Maiocchi L,
Filice G: Viral dynamics and pharmacokinetics of peginter-
feron alpha-2a and peginterferon alpha-2b in naive patients
with chronic hepatitis c: a randomized, controlled study.
Antivir Ther 2004, 9(4):491-497.
16. Karino Y, Toyota J, Sugawara M, Miyazaki K, Kuwata Y, Yamazaki K,
Sato T, Ohmura T, Matsushima T: Hepatitis C virus genotypes
and hepatic fibrosis regulate 24-h decline of serum hepatitis
C virus RNA during interferon therapy in patients with
chronic hepatitis C. J Gastroenterol Hepatol 2003, 18(4):404-410.
17. Zeuzem S, Herrmann E: Dynamics of hepatitis C virus infection.
Ann Hepatol 2002, 1(2):56-63.
18. Civeira MP, Prieto J: Early predictors of response to treatment
in patients with chronic hepatitis C. J Hepatol 1999, 31 Suppl
1:237-243.
19. Enomoto M, Nishiguchi S, Kohmoto M, Tamori A, Habu D, Takeda T,
Seki S, Shiomi S: Effects of ribavirin combined with interferon-
alpha 2b on viral kinetics during first 12 weeks of treatment
in patients with hepatitis C virus genotype 1 and high base-
line viral loads. J Viral Hepat 2004, 11(5):448-454.
20. Rossini A, Artini M, Levrero M, Almerighi C, Massari M, Biasi L,
Radaeli E, Cariani E: Hepatitis C virus (HCV) RNA determina-
tion after two weeks of induction interferon treatment is an
accurate predictor of nonresponse: comparison of two treat-
ment schedules. Dig Dis Sci 2001, 46(11):2389-2395.
21. Russo MW, Fried MW: Guidelines for stopping therapy in
chronic hepatitis C. Curr Gastroenterol Rep 2004, 6(1):17-21.
22. Fried MW: Viral factors affecting the outcome of therapy for
chronic hepatitis C. Rev Gastroenterol Disord 2004, 4 Suppl
1:S8-S13.
23. Ferenci P: Predicting the therapeutic response in patients
with chronic hepatitis C: the role of viral kinetic studies. J
Antimicrob Chemother 2004, 53(1):15-18.
24. Kakumu S, Matsushima T, Sato S, Kobayashi K, Kiyosawa K, Hayashi
N, Tsuji T, Sata M, Origasa H, Iino S: Serum HCV RNA levels dur-
ing early phase of recombinant interferon alfa-2a (Roferon
A) therapy for chronic hepatitis C and efficacy of short-term
therapy with earlier loss of viremia. Hepatol Res 2002,
22(2):152-160.
25. Blendis L, Oren R, Halpern Z: Interferon treatment of HCV: do
we need a virological response? Gastroenterology 2002,
122(1):237-238.
26. Halfon P, Khiri H, Gerolami V, Bourliere M, Feryn JM, Reynier P,
Gauthier A, Cartouzou G: Impact of various handling and stor-
age conditions on quantitative detection of hepatitis C virus
RNA. J Hepatol 1996, 25(3):307-311.
27. Trimoulet P, Halfon P, Pohier E, Khiri H, Chene G, Fleury H: Evalu-
ation of the VERSANT HCV RNA 3.0 assay for quantification
of hepatitis C virus RNA in serum. J Clin Microbiol 2002,
40(6):2031-2036.
28. Halfon P, Trimoulet P, Bourliere M, Khiri H, de Ledinghen V, Couz-
igou P, Feryn JM, Alcaraz P, Renou C, Fleury HJ, Ouzan D: Hepatitis
C virus genotyping based on 5' noncoding sequence analysis
(Trugene). J Clin Microbiol 2001, 39(5):1771-1773.