Báo cáo y học: "Geographical information system and access to HIV testing, treatment and prevention of mother-to-child transmission in conflict affected Northern Uganda" pot
Bạn đang xem bản rút gọn của tài liệu. Xem và tải ngay bản đầy đủ của tài liệu tại đây (1.04 MB, 9 trang )
BioMed Central
Page 1 of 9
(page number not for citation purposes)
Conflict and Health
Open Access
Research
Geographical information system and access to HIV testing,
treatment and prevention of mother-to-child transmission in
conflict affected Northern Uganda
Dick D Chamla*
1
, Olushayo Olu
2
, Jennifer Wanyana
3
, Nasan Natseri
2
,
Eddie Mukooyo
3
, Sam Okware
4
, Abdikamal Alisalad
5
and Melville George
2
Address:
1
World Health Organization, formerly with Health Leadership services (HLS), 20 avenue appia, Geneva 1211, Switzerland,
2
Uganda
country office, World Health Organization, 24578 Kampala, Uganda,
3
Health Resource Center, Uganda Ministry of Health, Kampala, Uganda,
4
Community Health department, Uganda Ministry of Health, Kampala, Uganda and
5
Regional Office for Africa, World Health Organization,
Brazzaville, Congo
Email: Dick D Chamla* - ; Olushayo Olu - ; Jennifer Wanyana - ;
Nasan Natseri - ; Eddie Mukooyo - ; Sam Okware - ;
Abdikamal Alisalad - ; Melville George -
* Corresponding author
Abstract
Objectives: Using Geographical Information System (GIS) as a tool to determine access to and
gaps in providing HIV counselling and testing (VCT), treatment (ART) and mother-to-child
transmission (PMTCT) services in conflict affected northern Uganda.
Methods: Cross-sectional data on availability and utilization, and geo-coordinates of health
facilities providing VCT, PMTCT, and ART were collected in order to determine access. ArcView
software produced maps showing locations of facilities and Internally Displaced Population(IDP)
camps.
Findings: There were 167 health facilities located inside and outside 132 IDP camps with VCT,
PMTCT and ART services provided in 32 (19.2%), 15 (9%) and 10 (6%) facilities respectively. There
was uneven availability and utilization of services and resources among districts, camps and health
facilities. Inadequate staff and stock-out of essential commodities were found in lower health facility
levels. Provision of VCT was 100% of the HSSP II target at health centres IV and hospitals but 28%
at HC III. For PMTCT and ART, only 42.9% and 20% of the respective targets were reached at the
health centres IV.
Conclusion: Access to VCT, PMTCT and ART services was geographically limited due to
inadequacy and heterogeneous dispersion of these services among districts and camps. GIS
mapping can be effective in identifying service delivery gaps and presenting complex data into
simplistic results hence can be recommended in need assessments in conflict settings.
Background
Delivery of HIV counseling and testing (VCT) and antiret-
roviral services for prevention of mother to child trans-
mission (PMTCT) and for long-term treatment (ART) to
Published: 3 December 2007
Conflict and Health 2007, 1:12 doi:10.1186/1752-1505-1-12
Received: 8 August 2007
Accepted: 3 December 2007
This article is available from: />© 2007 Chamla et al; licensee BioMed Central Ltd.
This is an Open Access article distributed under the terms of the Creative Commons Attribution License ( />),
which permits unrestricted use, distribution, and reproduction in any medium, provided the original work is properly cited.
Conflict and Health 2007, 1:12 />Page 2 of 9
(page number not for citation purposes)
eligible individuals is feasible in emergency settings [1].
Northern Uganda, which has been affected by 20 years of
the Lord's Resistance Army (LRA) insurgency, has experi-
enced internal displacement of persons (IDP) into camps,
disruption of health services and high HIV prevalence [2-
4]. In Gulu, Kitgum and Pader (Acholi sub-region), which
are the most conflict-affected districts in Northern
Uganda, HIV/AIDS was the second most frequently
reported cause of death in 2005 [5]. While VCT has been
ongoing for the past decades, PMTCT and ART services
have been scaled up more recently after the declaration of
the World Health Organization (WHO) strategies of 3 by
5 and Universal Access. However, little has been docu-
mented on the access to these services in this conflict
affected region.
In health, defining access precisely has been difficult [6].
However, various models, such as Penchansky's typology
of access have recently increased a general understanding
of this concept [6]. In line with these models, this article
describes access to VCT, PMTCT and ART in the context of
their availability and utilization. We then link this infor-
mation on availability to the Geographical Information
System (GIS). GIS is defined as computer based systems
for integration and analysis of geographical data through
mapping [7]. Though recent increase in its use for health
assessments and policies has been evident [7], yet, limited
information is available on its application in conflict set-
tings. This led the authors of this article to use GIS to map
the availability of VCT, PMTCT and ART services located
inside and outside the IDP camps in Northern Uganda
with the aim of determining access to these services for
guiding priority setting, scaling up strategies and resource
allocation.
Methods
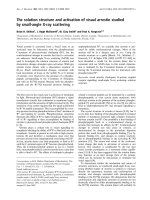
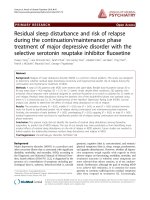
We performed Service Availability Mapping (SAM) of
health facilities located inside and outside the IDP camps
in three districts (figure 1): Gulu (camps = 65, population
= 543,267); Kitgum (camps = 43, population = 322,781)
and Pader (camps = 24, population = 373,035). District
population figures were projected using 2002 census
report at an annual growth rate of 3.4% [8]. The SAM con-
sisted of a survey methodology whereby structured camp
and health facility questionnaires were used to collect
data in the field, and the Global Positioning System (GPS)
instruments which were used to collect the geo-coordi-
nates of the camps and health facilities as in WHO SAM
guidelines [9]. These GPS readings were then uploaded to
and processed by the GIS software to generate the maps.
Data collection extended from 8
th
to 30
th
April 2006 and
all camps and health facilities located inside and outside
camps in the three surveyed districts were mapped. Teams
of two trained local interviewers administered standard-
ized, pre-piloted camp and health facility questionnaires
respectively (in English language). The main respondent
for the camp questionnaire was the camp commandant or
his assistant. For the health facility, the main respondents
were the health facility in-charges and heads of VCT,
PMTCT and ART if these services were available in that
health facility. The camp questionnaire collected camp
geographical coordinates (longitudes, latitudes and alti-
tudes), administrative location and division, population
figures, availability of health facilities, and human
resources for health. The health facility questionnaire col-
lected the facility geographical coordinates, availability of
VCT, PMTCT and ART services as well as utilization of
these services based on the review of the records of the
patients' attendance in the previous one month (30 days)
as in Pappa E et al [10]. The geo-coordinates were taken at
the administrative point designated for meetings in the
camp as identified by the camp commandant whereas in
the case of health facility the coordinates were taken 10
meters away from the main administrative building of
that health facility.
As in Roberts et al [11], we measured access in two ways:
first by assessing physical availability of VCT, PMTCT and
ART services and their minimum essential components
based on the national Antiretroviral guidelines [12] and
compared the availability of these services to population,
camp and health facility level. The minimum essential
components for VCT service were presence of at least 1
trained health worker, HIV test kit and a register. For
PMTCT, the minimum components for this service
included the presence of a trained staff, HIV test kits, Nev-
irapine and intra- and post-partum care. For ART services,
presence of a medical officer, HIV test kits and anti-retro-
viral drugs (ARVs) formed the minimum essential compo-
nents. Secondly, the access was measured by the
utilization of VCT, PMTCT and ART services based on the
assessment of clients' attendance records during the past
30 days as explained above. These records were available
from health facility registers that are part of Uganda
Health Management Information System (HMIS). We did
not assess demographic characteristics of those clients
attending these services. Similarly, as there were no user
fees for most services including VCT, PMTCT and ART
[13,14], we concluded that affordability had little effect
on utilization. Likewise, in northern Uganda, most IDP
camps are of small geographical size characterized by
over-crowded IDP dwellings which are in close proximity
to most health services [5]. This means all VCT, PMTCT
and ART services inside the camps or municipality were
located within accessible distances. However, as the level
of violence was observed more outside the camps [5,14],
we assumed that insecurity rather than distance had likely
effect on utilization of those services located outside or in
another camp. Since all three districts were in the same
Conflict and Health 2007, 1:12 />Page 3 of 9
(page number not for citation purposes)
security phase as classified by United Nations (phase III),
we presumed that there was no significant differences in
the level of violence that would effect utilization differ-
ently among the districts.
In order to estimate and compare the size of the popula-
tion receiving these services among districts, we divided
the monthly utilization figures per estimated number of
eligible individuals in a district per 1000 persons. For
PMTCT, the number of eligible pregnant women was esti-
mated by multiplying district antenatal HIV prevalence
with a projected pregnant population (which is 5.2% of
the district population based on projected census figures).
During the survey, the antenatal HIV prevalence for Gulu,
Kitgum and Pader was 11.9%, 7.2% and 11% respectively
[13]. Since no district specific HIV sero-prevalence data
was available, we estimated ART eligible individuals by
multiplying the number of people infected with HIV/
AIDS using northern Ugandan region seroprevalence rate
of 8.2% [4] by 15% which is the percentage of HIV
infected individuals who are eligible for ART [13]. For
VCT, we compared the utilizations by estimating the pro-
portions of clients' attendance and the district population
aged 15–49 years of age (39.1% of population based on
census projections) per 1000 persons. Since this study did
not include the conflict-free control region from another
part of Uganda for comparison, instead we compare our
findings with the targets set by Uganda Health Sector Stra-
tegic plan (HSSP II). This also determined the gaps in serv-
ice provision.
Data from the three districts were entered on Visual Fox-
Pro 7 (Microsoft Corp, Redmond, WA, USA) and analyzed
using SAS 8.1 (SAS Institute, Cary, NC, USA). After merg-
Uganda map showing the surveyed Northern districts of Gulu, Kitgum and PaderFigure 1
Uganda map showing the surveyed Northern districts of Gulu, Kitgum and Pader.
Conflict and Health 2007, 1:12 />Page 4 of 9
(page number not for citation purposes)
ing the three district datasets, data was exported to Micro-
soft Excel, then saved as Dbase before being exported to
ArcView GIS 3.3 (ESRI) software to produce maps for the
geographical locations of camps and those health facilities
offering VCT, PMTCT and ART services. In this study, the
health facility was considered functional when there was a
facility structure, supplies and service providers with evi-
dence of service utilization as shown in the client registers.
Ethical approval
The study received an approval from the Uganda Ministry
of Health and the offices of the district directors of health
services in all the three districts. The methodology was
also peer reviewed and approved by Uganda Ministry of
Health and Bureau of Statistics.
Results
In total, there were 167 health facilities and 132 IDP
camps (population ranging from 200 to 54,610) in the
three surveyed districts. Of the total health facilities, 119
(71.3%) were functional [health center II (HC II) = 65;
health center III (HC III) = 39; health center IV (HC IV) =
7; hospitals = 8] with Gulu having 60 (50.4%), Kitgum 25
(21%) and Pader 34 (28.6%) facilities.
Voluntary Counseling and Testing (VCT)
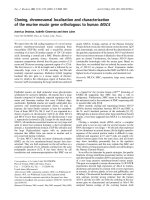
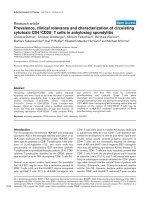
Figure 2 shows the availability and distribution of VCT
services by camps. As shown, VCT sites were evenly dis-
tributed across the counties except in the southern parts of
Kilak, Aswa and Aruu counties. Of the 14 VCT sites in
Gulu district, 5 (35.7%) were located in the municipality.
Availability of VCT sites according to health facility level
is presented in table 1. Of the 32 total VCT centers in
Acholi sub-region, 11 (34.3%) were located in health
center III and the rest were evenly distributed among other
health facility levels.
Similarly, 7 (21.9%) of the total VCT sites reported stock-
out of HIV testing kits on the day of the survey. All VCT
sites had at least one full time health worker. Thus, in all
Availability and distribution of VCT services according to the IDP camps in Gulu, Kitgum and Pader districts, April 2006Figure 2
Availability and distribution of VCT services according to the IDP camps in Gulu, Kitgum and Pader districts, April 2006.
Conflict and Health 2007, 1:12 />Page 5 of 9
(page number not for citation purposes)
the three districts, 2 (33.3%) of VCT sites in HC II had all
minimum components; the percentages were 8 (72.7) for
HC III, 6 (85.7%) for HC IV and 8 (100%) for hospitals.
Data on utilization showed that during the previous one
month prior to the survey, there were 9314 clients who
received HIV counseling in all the three districts, however
out of total clients counseled, 6772 (72.7%) were tested
for HIV. In Gulu and Kitgum, the proportions of clients
per districts' populations aged 15–49 years who had HIV
testing in the last month were 18 and 17 per 1000 persons
respectively, while in Pader this proportion was 6 per
1000 persons.
Prevention of Mother to Child Transmission of HIV
(PMTCT)
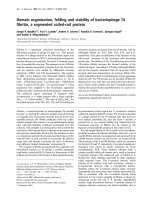
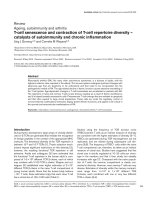
The availability and distribution of PMTCT sites according
to the camps is presented in figure 3. As shown, PMTCT
sites were equally distributed among districts but une-
venly distributed among counties and camps. In Gulu, of
the 5 PMTCT sites available, 3 (60%) were located in the
municipality while other counties such as Kilak and
Omoro with a total of 30 camps (populations ranging
from 200 to 54,650), did not have PMTCT site. Similarly,
Northern side of Kitgum district closer to Sudan border
with 9 camps (populations ranging from 200 to 33050)
did not have any PMTCT site. In table 1, which shows the
availability of PMTCT by the level of health facility, of the
15 PMTCT sites available, 13 (86.7%%) had HIV test kits
Availability and distribution of PMTCT services according to the IDP camps in Gulu, Kitgum and Pader districts, April 2006Figure 3
Availability and distribution of PMTCT services according to the IDP camps in Gulu, Kitgum and Pader districts, April 2006.
Table 1: Availability of VCT, PMTCT and ART according to
health facility level in Acholiland
Health facilities VCT PMTCT ART
Health center II 6 (18.8%) 1 (6.7%) 0 (0%)
Health center III 11 (34.3%) 4 (26.7%) 1 (10%)
Health center IV 7 (21.9%) 3 (20%) 1 (10%)
Hospitals 8 (25%) 7 (46.6%) 8 (80%)
Total 32 15 10
Conflict and Health 2007, 1:12 />Page 6 of 9
(page number not for citation purposes)
on the day of the survey and 14 (93.3%) had intra- and
post-partum facilities and none of the PMTCT sites
reported stock-out of Nevirapine. All sites had at least one
service provider for PMTCT services. Similarly, of the total
PMTCT sites, 13 (86.7%) had all minimum essential com-
ponents. Based on clients' records in the previous one
month [Gulu = 212; Kitgum = 50 and Pader = 9], there
were an estimated 63, 41 and 4 per 1000 eligible pregnant
women in Gulu, Kitgum and Pader respectively who
received Nevirapine for PMTCT.
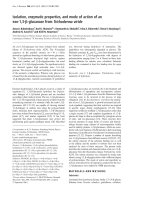
Antiretroviral Treatment (ART)
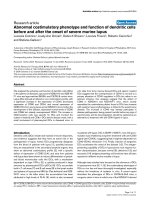
Figure 4 shows the availability and distribution of ART
sites according to the camps in the Acholi sub-region. The
figure shows that, ART sites were unevenly distributed
among districts and counties except in Pader district
where the 2 available ART sites were distributed in two
counties. Of the 6 ART sites in Gulu district, 4 (66.7%)
were located in the municipality. Also, 2 counties of Kilak
and Aswa in Gulu district with over 28 IDP camps (popu-
lations ranging from 200 to 54,650) did not have ART site.
Similarly in Kitgum district, all 2 ART sites available were
located in the municipality. Based on table 1, of the total
10 ART sites, 8 (80%) had at least one medical officer, 9
(90%) had HIV test kits, 6 (60%) had ARV available and
4 (40%) reported stock-out of ARV on the day of survey.
Only 6 (75%) of ART sites in the hospitals had all mini-
mum essential components while neither ART sites in HC
III nor IV had all the components. Based on clients'
records in the previous one month [Gulu = 146; Kitgum =
472 and Pader = 10], there were an estimated 22, 119 and
2 per 1000 ART eligible individuals in Gulu, Kitgum and
Pader respectively who received ART.
The gaps in service provision
The gaps in VCT, PMTCT and ART service provision are
summarized in tables 2. Based on HSSP II targets, there
was 100% availability of VCT services at HC IV and hospi-
tals, however at HC III, VCT services availability was
28.2% of the expected target. For PMTCT sites, 21.1%,
Availability and distribution of ART services according to the IDP camps in Gulu, Kitgum and Pader districts, April 2006Figure 4
Availability and distribution of ART services according to the IDP camps in Gulu, Kitgum and Pader districts, April 2006.
Conflict and Health 2007, 1:12 />Page 7 of 9
(page number not for citation purposes)
42.9% and 87.5% of HSSP II targets were reached at HC
III, HC IV and hospitals respectively. Similarly, 20% and
100% of HSSP II targets for provision of ART services were
reached at HC IV and hospitals respectively.
Discussion
This was the first comprehensive mapping and assessment
that determined access to VCT, PMTCT and ART services
in a conflict affected Northern Uganda. Given the large
population affected by this conflict coupled with high
HIV/AIDS prevalence, the results of this study confirms
the limited access due to inadequacy and uneven distribu-
tion of these services among the districts, counties and
camps. Complicating the situation is insecurity, ongoing
establishments of new settlements and large number of
IDP camps scattered in a vast geographical area in these
districts. Among the three districts, access to VCT, PMTCT
and ART services was relatively better in Gulu evidenced
by both, large number of facilities providing these services
and utilizations. The likely reasons might be its compara-
tively large population size and longer humanitarian crisis
that attracted most of relief assistance including provision
of HIV related services. Similarly, Gulu as a former head-
quarters for Acholi sub-region, has a well-developed infra-
structure system with relatively more capacity to support
humanitarian operations.
The finding that most VCT, PMTCT and ART services were
clustered in urban areas is consistent to the literature
[13,14]. This geographical inequity has left most camps
and rural areas lacking these services. Conversely, while
VCT services were evenly provided across health facility
levels, PMTCT and ART were mostly available at Health
center IV and hospitals. This might be due to the fact that
VCT has been ongoing in Uganda for decades while
PMTCT and ART have been recently introduced. Another
reason is the policy issue as in Uganda ART services are
required to be provided at HC IV and above, with a med-
ical officer being a pre-requisite [6,10] while for PMTCT,
the policy requires this service to start at HC III and above
[10].
Availability of minimum essential components also
shows a similar pattern of inadequacy at lower health
facility levels. The results of the stock-outs of HIV test kits
and drugs at lower health facilities reflect limited capacity
of supply chain system probably as a result of insecurity or
funding. Similarly, shortage of health staff for ART might
be due not only to inadequate number but mal-distribu-
tion of this cadre within and among the districts. For
instance in Gulu, 79% of all medical officers work in the
hospitals within the Municipality and 86% of those in
Pader work in one hospital [15]. As most of these hospi-
tals are located in municipalities, this further indicates
urban-rural disparities in the access particularly to PMTCT
and ART in northern Uganda.
Based on our data, there is evidence of utilization of VCT,
PMTCT and ART services in all the districts. For VCT, the
data showed a significant proportion of those counseled
received HIV testing, however, our study did not assess the
characteristics or reasons for those clients who did not
take HIV testing. Our results also show that most PMTCT
utilization was observed in Gulu despite an even distribu-
tion of PMTCT sites among districts. This is likely due to
the presence of large number of hospitals compared to
Kitgum and Pader reflecting the possible differences in
quality of services. The paradoxical finding of ART utiliza-
tion in which Kitgum had highest proportion of individu-
als on ART in the last month despite the limited number
of ART sites should be interpreted cautiously. Without
data on monthly trends in utilizations, this finding can be
misleading. Yet, for Pader district the consistent lowest
utilizations of VCT, PMTCT and ART shown by this study
is likely driven by the inadequacy of services and resources
including stock-outs of medicines as reported by other
studies in the past [5,13-15]. However, other factors such
as demographic and insecurity differences which have not
been elucidated by this study, might also be the likely
explanation.
In health system perspective, access defined in terms of
physical availability and service utilization, is one of the
intermediate outcome measures which has been increas-
Table 2: Availability of VCT, PMTCT and ART services compared to HSSP target
Health facility
level
Functional
health facilities
Number of
VCT sites
HSSP target for
VCT*
Number of
PMTCT sites
HSSP target for
PMTCT**
Number of ART
sites
HSSP target for
ART***
HC II 65 6 1
HC III 39 11 (28.2%) 39 4 (21.1%) 19 1
HC IV 7 7 (100%) 7 3 (42.9%) 7 1 (20%) 5
Hospitals 8 8 (100%) 8 7 (87.5%) 8 8 (100%) 8
Total 119 32 (59.3%) 54 15 (44.1%) 34 10 (66.7%) 15
* HSSP II target is 100% of HC III and above to have VCT services
** HSSP II target is 50% of all HC III and 100% at HC IV and above to have PMTCT services
*** HSSP II target is 75% of all HC IV and 100% of hospitals to have ART services
Conflict and Health 2007, 1:12 />Page 8 of 9
(page number not for citation purposes)
ingly used to determine health system performance as it
influences both, health status and client satisfaction [9].
In this context, our findings of limited access to VCT,
PMTCT, ART might be a reflection of limited HIV/ART sys-
tem performance in this region. The findings of other
studies on high prevalence and mortality due to HIV/
AIDS in Northern Uganda [4,5], might likely be proxi-
mately related by limited access of these services as
depicted by this study. Similarly, the gaps observed by this
study, underpins the importance of scaling up of VCT,
PMTCT and ART in this sub-region. The main challenge
however is that most of the health facilities in rural areas
or camps comprise of lower health facility levels which
lack appropriate health personnel and medicines to offer
services such as PMTCT and ART. Critical to this is there-
fore a review of current policies including the recruitment
and retention of appropriate staff so that services like
PMTCT and ART can be rolled out to lower-level health
facilities.
Despite the evidence that application of GIS methodology
in emergency settings is limited [16], still there were no
studies which determined the feasibility of its use in these
settings. In our study, the training on the use of GPS
receivers, which were ordered locally, was done by
Uganda authorities indicating that the local expertise is
available. The analysis of data and production of maps
was also accomplished locally. Training and complete
data collection in this insecure and wide geographical area
took less than 1 month. These indicated that using GIS as
a tool in health assessments in conflict settings is feasible
and can be locally undertaken.
Our finding of access can be limited by several factors. The
use of last month facility attendance for measuring and
comparing utilization among the districts can be event
driven and might not accurately represents monthly aver-
age or variations in utilizations. This type of data can not
give users' perspective on utilization and may lack com-
prehensive information of other determinants of utiliza-
tion such as demographic variations, acceptability or user-
satisfaction. Shortage of staff at lower health facilities
might likely impair data collection hence underreporting
utilizations. Using district population to estimate and
compare utilizations among districts is also likely to be
misleading. The use of catchment populations which the
facility sub-served would have increased the reliability of
our comparisons. Moreover, absence of the comparison
district which is conflict-free, is another limitation as it
would have determined whether the limited access to and
gaps in providing VCT, PMTCT and ART services in north-
ern Uganda was attributed to the longstanding conflicts. It
is therefore essential to further examine other factors that
affect access particularly the correlates of utilization of
these services in this conflict region so as to achieve the
goal of universal access by 2010.
In conclusion, the study shows that access to VCT, PMTCT
and ART services in northern Uganda is geographically
limited due to inadequacy and uneven availability and
utilization of these services among districts, health facili-
ties and camps with Pader district mostly affected.
Addressing the gaps depicted by this study requires policy
review, equitable geographical re-distribution or recruit-
ment of appropriate staff and scaling up plans focusing on
essential minimum components of services at lower
health facilities. This study has shown that measuring
access in emergencies not only provides information for
health policy and planning but supplements information
related to health system performance and health status of
the population. Similarly, application of GIS for health
need assessments in conflict settings is feasible and maps
can be effective in presenting large set of data into simplis-
tic, visual friendly and easily interpretable information.
Competing interests
The author(s) declare that they have no competing inter-
ests.
Authors' contributions
Dick Chamla designed the study protocol, ensured quality
of data, assisted in data analysis and wrote the first draft
of this article. Olushayo Olu contributed to the protocol
development, mobilized resources, supervised data col-
lection and assist in writing this article. Jennifer Wanyana
supervised field implementation of this study, data collec-
tion, data analysis and contributed to the writing of the
article. Natseri Nasan trained interviewers in the use of
GPS, produced maps and contributed to the methodology
section of the article. Melville George and Abdikamal Alis-
alad provided overall central supervision of the study,
organized financial resources from donors, reviewed the
protocol and contributed to the article writing. Eddie
Mukooyo and Sam Okware supervised Uganda ministry
of health staff, reviewed the protocol and submitted it for
ethical approval and contributed in this article. All
authors have read and approved the final manuscript.
Acknowledgements
Authors would like to thank Drs Juliet Nabyonga, Rosamund Lewis and
Miriam Nanyunja for their contribution and review of this article. Appreci-
ations should also go to the staff at Uganda Bureau of Statistics and
Resource center for their inputs on cartography; district directors of health
for Gulu, Kitgum and Pader; Shanthi Noriega of WHO Health Metrics Net-
work and staff of Health Leadership services departments in Geneva.
Similarly, we acknowledge the financial assistance from DFID through
Uganda WHO and UNICEF offices as well as material contributions from
Uganda ministry of health, bureau of statistics and district health directors
of the three study districts.
Publish with Bio Med Central and every
scientist can read your work free of charge
"BioMed Central will be the most significant development for
disseminating the results of biomedical research in our lifetime."
Sir Paul Nurse, Cancer Research UK
Your research papers will be:
available free of charge to the entire biomedical community
peer reviewed and published immediately upon acceptance
cited in PubMed and archived on PubMed Central
yours — you keep the copyright
Submit your manuscript here:
/>BioMedcentral
Conflict and Health 2007, 1:12 />Page 9 of 9
(page number not for citation purposes)
References
1. Ellman T, Culbert H, Torres-Feced V: Treatment of AIDS in con-
flict-affected settings: a failure of imagination. Lancet 2005,
365(9456):278-80.
2. OCHA: Consolidated Appeal for Uganda, 2007. OCHA publica-
tion [ />page.asp?Page=1498]. Accessed on the 2
nd
January 2007
3. Akumu C, Amony I, Otim G: Suffering in Silence: a study of sex-
ual gender based violence (SGBV) in Pabbo camp, Gulu dis-
trict, Northern Uganda. UNICEF 2005 [ />rw/RWB.NSF/db900SID/KHII-6DE3ZR?OpenDocument]. Accessed
on 29
th
Dec 2006
4. Uganda Ministry of Health: Results from the 2004–05 Uganda
HIV/AIDS Sero-Behavioural Survey (UHSBS). Uganda MoH
2006.
5. WHO, UNICEF, WFP, UNFPA and IRC: Health and mortality
survey among internally displaced persons in Gulu, Kitgum
and Pader districts, Northern Uganda. WHO 2005 [http://
www.who.int/hac/crises/uga/sitreps/Ugandamortsurvey.pdf].
Accessed on the 2nd January 2007
6. Penchansky R, Thomas JW: The concept of access: definition
and relationship to consumer satisfaction. Medical Care 1981,
19(2):127-140.
7. Caley L: Using geographical information systems to design
population based intervention. Publ H Nursing 21 6:547-554.
8. Uganda Ministry of Health: Health Sector Strategic Plan II: 2005/
06–2009/2010. Uganda Ministry of Health publication 2005.
9. WHO health statistics and information systems: Service Availabil-
ity Mapping. WHO Geneva 2006 [ />systems/serviceavailabilitymapping/en/]. Accessed on 30
th
Nov 2006
10. Pappa E, Niakas D: Assessment of health care needs and utili-
zation in a mixed private-public system: the case of Athens
area. BMC health service research 2006, 6:146.
11. Roberts M, Hsiao W, Berman P, Reid M: Getting Health Reform
Right: a guide to improving performance and equity. Oxford
University Press; 2004.
12. Ugandan ministry of health: National Antiretroviral Treatment
and Care Guidelines For Adults and Children. Ministry of
Health Uganda 2003.
13. Uganda Parliamentary committee on HIV/AIDS: Report on HIV/
AIDS Regional Forum on Northern Uganda. Ministry of Health
publications 2005.
14. Office of Prime Minister, UNDP: Northern Uganda IDP Re-pro-
filing study. UNDP/OPM Uganda 2005.
15. Ministry of Health: Mapping and Assessment of Health Services
Availability in Northern Uganda, Technical Report, April –
May 2006. Uganda Ministry of Health 2006.
16. Kaiser R, Spiegel PB, Henderson AK, Gerber ML: The application
of geographic information systems and global positioning
systems in humanitarian emergencies: lessons learned, pro-
gramme implications and future research. Disasters 2003,
27(2):127-40.