Báo cáo y học: "haracterization of regulatory T cells in urban newborns" pptx
Bạn đang xem bản rút gọn của tài liệu. Xem và tải ngay bản đầy đủ của tài liệu tại đây (508.61 KB, 10 trang )
BioMed Central
Page 1 of 10
(page number not for citation purposes)
Clinical and Molecular Allergy
Open Access
Research
Characterization of regulatory T cells in urban newborns
Ngoc P Ly*
1
, Begona Ruiz-Perez
2
, Rachel M McLoughlin
2
,
Cynthia M Visness
3
, Paul K Wallace
4
, William W Cruikshank
5
,
Arthur O Tzianabos
2
, George T O'Connor
5
, Diane R Gold
2
and James E Gern
6
Address:
1
Pediatric Pulmonary Medicine, University of California San Francisco Children's Hospital and UCSF Medical School, San Francisco, CA,
USA,
2
Channing Laboratory, Department of Medicine, Brigham and Women's Hospital, Boston, MA, USA,
3
Rho Federal Systems Division, Inc,
Chapel Hill, NC, USA,
4
Roswell Park Cancer Institute, Buffalo, NY, USA,
5
Boston University Medical Center, Boston, MA, USA and
6
University of
Wisconsin, Madison, WI, USA
Email: Ngoc P Ly* - ; Begona Ruiz-Perez - ;
Rachel M McLoughlin - ; Cynthia M Visness - ;
Paul K Wallace - ; William W Cruikshank - ; Arthur O Tzianabos - ;
George T O'Connor - ; Diane R Gold - ; James E Gern -
* Corresponding author
Abstract
Background: In the United States, asthma prevalence is particularly high among urban children.
Although the underlying immune mechanism contributing to asthma has not been identified, having
impaired T regulatory (Treg) cells at birth may be a determining factor in urban children. The
objective of this study was to compare Treg phenotype and function in cord blood (CB) of
newborns to those in peripheral blood (PB) of a subset of participating mothers.
Methods: Treg numbers, expression, and suppressive function were quantified in subjects
recruited prenatally from neighborhoods where ≥ 20% of families have incomes below the poverty
line. Proportion of Treg cells and expression of naïve (CD45RA) or activated (CD45RO, CD69,
and HLA-DR) markers in CD4
+
T cells was measured by flow cytometry. Treg suppressive capacity
was determined by quantifying PHA-stimulated lymphocyte proliferation in mononuclear cell
samples with and without CD25 depletion.
Results: In an urban cohort of 119 newborns and 82 mothers, we found that newborns had similar
number of cells expressing FOXP3 as compared to the mothers but had reduced numbers of
CD4
+
CD25
+
bright cells that predominantly expressed the naïve (CD45RA) rather than the
activated/memory (CD45RO) phenotype found in the mothers. Additionally, the newborns had
reduced mononuclear cell TGF-β production, and reduced Treg suppression of PHA-stimulated
lymphocyte proliferation compared to the mothers.
Conclusion: U.S. urban newborns have Treg cells that express FOXP3, albeit with an immature
phenotype and function as compared to the mothers. Longitudinal follow-up is needed to delineate
Treg cell maturation and subsequent risk for atopic diseases in this urban birth cohort.
Published: 8 July 2009
Clinical and Molecular Allergy 2009, 7:8 doi:10.1186/1476-7961-7-8
Received: 3 February 2009
Accepted: 8 July 2009
This article is available from: />© 2009 Ly et al; licensee BioMed Central Ltd.
This is an Open Access article distributed under the terms of the Creative Commons Attribution License ( />),
which permits unrestricted use, distribution, and reproduction in any medium, provided the original work is properly cited.
Clinical and Molecular Allergy 2009, 7:8 />Page 2 of 10
(page number not for citation purposes)
Introduction
The ability of CD4
+
CD25
+
T regulatory (Treg) cell to
down-regulate immune responses associated with asthma
in experimental animal models [1-4] has recently ignited
interest in defining the role of Treg cells in allergy and
asthma in humans. Most studies on the association
between Treg and asthma/allergy have focused on adults
[5-8] with allergy or on children [9] with established
asthma. Since a majority of cases of asthma are diagnosed
in early childhood, [10,11] characterizing Treg phenotype
and function in at-risk children prior to the clinical man-
ifestation of asthma may provide a more cohesive under-
standing of Treg ontogeny and the impact dysregulated
Treg have on the development of asthma. Recently, two
studies have suggested that Treg function may be impaired
among newborns with either a parental [12] or more spe-
cifically a maternal [13] history of atopy. While parental
atopy/asthma is a risk factor [14-16] for childhood
asthma, environmental factors [17,18] also play a signifi-
cant role in asthma development. In the United States,
asthma tends to be more prevalent [19] and severe [20]
among urban children as compared to non-urban chil-
dren.[21] Neonatal and infant Treg phenotype and func-
tion, which may influence asthma and allergy
development, have not been characterized in an urban
birth cohort. In this study we compared Treg numbers,
expression, and function in newborns to a subset of moth-
ers participating in the Urban Environment and Child-
hood Asthma (URECA) study.
Methods
Study population
Study subjects included a subset of newborns and moth-
ers from the Boston metropolitan area who participated in
the URECA (Urban Environment and Childhood
Asthma) Study, a multi-center birth cohort study examin-
ing the relationship between immune responses, the envi-
ronment, and asthma development [22] Subjects were
enrolled from February 2005 to March 2007. Inclusion
criteria were residence in census tracts with at least 20% of
the residents having income below the poverty level; ges-
tational age ≥ 34 weeks; a parental history of atopic dis-
ease (asthma, hay fever, or eczema); plan to deliver at the
study hospital; maternal ability to speak English or Span-
ish; and access to a phone. Exclusion criteria were mater-
nal HIV infection at delivery; plans to move out of
geographic area during the period of the study; newborn
respiratory distress requiring intubation and ventilation
for ≥ 4 hours after delivery or supplemental oxygen and/
or CPAP for ≥ 4 days; significant congenital anomalies;
and immediate postnatal antibiotic treatment for pneu-
monia. This study was approved by the Institutional
Review Boards of Boston University and Brigham and
Women's Hospital.
Demographic, birth, parental conditions, and other
variables
Parental demographic and health history were collected
by questionnaires. Data on neonatal weight, gestational
age, and neonatal intensive care admission were obtained
from hospital records.
Cord and Peripheral Blood Mononuclear Cell Isolation
Umbilical cord blood samples were collected by needle/
syringe from the umbilical vein after delivery into
heparinized tubes. Peripheral venous blood was obtained
from a subset of mothers enrolled in the study at the
child's 12-month follow-up visit. At the discretion of the
investigator, blood was not obtained from mothers who
were acutely ill. All blood samples were processed within
24 hours. Cord and peripheral blood mononuclear cells
(MNCs) were isolated by density gradient centrifugation
with Ficoll-Hypaque Plus (Amersham Biosciences, UK).
Depletion of CD25
+
T cells
All experiments were performed with fresh, non-cryopre-
served cells [22]. The cell sample from each subject was
divided into 2 equal aliquots. Depletion of CD25
+
T lym-
phocytes was performed on the first aliquot using MACS
columns with a positive CD25
+
T-cell selection kit
(Miltenyi Biotech Inc., Auburn, CA). The second aliquot
was not depleted of CD25
+
T cells but was subjected to the
same separation process using MACS column with anti-
FITC which is an irrelevant antibody (Miltenyi Biotech
Inc., Auburn, CA). The CD25
+
microbeads removed
between 85–95% of CD4
+
CD25
+
T cells as analyzed by
FACS (data not shown).
Proliferation assay
Undepleted or CD25
+
depleted MNCs (1 × 10
5
/well) were
cultured in triplicate in 96 well round-bottom plates con-
taining AIM-V serum-free medium (Invitrogen Corp.,
Grand Island, NY) alone or with 5 μg/ml PHA added.
After 4 days of incubation at 37°C, supernatant for each
of the experimental condition was collected and stored at
-80°C for future analyses of cytokines. The remaining cell
cultures were pulsed for 6 hours with 1 μCi of [
3
H] thymi-
dine/well (NEN™, Life Science Products, Inc., Boston, MA)
and proliferation was measured using a β-scintillation
counter (Wallac Microbeta Trilux, Perkin Elmer,
Waltham, MA). Results were expressed as proliferation
index (PI), calculated as ratio of mean counts per minute
(cpm) of stimulated over mean cpm of unstimulated cell
triplicates.
Regulatory T-cell function has been defined as the ability
to suppress lymphocyte proliferation in vitro. [23,24] Due
to the low numbers of cells available in this study, we
adopted a method from Taams et al [25] and modified it
to indirectly measure suppressive activity of T-regs in par-
Clinical and Molecular Allergy 2009, 7:8 />Page 3 of 10
(page number not for citation purposes)
ticipating subjects. The capacity of CD25
+
T-cells to sup-
press proliferation in each subject was determined by
comparing lymphoproliferative response of their MNCs
to PHA stimulation in a cell sample that was depleted of
CD25 to those that were not depleted of the CD25cell
population. To establish the effects of CD25 depletion on
proliferative activity we also calculated the suppressive
index (SI), which is a ratio of PI for CD25depleted to
CD25undepleted cell sample.
TGF-
β
analysis
TGF-β levels in the cell culture supernatant harvested 4
days after incubation at 37°C were quantified by ELISA
using an R&D Systems Duoset (R&D Systems, Inc., Min-
neapolis, MN) according to the manufacturer's instruc-
tions.
Flow cytometric analysis
For surface staining, aliquots of 2 × 10
6
cord or peripheral
blood MNCs were washed once in phosphate buffered
saline (PBS). The cell pellet was resuspended at approxi-
mately 1 × 10
7
cells/ml in PBS containing 20 μg/ml mouse
IgG (Invitrogen Corporation, Carlsbad, CA) to serve as an
Fc receptor block. Tubes were mixed and incubated for 10
min on ice. Subsequently, 50 μl of cells was added to
tubes containing cocktails of fluorochrome labeled mAbs.
All mAbs were pretitered and used at saturating concentra-
tions. The following mAbs were used in this study (CD3
(clone SK7), CD4 (clone SK3), CD25 (clone 2A3), CD45
(clone 2D1), CD45RA (clone ALB11), CD45RO (clone
UCHL.1), CD69 (clone L78), HLA-DR (clone L243) from
BD Bioscience (San Jose, CA), FOXP3 (clone 206D) and
its isotype control (clone MOPC-21) were purchased from
BioLegend (San Diego, CA). The sample tubes were
mixed, returned to the ice bath for 30 minutes, and
shielded from light to reduce possible photobleaching.
After the incubation with mAbs, RBC were lysed with
ammonium chloride (0.155 M NH
4
CI, 10 mM KHCO
3
,
0.089 mM EDTA) and washed with PBS before fixing in
2% Ultrapure formaldehyde (Polysciences, Inc., War-
rington, PA).
A modification of the surface staining procedure was used
for intracellular FOXP3 staining. After the final PBS wash,
but before formaldehyde fixation, the cells were resus-
pended in FOXP3 Fix/Perm buffer (BioLegend, San Diego,
CA) and incubated in the dark, at room temperature for
30 minutes. The cells were then washed twice with FOXP3
Perm buffer (BioLegend, San Diego, CA) and resuspended
in 50 μl of Perm buffer containing 100 μg/ml human IgG
Cohn fraction II and III (Sigma-Aldrich, St. Louis, MO) for
10 minutes before adding the anti-FOXP3 or isotype con-
trol mAbs. Cells were incubated for an hour in the dark,
washed once with Perm buffer, and then once with PBS
before fixing in 2% formaldehyde.
CD4
+
CD25
+
brights were defined by gating on lym-
phocytes (using forward and side scatter) and CD3
+
cells,
then using a CD4 versus CD25 histogram a region was cre-
ated defining the CD4
+
CD25
+
(total) and
CD4
+
CD25
+
bright cells. The CD4
+
CD25
+
(total) region
was defined based on comparison to an isotype control,
the CD25
+
bright population was defined in a two step
process, first as the population that was brighter than the
CD4
-
CD25
+
population and next by their slightly dimmer
CD4 intensity as originally defined by Baecher-Allan, C. et
al [26]
Stained cells were stored in the dark at 4°C for no longer
than 3 days before data acquisition. Samples were ana-
lyzed using the FACSCanto cytometer (BD Bioscience, San
Jose, CA) running DiVA acquisition software. Excitation
signals from FITC (515/30 BP), PE (564/42 BP), PerCP
(>670 LP) and PECy7 (750/60 BP) were collected off the
solid state 488 nm line and APC (650/20) was collected
off the HeNe 633 nm laser line. Cell viability was deter-
mined by the Live/Dead fixable green stain according to
the manufacturer's recommendations (Invitrogen,
Carlsbad, CA). Specimens with viabilities less than 85%
were excluded from analysis.
Statistical Analyses
The Chi-square test was used to compare between-group
proportions. The distributions of lymphocyte PI, SI,
CD25
+
, CD25
+
bright, FOXP3, and TGF-β expression were
skewed; therefore, median levels were presented for each
measurement and differences in the levels between CB
and PB, and between newborns with and without mater-
nal asthma were examined using nonparametric two-sam-
ple Wilcoxon tests. As described above we assessed
suppressive activity of CD4
+
CD25
+
T cells by comparing
the PI of samples before and after CD25 depletion, tested
using a Signed-rank test for matched comparisons, as well
as calculating SI which is a ratio of PI of CD25
+
depleted
to PI of CD25
+
undepleted. The associations between
CD25
+
bright, CD25
+
FOXP3+ cell numbers, and SI were
determined using Spearman rank correlation. All analyses
were performed using SAS, version 9 (SAS Institute, Cary,
NC) and the R system for statistical computing [27]
Results
Subject characteristics
The subjects in this study consisted of a subset of new-
borns and mothers enrolled in URECA at the Boston study
site. Of the 119 newborns, FACS data characterizing Treg
phenotype was available on 114 samples and lymphocyte
proliferation data characterizing function was generated
on 78 samples. There were no statistical differences in
baseline characteristics of newborns with and without
proliferation data (Table 1). Although 8 of the infants
were admitted to the ICU, none of them were intubated
Clinical and Molecular Allergy 2009, 7:8 />Page 4 of 10
(page number not for citation purposes)
Table 1: Baseline characteristics of newborns in the URECA study with and without lymphocyte proliferation data.
Total
(N = 119)
With Data* (N = 78) Without Data* (N = 41)
N (%) N (%)
Sex
Male 64 (53.8) 44 (56.4) 20 (48.8)
Female 55 (46.2) 34 (43.6) 21 (51.2)
Race/ethnicity
Hispanic 25 (21.0) 16 (20.5) 9 (22.0)
Black 62 (52.1) 43 (55.1) 19 (46.3)
White/Asian/Other 4 (3.4) 2 (2.6) 2 (4.9)
More than one race 24 (20.1) 14 (17.9) 10 (24.4)
Unknown 4 (3.4) 3 (3.9) 1(2.4)
NICU admissions 8 (6.7) 4 (5.3) 4 (9.8)
Maternal History**
Eczema 37 (33.0) 23 (31.9) 14 (35.0)
Asthma 59 (53.2) 40 (55.6) 19 (48.7)
Hay fever 51 (46.4) 34 (48.6) 17 (42.5)
Paternal History**
Eczema 22 (17.5) 13 (21.0) 3 (8.3)
Asthma 35 (27.8) 20 (32.3) 9 (25.0)
Hay fever 30 (25.9) 15 (27.8) 12 (34.3)
* No statistically significant difference between newborns with and without lymphocyte proliferation data, p < 0.05.
** Seven of the participants have missing data on maternal and paternal history. Paternal history was reported as unknown in one participant.
Table 2: Baseline characteristics of mothers in the URECA study with and without lymphocyte proliferation data
Total
(n = 82)
With Data
(N = 52)
Without Data (N = 30)
N (%) N (%)
Race/ethnicity
Hispanic 24 (29.6) 16 (31.4) 8 (26.7)
Black 40 (49.4) 20 (39.2) 20 (66.7)
White/Asian/Other 7 (8.6) 6 (11.8) 1 (3.3)
More than one race 10 (12.4) 9 (17.7) 1 (3.3)
Atopic disease
Eczema 30 (37.0) 19 (37.3) 11 (36.7)
Asthma* 48 (60.0) 26 (51.0) 22 (75.9)
Hay fever 39 (49.4) 27 (55.1) 12 (40.0)
Intake of steroids during pregnancy 18 (22.0) 11 (21.2) 7 (23.3)
Mean (SD)
Age 26.1 (6.7) 26.9 (7.2) 24.7 (5.7)
* Statistically significant difference between mothers with and without lymphocyte proliferation data, p < 0.05.
Clinical and Molecular Allergy 2009, 7:8 />Page 5 of 10
(page number not for citation purposes)
and ventilated. Of the 82 mothers, FACS data was availa-
ble on 79 and lymphocyte proliferation data was gener-
ated on 52 (Table 2). Baseline characteristics were similar
among mothers with and without proliferation data
except mothers with proliferation data were less likely to
have a history of asthma (p < 0.05). Approximately 85%
of the mothers (n = 67) had atopy (i.e., asthma, hay fever,
or eczema) with 39% of mothers (n = 32) having a mater-
nal history of 2 out of 3 of the diagnoses of eczema,
asthma, and hay fever. Of the newborns 80 percent (n =
89) had a maternal history of atopy. FACS analysis and
proliferation data were not available for all mother-child
pairs because of limitation in cell yields and missed 12-
month follow-up visits (for the maternal samples).
Proportion of CD4
+
CD25
+
bright and CD4
+
CD25
+
FOXP3 T
cells in CB and maternal PB
Considering CD4
+
CD25
+
brightT-cells as marker for regu-
latory T cells, [26] we compared the proportion of
CD4
+
CD25
+
and CD4
+
CD25
+
bright T cells in CB and
maternal PB (Table 3). We found that CB contained fewer
CD4
+
CD25
+
and CD4
+
CD25
+
bright T-cells compared to
PB. Additionally, we illustrated that while there was a
clear separation of CD25
-
and CD25
+
expression on CB
CD4
+
cells, there was a broader range of CD25 expression
on PB CD4
+
cells, including a proportion of CD4 cells that
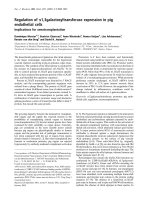
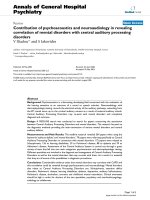
expressed intermediate levels of CD25 (Fig. 1A).
As TGF-β has previously been shown to up-regulate CD25
expression on CD4
+
T-cells in the periphery through
induction of FOXP3, [28] we next examined TGF-β pro-
duction by CB (n = 49) and PB (n = 59) MNCs. Consistent
with the finding of a reduced CD25
+
cell number in CB,
we found lower baseline and PHA-induced TGF-β levels
in CB as compared to PB MNCs (Fig. 1B).
FOXP3 transcription factor has been closely associated
with Treg cells, (19–21) especially with their development
and function [29-31]; therefore, we used intra-cellular
staining techniques to analyze FOXP3 expression in the
CD25
+
population in a subset of participants. We found
that the proportion of CD25
+
FOXP3
+
cells was similar
between CB and PB (Table 3); however, the profile of
FOXP3 distribution in CD25
+
cells differed between CB
and PB. For example, in CB, FOXP3 was expressed in
CD25 with various levels of expression while in PB,
FOXP3 was predominantly expressed in CD25
+
bright
cells (Fig. 1C). Moreover, we showed that CD25
+
bright
and FOXP3 expression were more tightly correlated in PB
(r
s
= 0.56, p < 0.0001) than in CB (r
s
= 0.24; p = 0.05).
Compared to CB, maternal PB had a greater proportion of
CD25
+
FOXP3
-
cells that are assumed to represent a higher
numbers of activated CD4
+
effector cells present in PB
(Fig. 1C).
Comparison of activation marker expression on CB and PB
regulatory T-cells
Having identified differences in the numbers of
CD25
+
bright cells present in CB and PB, we next sought to
establish whether or not these CD25
+
bright cells
expressed distinct patterns of differentiation/activation
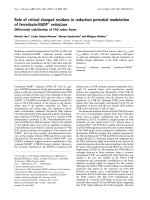
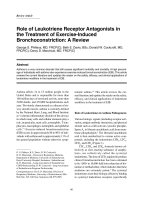
markers (C45RO, CD45RA, HLA-DR, and CD69). CD4
+
cells have also been classified as naïve or activated
depending on whether they expressed the CD45RA or
CD45RO isoform, respectively.[26,32,33] In our samples
(Figure 2), CD4
+
CD25
+
bright cells in CB exhibited a naïve
phenotype with the majority of cells expressing CD45RA
(77.3%) as compared to CD45RO (13.9%). Additionally,
only a small percentage of CD25
+
bright cells in CB stained
positive for the MHC class II molecule HLA-DR (1.1%)
with none of the cells expressing the early activation
marker CD69 (0.0%). In contrast, CD25
+
bright cells in
maternal PB exhibited an effector memory phenotype,
predominantly expressing CD45RO (82.1%), with
increased expression of HLA-DR (18.9%) compared to the
CB. The differences in CD45RO and HLA-DR expression
between CB and PB CD4
+
CD25
+
T cell populations were
statistically significant (p < 0.02).
Regulatory T-cell function in cord and maternal peripheral
blood MNCs
To determine regulatory T cell function in CB and PB, we
analyzed the ability of CD25
+
cells to suppress PHA-stim-
ulated lymphocyte proliferation. Depletion of CD25
+
cells
in CB resulted in little/no change in lymphocyte prolifer-
ation (p = 0.56) while depletion of CD25
+
cells in PB
resulted in increased lymphocyte proliferation (p = 0.02),
suggesting a reduced ability of CD25
+
cells in CB to sup-
press lymphoproliferative response as compared to PB
(Table 4). Reduced suppressive function of CD25+cells in
Table 3: Proportion of CD4
+
CD25
+
cells in cord blood and maternal peripheral blood
Cord Blood Maternal Peripheral Blood
N Median % Range N Median % Range Wilcoxon p-value
CD4
+
CD25
+
114 6.9 0.9–17.7 79 13.3 3.3–38.1 <0.0001
CD4
+
CD25
+
bright 114 1.4 0.2–8.5 79 1.9 0.6–4.5 0.002
CD4
+
CD25
+
FOXP3 63 3.3 0.1–7.8 78 3.1 0.5–6.7 0.71
Clinical and Molecular Allergy 2009, 7:8 />Page 6 of 10
(page number not for citation purposes)
Figure 1 (see legend on next page)
Clinical and Molecular Allergy 2009, 7:8 />Page 7 of 10
(page number not for citation purposes)
newborns compared to their mothers was further illus-
trated by a lower suppressive index (SI) in CB compared
to maternal PB (0.97 vs. 1.22; p < 0.09).
Next, we examined whether reduced CD4
+
CD25
+
number
and CD25
+
cell suppressive activity in cord blood were
associated with having a maternal history of asthma. The
proportion of CD4
+
CD25
+
(p = 0.20) and
CD4
+
CD25
+
bright (p = 0.55) cells were similar between
neonates with (n = 57) and without (n = 50) maternal
asthma. Interestingly, there was a trend for higher
CD25
+
FOXP3
+
cell number in neonates with (n = 24)
compared those without (n = 34) maternal asthma
(median [range] = 2.75 [0.10–7.80] vs. median [range] =
3.85 [1.00–7.30]); p = 0.07). However, reduced CD25
+
cell suppressive function was similar between neonates
with (n = 40) and without (n = 32) maternal asthma
(median [range] = 0.99 [0.11–2.51] vs. median [range] =
0.97 [0.27–4.18]; p = 0.54).
Association between CD4
+
CD25
+
number and suppressive
activity
Thus far we have shown that newborns and mothers had
different CD4
+
CD25
+
cell numbers, phenotype, and func-
tion. We next analyzed whether CD4
+
CD25
+
cell number
is associated with CD25
+
cell function. We found no cor-
relation between CD25
+
bright cell number and SI levels
in CB (r
s
= 0.04: p = 0.725) or in PB (r
s
= -0.14: p = 0.343).
Similarly, there was no correlation between CD25
+
FOXP3
+
cell number and SI level in CB (r
s
= -0.15; p =
0.315) or in PB (r
s
= 0.02; p = 0.905).
Discussion
The goal of this study was to characterize CD4
+
CD25
+
Treg
phenotype and function in a U.S. urban birth cohort that
is predominantly African American and Latino in ethnic-
ity, and to compare Treg cells from newborns to those of
the mothers. In our study, urban newborns had similar
number of cells expressing FOXP3 compared to the moth-
ers, but had reduced numbers of CD4
+
CD25
+
bright cells
that predominantly expressed the naïve (CD45RA
+
) rather
than the activated/memory (CD45RO
+
) phenotype found
in the mothers. In addition, the newborns had reduced
mononuclear cell TGF-β production, and reduced CD25+
cell suppressive capacity compared to the mothers, regard-
less of maternal history of asthma. Collectively, these
findings suggest that urban newborns have FOXP3
expressing Treg cells with immature phenotype and sup-
pressive capacity compared to the mothers.
TGF-β secretion in mononuclear cells and CD25 and Foxp3 expression in CD4
+
T-cells of cord blood (CB) and peripheral blood (PB)Figure 1 (see previous page)
TGF-β secretion in mononuclear cells and CD25 and Foxp3 expression in CD4
+
T-cells of cord blood (CB) and
peripheral blood (PB). (A) Contour plots of CD4 and CD25 expression in unstimulated CB and PB T-cells. Representative
examples of one out of 114 CB and 79 PB samples analyzed are shown, illustrating the separation of the CD25
-
and CD25
+
populations in CB CD4
+
cells as compared to a broader range CD25 expression in PB CD4
+
cells. (B) Production of TGF-β
cytokines by CB (n = 49) and PB (n = 59) mononuclear cells (MNCs) measured by ELISA in supernatants 4 days after incuba-
tion in media (unstimulated) and phytohemagglutinin (PHA). The median is represented by the horizontal bar within the box.
The upper and lower boundaries of the box represent the 25
th
to 75
th
percentiles of the data, respectively. Observations < 1.5
times the height of the box beyond either quartile are displayed within the whiskers. (C) Intracellular expression of Foxp3 in
unstimulated samples of CB and PB MNCs analyzed by flow cytometry. The CD4
+
cells were gated and analyzed for expression
of CD25 and FOXP3. The percentage of CD4
+
cells expressing CD25 and FOXP3 is shown in the upper right-hand quadrants.
FOXP3 are not distinctly expressed within the CD4
+
CD25
+
bright cell population in CB as compared to PB. Compared to CB,
maternal PB had a significant population of CD25
+
FOXP3
-
cells (upper left-hand quadrants). Results are representative exam-
ples of one out of 63 CB and 78 PB samples analyzed.
Comparison of activation markers between cord and periph-eral blood CD4
+
CD25
+
bright cellsFigure 2
Comparison of activation markers between cord and
peripheral blood CD4
+
CD25
+
bright cells. CD45RO,
CD45RA, CD69, and HLA-DR expression on CD4
+
CD25
+
bright cells sorted by flow cytometry and expressed
in percent. A majority of CB CD4
+
CD25
+
bright cells exhib-
ited a naïve phenotype. In contrast, PB CD4
+
CD25
+
bright
exhibited an activated/memory phenotype.
Clinical and Molecular Allergy 2009, 7:8 />Page 8 of 10
(page number not for citation purposes)
Similar phenotypic differences between newborn and
adult cells have been reported in studies not specifically
selected for urban environment. [26,32,33]The majority
of CB CD4
+
CD25
+
cells express the naïve T-cell marker
CD45RA, while maternal PB CD4
+
CD25
+
cells had an
activated/memory phenotype and expressed CD45RO. In
our study, we also found that maternal CD4
+
CD25
+
cells
were more likely to express the activation markers HLA-
DR and CD69. In contrast to previous findings showing
effective suppression of T-cell proliferation by both CB
and PB Treg cells, [32,34,35] we found reduced capacity of
CD25
+
T-cells to suppress PHA-stimulated lymphocyte
proliferation in CB as compared to maternal PB. Further-
more, Schaub et al. recently showed reduced number of
CD4
+
CD25
+
bright and impaired Treg suppressive func-
tion in healthy newborns compared to adults not selected
for urban environment. [36] and in offspring of atopic
compared to non-atopic mothers [13] TGF-β can induce
FOXP3 gene expression and mediate the transition of
naive peripheral CD4
+
CD25
-
cells into CD25
+
CD45RB
-/low
cells with suppressive activity [28] The difference in TGF-
β level and FOXP3 distribution in CB and maternal PB
may explain the functional differences between the new-
borns and their mothers. In this study, we compared lym-
phoproliferative responses in mononuclear cell samples
before and after CD25depletion.[25] This method
requires relatively few cells, which is an advantage in a
large clinical study with limited cell numbers. While
CD25 is an imperfect marker of Treg cells, the consistent
observation that CD25 depletion resulted in increased
lymphoproliferative responses to PHA in maternal PB
compared to CB suggests that were are depleting a regula-
tory cell population.
In our cohort, neither CD4
+
CD25
+
bright nor
CD4
+
CD25
+
FOXP3
+
cell numbers were associated with
CD25
+
cell function in CB or maternal PB. The German
study, [13] similarly did not find significant association
between CD25
+
FOXP3
+
cell number and Treg function.
Although, FOXP3 transcription factor plays a critical role
in Treg development and function, [29-31] FOXP3 is also
expressed by non-regulatory CD4
+
effector cells upon acti-
vation [37,38] Compared to their mothers, newborns had
reduced CD25
+
cell function despite having similar pro-
portion of cells expressing FOXP3
+
. Furthermore, while
there was a trend for higher CD25
+
FOXP3
+
cell number in
neonates with maternal asthma, CD25
+
cell suppressive
capacity was similarly reduced in neonates with and with-
out maternal asthma. Further follow-up of these urban
neonates is important to determine whether reduced sup-
pressive capacity of Treg cells at birth predicts or predis-
poses them to asthma and other atopic diseases.
Conclusion
In conclusion, U.S. urban newborns have Treg cells that
express FOXP3, albeit with an immature phenotype and
function as compared to the mothers. Longitudinal fol-
low-up is needed to delineate Treg cell maturation and
subsequent risk for atopic diseases in this urban birth
cohort.
Abbreviations
Treg: T regulatory cell; MNCs: mononuclear cells; CB: cord
blood; PB: peripheral blood; PHA: phytohemagluttinin;
cpm: count per minute; PI: proliferation index; SI: sup-
pressive index; mAbs: monoclonal antibodies; FOXP3:
foxhead/winged helix transcription factor; URECA: Urban
Environment and Childhood Asthma; CPAP: continuous
positive airway pressure.
Competing interests
The authors declare that they have no competing interests.
Authors' contributions
NPL conducted the data analysis and wrote the manu-
script. BRP performed the proliferation studies and partic-
ipated in data analysis. RMM, CMV, and AOT assisted and
participated in data analysis. PKW supervised the flow
cytometry studies and participated in data analysis. WWC
and DRG participated in study design and supervised the
data analysis. GTO supervised patient recruitment for the
study and obtained funding. JEG participated in study
design, data analysis, and obtained funding. All of the
authors participated in drafting the manuscript and
approved its final version.
Table 4: Lymphocyte proliferation in cord blood and maternal peripheral blood with and without CD25
+
depletion
Proliferation Index (PI)*
CD25+ Undepleted CD25+ Depleted
N Median Range Median Range Wilcoxon
p-value
Cord blood 78 101.8 5.7–776.7 109.9 5.4–943.6 0.56
Maternal Peripheral blood 52 216.7 1.0–713.8 238.3 0.7–798.0 0.02
* Proliferation index (PI) is calculated as ratio of mean counts per minute (cpm) of stimulated over mean cpm of unstimulated cell triplicates.
Clinical and Molecular Allergy 2009, 7:8 />Page 9 of 10
(page number not for citation purposes)
Acknowledgements
This project has been funded in whole or in part with Federal funds from
the National Institute of Allergy and Infectious Diseases, National Institutes
of Health, under Contracts number NO1-AI-25496 and NO1-AI-25482,
and from the National Center for Research Resources, National Institutes
of Health, under grant M01 RR00533.
The Urban Environment and Childhood Asthma Study is a collaboration of
the following institutions and investigators (principal investigators are indi-
cated by an asterisk; protocol chair is indicated by double asterisks):
Johns Hopkins University, Baltimore, MD- R Wood*, F Witter, J Logan, B
Adams; Boston University School of Medicine, Boston, MA – G O'Connor*, W
Cruikshank, M Sandel, A Lee-Parritz, C Jordan; Harvard Medical School, Bos-
ton, MA – D Gold, R Wright; Columbia University, New York, NY – M Kattan*,
J D'Agostino, A Chen; Mount Sinai School of Medicine, New York, NY – H
Sampson, W Shreffler; Washington University School of Medicine, St Louis, MO
– G Bloomberg*, M Grayson, E Tesson; Statistical and Clinical Coordinating
Center – Rho, Inc, Chapel Hill, NC – H Mitchell*, P Zook, C Visness, G David;
Scientific Coordination and Administrative Center -University of Wisconsin, Madi-
son, WI – W Busse*, J Gern**, WM Lee; National Institute of Allergy and Infec-
tious Diseases, Bethesda, MD – P Gergen, A Togias, E Smartt, K Thompson.
References
1. Suto A, Nakajima H, Kagami SI, Suzuki K, Saito Y, Iwamoto I: Role of
CD4(+) CD25(+) regulatory T cells in T helper 2 cell-medi-
ated allergic inflammation in the airways. Am J Respir Crit Care
Med 2001, 164:680-687.
2. Zuany-Amorim C, Sawicka E, Manlius C, Le Moine A, Brunet LR,
Kemeny DM, Bowen G, Rook G, Walker C: Suppression of airway
eosinophilia by killed Mycobacterium vaccae-induced aller-
gen-specific regulatory T-cells. Nat Med 2002, 8:625-629.
3. Strickland DH, Stumbles PA, Zosky GR, Subrata LS, Thomas JA,
Turner DJ, Sly PD, Holt PG: Reversal of airway hyperresponsive-
ness by induction of airway mucosal CD4+CD25+ regulatory
T cells. J Exp Med 2006, 203:2649-2660.
4. Kearley J, Barker JE, Robinson DS, Lloyd CM: Resolution of airway
inflammation and hyperreactivity after in vivo transfer of
CD4+CD25+ regulatory T cells is interleukin 10 dependent.
J Exp Med 2005, 202:1539-1547.
5. Maggi L, Santarlasci V, Liotta F, Frosali F, Angeli R, Cosmi L, Maggi E,
Romagnani S, Annunziato F: Demonstration of circulating aller-
gen-specific CD4+CD25highFoxp3+ T-regulatory cells in
both nonatopic and atopic individuals. J Allergy Clin Immunol
2007, 120:429-436.
6. Bellinghausen I, Klostermann B, Knop J, Saloga J: Human
CD4+CD25+ T cells derived from the majority of atopic
donors are able to suppress TH1 and TH2 cytokine produc-
tion. J Allergy Clin Immunol 2003, 111:862-868.
7. Ling EM, Smith T, Nguyen XD, Pridgeon C, Dallman M, Arbery J, Carr
VA, Robinson DS: Relation of CD4+CD25+ regulatory T-cell
suppression of allergen-driven T-cell activation to atopic sta-
tus and expression of allergic disease. Lancet 2004,
363:608-615.
8. Grindebacke H, Wing K, Andersson AC, Suri-Payer E, Rak S, Rudin
A: Defective suppression of Th2 cytokines by CD4CD25 reg-
ulatory T cells in birch allergics during birch pollen season.
Clin Exp Allergy 2004, 34:1364-1372.
9. Hartl D, Koller B, Mehlhorn AT, Reinhardt D, Nicolai T, Schendel DJ,
Griese M, Krauss-Etschmann S: Quantitative and functional
impairment of pulmonary CD4+CD25hi regulatory T cells in
pediatric asthma. J Allergy Clin Immunol 2007, 119:
1258-1266.
10. Sherman CB, Tosteson TD, Tager IB, Speizer FE, Weiss ST: Early
childhood predictors of asthma. American Journal of Epidemiology
1990, 132:83-95.
11. Yunginger JW, Reed CE, O'Connell EJ, Melton LJ 3rd, O'Fallon WM,
Silverstein MD: A community-based study of the epidemiology
of asthma. Incidence rates, 1964–1983. Am Rev Respir Dis 1992,
146:888-894.
12. Haddeland U, Karstensen AB, Farkas L, Bo KO, Pirhonen J, Karlsson
M, Kvavik W, Brandtzaeg P, Nakstad B: Putative regulatory T cells
are impaired in cord blood from neonates with hereditary
allergy risk. Pediatr Allergy Immunol 2005, 16:104-112.
13. Schaub B, Liu J, Hoppler S, Haug S, Sattler C, Lluis A, Illi S, von Mutius
E: Impairment of T-regulatory cells in cord blood of atopic
mothers. J Allergy Clin Immunol 2008, 121:1491-1499.
14. Litonjua AA, Carey VJ, Burge HA, Weiss ST, Gold DR: Parental his-
tory and the risk for childhood asthma. Does mother confer
more risk than father? Am J Respir Crit Care Med 1998,
158:176-181.
15. Cullinan P, MacNeill SJ, Harris JM, Moffat S, White C, Mills P, Newman
Taylor AJ: Early allergen exposure, skin prick responses, and
atopic wheeze at age 5 in English children: a cohort study.
Thorax 2004, 59:855-861.
16. Martinez FD, Wright AL, Taussig LM, Holberg CJ, Halonen M, Morgan
WJ: Asthma and wheezing in the first six years of life. N Engl
J Med 1995, 332:133-138.
17. Polk S, Sunyer J, Munoz-Ortiz L, Barnes M, Torrent M, Figueroa C,
Harris J, Vall O, Anto JM, Cullinan P: A prospective study of Fel
d1 and Der p1 exposure in infancy and childhood wheezing.
Am J Respir Crit Care Med 2004, 170:273-278.
18. Kuiper S, Muris JW, Dompeling E, Kester AD, Wesseling G, Knot-
tnerus JA, van Schayck CP: Interactive effect of family history
and environmental factors on respiratory tract-related mor-
bidity in infancy. J Allergy Clin Immunol 2007, 120:388-395.
19. Weiss KB, Gergen PJ, Crain EF: Inner-city asthma. The epidemi-
ology of an emerging US public health concern. Chest 1992,
101:362S-367S.
20. Gottlieb DJ, Beiser AS, O'Connor GT: Poverty, race, and medi-
cation use are correlates of asthma hospitalization rates. A
small area analysis in Boston. Chest 1995, 108:28-35.
21. Busse WW, Mitchell H: Addressing issues of asthma in inner-
city children. J Allergy Clin Immunol 2007, 119:43-49.
22. Shreffler WG, Visness CM, Burger M, Cruikshank WW, Lederman
HM, de la Morena M, Grindle K, Calatroni A, Sampson HA, Gern JE:
Standardization and performance evaluation of mononu-
clear cell cytokine secretion assays in a multicenter study.
BMC Immunol 2006, 7:29.
23. Levings MK, Sangregorio R, Roncarolo MG: Human cd25(+)cd4(+)
t regulatory cells suppress naive and memory T cell prolifer-
ation and can be expanded in vitro without loss of function.
J Exp Med 2001, 193:1295-1302.
24. Jiang H, Chess L: An integrated view of suppressor T cell sub-
sets in immunoregulation. J Clin Invest 2004, 114:1198-1208.
25. Taams LS, Vukmanovic-Stejic M, Smith J, Dunne PJ, Fletcher JM, Plun-
kett FJ, Ebeling SB, Lombardi G, Rustin MH, Bijlsma JW, et al.: Anti-
gen-specific T cell suppression by human CD4+CD25+
regulatory T cells. Eur J Immunol 2002, 32:1621-1630.
26. Baecher-Allan C, Brown JA, Freeman GJ, Hafler DA:
CD4+CD25high regulatory cells in human peripheral blood.
J Immunol 2001, 167:1245-1253.
27. R: A language and environment for statistical computing
[
]
28. Chen W, Jin W, Hardegen N, Lei KJ, Li L, Marinos N, McGrady G,
Wahl SM: Conversion of peripheral CD4+CD25- naive T cells
to CD4+CD25+ regulatory T cells by TGF-beta induction of
transcription factor Foxp3. J Exp Med 2003, 198:1875-1886.
29. Khattri R, Cox T, Yasayko SA, Ramsdell F: An essential role for
Scurfin in CD4+CD25+ T regulatory cells. Nat Immunol 2003,
4:337-342.
30. Sakaguchi S: Naturally arising CD4+ regulatory t cells for
immunologic self-tolerance and negative control of immune
responses. Annu Rev Immunol 2004, 22:531-562.
31. Fontenot JD, Rasmussen JP, Williams LM, Dooley JL, Farr AG, Ruden-
sky AY: Regulatory T cell lineage specification by the fork-
head transcription factor foxp3. Immunity 2005, 22:329-341.
32. Takahata Y, Nomura A, Takada H, Ohga S, Furuno K, Hikino S,
Nakayama H, Sakaguchi S, Hara T: CD25+CD4+ T cells in human
cord blood: an immunoregulatory subset with naive pheno-
type and specific expression of forkhead box p3 (Foxp3)
gene. Exp Hematol 2004, 32:622-629.
33. Wing K, Ekmark A, Karlsson H, Rudin A, Suri-Payer E: Characteri-
zation of human CD25+ CD4+ T cells in thymus, cord and
adult blood. Immunology 2002, 106:190-199.
34. Wing K, Larsson P, Sandstrom K, Lundin SB, Suri-Payer E, Rudin A:
CD4+ CD25+ FOXP3+ regulatory T cells from human thy-
Publish with BioMed Central and every
scientist can read your work free of charge
"BioMed Central will be the most significant development for
disseminating the results of biomedical research in our lifetime."
Sir Paul Nurse, Cancer Research UK
Your research papers will be:
available free of charge to the entire biomedical community
peer reviewed and published immediately upon acceptance
cited in PubMed and archived on PubMed Central
yours — you keep the copyright
Submit your manuscript here:
/>BioMedcentral
Clinical and Molecular Allergy 2009, 7:8 />Page 10 of 10
(page number not for citation purposes)
mus and cord blood suppress antigen-specific T cell
responses. Immunology 2005, 115:516-525.
35. Seddiki N, Santner-Nanan B, Tangye SG, Alexander SI, Solomon M,
Lee S, Nanan R, Fazekas de Saint Groth B: Persistence of naive
CD45RA+ regulatory T cells in adult life. Blood 2006,
107:2830-2838.
36. Schaub B, Liu J, Schleich I, Hoppler S, Sattler C, von Mutius E: Impair-
ment of T helper and T regulatory cell responses at birth.
Allergy 2008, 63:1438-1447.
37. Allan SE, Crome SQ, Crellin NK, Passerini L, Steiner TS, Bacchetta R,
Roncarolo MG, Levings MK: Activation-induced FOXP3 in
human T effector cells does not suppress proliferation or
cytokine production. Int Immunol 2007, 19:345-354.
38. Gavin MA, Torgerson TR, Houston E, DeRoos P, Ho WY, Stray-Ped-
ersen A, Ocheltree EL, Greenberg PD, Ochs HD, Rudensky AY: Sin-
gle-cell analysis of normal and FOXP3-mutant human T
cells: FOXP3 expression without regulatory T cell develop-
ment. Proc Natl Acad Sci USA 2006, 103:6659-6664.