mcsa mcse windows xp professional study guide 2nd phần 9 ppsx
Bạn đang xem bản rút gọn của tài liệu. Xem và tải ngay bản đầy đủ của tài liệu tại đây (3.69 MB, 74 trang )
Managing System Performance
567
In Exercise 13.3, you will monitor your computer’s processor. This exercise assumes that you
have completed the other exercises in this chapter.
Monitoring and Optimizing the Disk Subsystem
Disk access is the amount of time your disk subsystem takes to retrieve data that is requested
by the operating system. The two factors that determine how quickly your disk subsystem will
respond to system requests are the average disk access time on your hard drive and the speed of
your disk controller.
Key Counters to Track for the Disk Subsystem
You can monitor the PhysicalDisk object, which is the sum of all logical drives on a single
physical drive, or you can monitor the LogicalDisk object, which represents a specific logical
disk. Following are the most important counters for monitoring the disk subsystem. These
counters can be tracked for both the PhysicalDisk object and the LogicalDisk object.
EXERCISE 13.3
Monitoring the System Processor
1. If System Monitor is not already open, select Start All Programs Administrative Tools
Monitor.
2. In the System Monitor window, click the Add button on the toolbar.
3. In the Add Counters dialog box, specify the following performance objects and counters:
Select Processor from the performance object drop-down list, select %Processor Time
in the counter list box, and click the Add button.
Select Processor from the performance object drop-down list, select Interrupts/Sec in
the counter list box, and click the Add button.
4. Click the Close button. You should see these counters added to your chart.
5. To generate some activity, select Start Control Panel Appearance and Themes
Display. Click the Screen Saver tab. Select 3D FlowerBox and click the Preview button. Let
this process run for about 5 seconds, and close all of the dialog boxes you opened in this
step. You should see that the %Processor Time counter spiked during this process.
6. Note the Processor > %Processor Time counter. If this counter’s average is below 85%, you
do not have a processor bottleneck.
7. Note the Processor > Interrupts/Sec counter. If this counter is below 1,000 on a Pentium
computer, you do not have any processes or hardware that are generating excessive
interrupts.
Leave System Monitor open, for use again in Exercise 13.4.
Simpo PDF Merge and Split Unregistered Version -
Copyright ©2003 SYBEX Inc., 1151 Marina Village Parkway, Alameda, CA 94501.
COPYING PROHIBITED
www.sybex.com
568
Chapter 13
Optimizing Windows XP
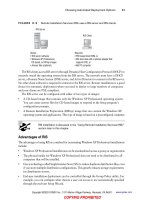
PhysicalDisk > %Disk Time Shows the amount of time the physical disk is busy because it is
servicing read or write requests. If the disk is busy more than 90% of the time, you will improve
performance by adding another disk channel and splitting the disk I/O requests between the
channels.
PhysicalDisk > %Current Disk Queue Length Indicates the number of outstanding disk requests
that are waiting to be processed. This value should be less than 2.
Tuning and Upgrading the Disk Subsystem
When you suspect that you have a disk subsystem bottleneck, the first thing you should check
is your memory subsystem. Insufficient physical memory can cause excessive paging, which
in turn affects the disk subsystem. If you do not have a memory problem, you can try the
following solutions to improve disk performance:
Use faster disks and controllers.
Confirm that you have the latest drivers for your disk host adapters.
Use Disk Manager to use disk striping to take advantage of multiple I/O channels.
Balance heavily used files on multiple I/O channels.
Add another disk controller for load balancing.
Use Disk Defragmenter to consolidate files so that disk space and data access are optimized.
If you are on a network, distribute applications that have high disk I/O through the
Distributed File System (DFS) to balance workload.
In Windows NT 4, you enabled all disk counters through the DISKPERF –Y
command. Physical and logical disk counters are automatically enabled in
Windows XP Professional.
In Exercise 13.4, you will monitor your disk subsystem. This exercise assumes that you have
completed the other exercises in this chapter.
EXERCISE 13.4
Monitoring the Disk Subsystem
1. If System Monitor is not already open, select Start All Programs Administrative Tools
Monitor.
2. In the System Monitor window, click the Add button on the toolbar.
3. In the Add Counters dialog box, specify the following performance objects and counters:
Select PhysicalDisk from the performance object drop-down list, select %Disk Time
from the counter list box, and click the Add button.
Select PhysicalDisk from the performance object drop-down list, select Current Disk
Queue Length from the counter list box, and click the Add button.
Simpo PDF Merge and Split Unregistered Version -
Copyright ©2003 SYBEX Inc., 1151 Marina Village Parkway, Alameda, CA 94501.
COPYING PROHIBITED
www.sybex.com
Managing System Performance
569
You can monitor the amount of free disk space on your logical disk through the
LogicalDisk > %Free Space counter. This counter can also be used as an alert.
For example, you might set an alert to notify you when LogicalDisk > %Free
Space on drive C: is under 10%.
Monitoring and Optimizing the Network Subsystem
Windows XP Professional does not have a built-in mechanism for monitoring the entire
network. However, you can monitor and optimize the traffic that is generated on the specific
Windows XP computer. You can monitor the network interface (your network card), and
you can monitor the network protocols that have been installed on your computer.
Network bottlenecks are indicated when network traffic exceeds the capacity that can be
supported by the Local Area Network (LAN). Typically, you would monitor this activity on
a network-wide basis—for example, with the Network Monitor utility that is shipped with
Windows Server 2003.
Key Counters to Track for the Network Subsystem
If you are using the System Monitor utility to monitor local network traffic, the following two
counters are useful for monitoring the network subsystem:
Network Interface > Bytes Total/Sec Measures the total number of bytes sent or received
from the network interface and includes all network protocols.
TCP > Segments/Sec Measures the number of bytes sent or received from the network interface
and includes only the TCP protocol.
Select LogicalDisk from the performance object drop-down list, select %Idle Time from
the counter list box, and click the Add button.
4. Click the Close button. You should see these counters added to your chart.
5. To generate some activity, open and close some applications and copy some files between
the C: drive and D: drive.
6. Note the PhysicalDisk > %Disk Time counter. If this counter’s average is below 90%, you
are not generating excessive requests to this disk.
7. Note the PhysicalDisk > %Current Disk Queue Length counter. If this counter’s average is
below 2, you are not generating excessive requests to this disk.
Leave System Monitor open; you will use this utility again in Exercise 13.5.
EXERCISE 13.4 (continued)
Simpo PDF Merge and Split Unregistered Version -
Copyright ©2003 SYBEX Inc., 1151 Marina Village Parkway, Alameda, CA 94501.
COPYING PROHIBITED
www.sybex.com
570
Chapter 13
Optimizing Windows XP
Normally, you monitor and optimize the network subsystem from a network
perspective rather than from a single computer. For example, you can use a
network protocol analyzer to monitor all traffic on the network to determine
whether the network bandwidth is acceptable for your requirements and that
network bandwidth is saturated.
Tuning and Upgrading the Network Subsystem
The following suggestions can help to optimize and minimize network traffic:
Use only the network protocols you need. For example, use TCP/IP and don’t use
NWLink.
If you need to use multiple network protocols, place the most commonly used protocols
higher in the binding order.
Use network cards that take full advantage of your bus width—for example, 32-bit cards
instead of 16-bit cards.
Use faster network cards—for example, 100Mbps Ethernet instead of 10Mbps Ethernet.
In Exercise 13.5, you will monitor your network subsystem. This exercise assumes that you
have completed the other exercises in this chapter.
EXERCISE 13.5
Monitoring the Network Subsystem
1. If System Monitor is not already open, select Start All Programs Administrative Tools
Monitor.
2. In the System Monitor window, click the Add button on the toolbar.
3. In the Add Counters dialog box, specify the following performance objects and counters:
Select Network Interface from the performance object drop-down list, select Bytes
Total/Sec in the counter list box, and click the Add button.
Select TCP from the performance object drop-down list, select Segments/Sec from the
counter list box, and click the Add button.
4. Click the Close button. You should see these counters added to your chart.
5. To generate some activity, copy some files between your C: drive and D: drive.
6. Note the two counters Network Interface > Bytes Total/Sec and TCP > Segments/Sec.
These numbers are cumulative. Use them in your baselines to determine network
activity.
Leave your Monitor console open, for use again in Exercise 13.6.
Simpo PDF Merge and Split Unregistered Version -
Copyright ©2003 SYBEX Inc., 1151 Marina Village Parkway, Alameda, CA 94501.
COPYING PROHIBITED
www.sybex.com
Managing System Performance
571
Creating Baseline Reports
As explained earlier in this chapter, baselines show how your server is performing at a certain
time. By taking baselines at regular intervals and also whenever you make changes to the
system’s configuration, you can monitor your server’s performance over time.
You can create baselines by setting up a counter log file in the Performance Logs and Alerts
utility. After you’ve created the baseline log file, you can view it in System Monitor, as shown
in Figure 13.17.
FIGURE 13.17 Viewing a performance baseline in System Monitor
In Exercise 13.6, you will create a baseline report for your computer.
EXERCISE 13.6
Creating a Baseline Report
1. If the Monitor console is not already open, select Start All Programs Administrative
Tools Monitor.
2. Double-click Performance Logs and Alerts.
3. Right-click Counter Logs and select New Log Settings.
4. In the New Log Settings dialog box, type Countermmddyy (replace mmddyy with the current
month, date, and year) as the log name. The log file will be stored in the C:\PerfLogs
folder by default. Click the OK button.
Simpo PDF Merge and Split Unregistered Version -
Copyright ©2003 SYBEX Inc., 1151 Marina Village Parkway, Alameda, CA 94501.
COPYING PROHIBITED
www.sybex.com
572
Chapter 13
Optimizing Windows XP
Using the System Tool in Control Panel
The System Tool in Control Panel can be used to manage performance options for your com-
puter. The performance-related options that can be configured through the System Tool include
how visual settings affect performance, processor scheduling, memory usage, and how the
paging file is configured.
To access these options, select Start Control Panel Performance and Maintenance
System. Select the Advanced tab, and then for Performance, click the Settings button. You will
see two tabs, Visual Effects and Advanced.
5. In the General tab of the counter log Properties dialog box, click the Add Counters button
and add the following counters:
Memory > Available MBytes
Memory > Pages/Sec
Paging File > %Usage
Processor > %Processor Time
Processor > Interrupts/Sec
PhysicalDisk > %Disk Time
PhysicalDisk > Current Disk Queue Length
Network Interface > Bytes Total/Sec
TCP > Segments/Sec
6. Click the Close button, and set the interval for sampling data to 5 seconds.
7. Click the Log Files tab. Uncheck the End File Names With check box. This will prevent the
appending of mmddhh (month/day/hour) to the filename. Click the OK button to close
the Properties dialog box and start the log file.
8. Generate some system activity: Start and stop some applications, copy a few files, and run
a screensaver for 1 or 2 minutes.
9. To view your log file, open System Monitor. Click the View Log Data button on the toolbar.
In the System Monitor dialog box that appears, select the Log Files radio button and
click the Add button.
10. In the Select File dialog box, select C:\PerfLogs\Countermmddyy and click the Open button.
11. Add the counters from the log file you created to see the data that was collected in your log.
EXERCISE 13.6 (continued)
Simpo PDF Merge and Split Unregistered Version -
Copyright ©2003 SYBEX Inc., 1151 Marina Village Parkway, Alameda, CA 94501.
COPYING PROHIBITED
www.sybex.com
Using the System Tool in Control Panel
573
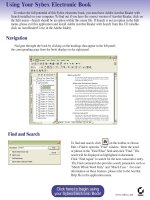
From the Visual Effects tab (see Figure 13.18), you can specify how performance is tuned
based on the visual effects you choose to use with your user interface. The selections for visual
effect settings include:
Let Windows choose what’s best for my computer
Adjust for best appearance
Adjust for best performance
Custom
FIGURE 13.18 The Visual Effects tab of the Performance Options dialog box
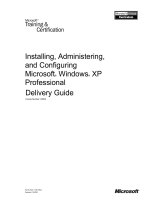
If you click the Advanced tab, you will see the dialog box shown in Figure 13.19. From the
Advanced tab, you can configure:
Processor scheduling, which allows you to optimize the processor time for running programs
or background services
Memory usage, which allows you to optimize memory for programs or system cache
Virtual memory, which is used to configure the paging file
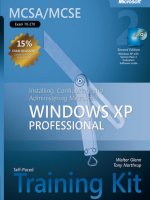
If you click on the Change button within the Virtual Memory section of the Advanced tab,
you can manage the page file, as shown in Figure 13.20.
When Windows is initially installed, the page file, pagefile.sys, is set to 1.5 times the
amount of physical memory. You can optimize the page file by moving it from the drive that
contains the system partition or by splitting the it over multiple disk I/O channels.
In order to make changes to the System Tool, you must be logged onto the
local computer with administrative rights.
Simpo PDF Merge and Split Unregistered Version -
Copyright ©2003 SYBEX Inc., 1151 Marina Village Parkway, Alameda, CA 94501.
COPYING PROHIBITED
www.sybex.com
574
Chapter 13
Optimizing Windows XP
FIGURE 13.19 The Advanced Tab of the System Tool
FIGURE 13.20 Virtual Memory dialog box
Simpo PDF Merge and Split Unregistered Version -
Copyright ©2003 SYBEX Inc., 1151 Marina Village Parkway, Alameda, CA 94501.
COPYING PROHIBITED
www.sybex.com
Using Task Manager
575
Using Task Manager
The Task Manager utility shows the applications and processes that are currently running on
your computer, as well as CPU and memory usage information. To access Task Manager, press
Ctrl+Alt+Delete and click the Task Manager button. Alternatively, right-click an empty area in
the Taskbar and select Task Manager from the pop-up menu.
The Task Manager dialog box has four main tabs, Applications, Processes, Performance, and
Networking. These options are covered in the following subsections.
Managing Application Tasks
The Applications tab of the Task Manager dialog box, shown in Figure 13.21, lists all of the
applications that are currently running on the computer. For each task, you will see the name
of the task and the current status (running, not responding, or stopped).
FIGURE 13.21 The Applications tab of the Task Manager dialog box
To close an application, select it and click the End Task button at the bottom of the dialog
box. To make the application window active, select it and click the Switch To button. If you
want to start an application that isn’t running, click the New Task button and specify the
location and name of the program you wish to start.
Managing Process Tasks
The Processes tab of the Task Manager dialog box, shown in Figure 13.22, lists all the processes
that are currently running on the computer. This is a convenient way to get a quick look at
Simpo PDF Merge and Split Unregistered Version -
Copyright ©2003 SYBEX Inc., 1151 Marina Village Parkway, Alameda, CA 94501.
COPYING PROHIBITED
www.sybex.com
576
Chapter 13
Optimizing Windows XP
how your system is performing. Unlike System Monitor, Task Manager doesn’t require that you
first configure the collection of this data; it’s gathered automatically.
FIGURE 13.22 The Processes tab of the Task Manager dialog box
For each process, you will see the image name (the name of the process), the user name (the
user account that is running the process), CPU (the amount of CPU utilization for the process),
and Mem Usage (the amount of memory that is being used by the process).
From the Processes tab, you can organize the listing and control processes as follows:
To organize the processes based on usage, click the column headings. For example, if you
click the CPU column, the listing will start with the processes that use the most CPU
resources. If you click the CPU column a second time, the listing will be reversed.
To manage a process, right-click it and choose an option from the pop-up menu. You
can choose to end the process, end the process tree, or set the priority of the process (to
realtime, high, abovenormal, normal, belownormal, or low). If your computer has multiple
processors installed, you can also set processor affinity (the process of associating a
specific process with a specific processor) for a process. See Chapter 4, “Configuring the
Windows XP Environment,” for details on setting processor affinity.
To customize the counters that are listed, select View Select Columns. This brings up the
Select Columns dialog box, shown in Figure 13.23, where you can select the information
that you want to see listed on the Processes tab.
Simpo PDF Merge and Split Unregistered Version -
Copyright ©2003 SYBEX Inc., 1151 Marina Village Parkway, Alameda, CA 94501.
COPYING PROHIBITED
www.sybex.com
Using Task Manager
577
FIGURE 13.23 Selecting information for the Task Manager’s Processes tab
In the following subsections you will learn how to stop processes and manage process priority.
Stopping Processes
You may need to stop a process that isn’t executing properly. To stop a specific process, select the
process you want to stop in the Task Manager’s Processes tab and click the End Process button.
Task Manager displays a Warning dialog box. Click the Yes button to terminate the process.
If you right-click a process, you can end the specific process or you can use the option End
Process Tree. The End Process Tree option ends all processes that have been created either
directly or indirectly by the process.
Some of the common processes that can be managed through Task Manager are listed in
Table 13.2.
TABLE 13.2 Common Processes
Process Description
System Idle
Process
A process that runs when the processor is not executing any other
threads
smss.exe Session Manager subsystem
csrss.exe Client-server runtime server service
mmc.exe Microsoft Management Console program (used to track resources used
by MMC snap-ins such as System Monitor)
Simpo PDF Merge and Split Unregistered Version -
Copyright ©2003 SYBEX Inc., 1151 Marina Village Parkway, Alameda, CA 94501.
COPYING PROHIBITED
www.sybex.com
578
Chapter 13
Optimizing Windows XP
Managing Process Priority
You can manage process priority through the Task Manager utility or through the start
command-line utility. To change the priority of a process that is already running, use the
Processes tab of Task Manager. Right-click the process you want to manage and select Set
Priority from the pop-up menu. You can select from Realtime, High, Abovenormal, Normal,
Belownormal, and Low priorities.
To start applications and set their priority at the same time, use the start command. The
options that can be used with the start command are listed in Table 13.3.
Running a process-intensive application in the Realtime priority class can
significantly impact Windows XP Professional performance.
explorer.exe Windows Explorer interface
Ntvdm.exe MS-DOS and Windows 16-bit application support
TABLE 13.3 Options for the start Command-Line Utility
Option Description
/low Starts an application in the idle priority class.
/normal Starts an application in the Normal priority class.
/high Starts an application in the High priority class.
/realtime Starts an application in the Realtime priority class.
/abovenormal Starts an application in the Abovenormal priority class.
/belownormal Starts an application in the Belownormal priority class.
/min Starts the application in a minimized window.
/max Starts the application in a maximized window.
/separate Starts a Windows 16-bit application in a separate memory space. By
default Windows 16-bit applications run in a shared memory space,
NTVDM, or NT Virtual DOS Machine.
/shared Starts a DOS or Windows 16-bit application in a shared memory space.
TABLE 13.2 Common Processes (continued)
Process Description
Simpo PDF Merge and Split Unregistered Version -
Copyright ©2003 SYBEX Inc., 1151 Marina Village Parkway, Alameda, CA 94501.
COPYING PROHIBITED
www.sybex.com
Using Task Manager
579
In Exercise 13.7, you will set the priority for a process.
Managing Performance Tasks
The Performance tab of the Task Manager dialog box, shown in Figure 13.24, provides an
overview of your computer’s CPU and memory usage. This is similar to the information tracked
by System Monitor, and you don’t have to configure it first as you do with System Monitor.
FIGURE 13.24 The Performance tab of the Task Manager dialog box
EXERCISE 13.7
Setting a Process Priority
1. Right-click an empty space on your taskbar and select Task Manager from the pop-up menu.
2. In the Applications tab, click the New Task button.
3. In the Create a New Task dialog box, type CALC and click the OK button.
4. Click the Processes tab. Right-click calc.exe and select Set Priority, then Low. In the Task
Manager Warning dialog box, click the Yes button to continue.
5. Right-click calc.exe and select End Process. In the Task Manager Warning dialog box, click
the Yes button.
Simpo PDF Merge and Split Unregistered Version -
Copyright ©2003 SYBEX Inc., 1151 Marina Village Parkway, Alameda, CA 94501.
COPYING PROHIBITED
www.sybex.com
580
Chapter 13
Optimizing Windows XP
The Performance tab shows the following information:
CPU usage, in real time and in a history graph
Page file usage, in real time and in a history graph
Totals for handles, threads, and processes
Physical memory statistics
Commit charge memory statistics
Kernel memory statistics
Managing Networking Tasks
The Networking tab of the Task Manager dialog box, shown in Figure 13.25, provides an
overview of your networking usage. This is similar to the information tracked by System
Monitor, and you don’t have to configure it first as you do with System Monitor.
FIGURE 13.25 The Networking tab of the Task Manager dialog box
Scheduling Tasks
Windows XP Professional includes a Task Scheduler utility that allows you to schedule tasks
to occur at specified intervals. You can set any of your Windows programs to run automatically
at a specific time and at a set interval, such as daily, weekly, or monthly. For example, you
might schedule your Windows Backup program to run daily at 2:00
A.M.
Simpo PDF Merge and Split Unregistered Version -
Copyright ©2003 SYBEX Inc., 1151 Marina Village Parkway, Alameda, CA 94501.
COPYING PROHIBITED
www.sybex.com
Scheduling Tasks
581
In Exercise 13.8, we will create a new scheduled task.
EXERCISE 13.8
Creating a New Scheduled Task
1. Select Start Control Panel Performance and Maintenance, and select Scheduled Tasks.
2. In the Scheduled Tasks window, double-click the Add Scheduled Task icon.
3. When the first page of the Scheduled Task Wizard appears, click the Next button to continue.
4. The first Scheduled Task Wizard dialog box lists applications you can run. You can select an
application from the list or click the Browse button to locate any application or program
to which your computer has access. After you select an application, click the Next button.
5. The next wizard dialog box prompts you to select a name for the task and specify when it
will be performed. Make your selection and click the Next button.
Simpo PDF Merge and Split Unregistered Version -
Copyright ©2003 SYBEX Inc., 1151 Marina Village Parkway, Alameda, CA 94501.
COPYING PROHIBITED
www.sybex.com
582
Chapter 13
Optimizing Windows XP
6. Depending on the selection you made for the task’s schedule, you may see another dialog
box for setting the specific schedule. For example, if you chose to run the task weekly,
the next dialog box lets you select the start time for the task, choose to run the task every
x weeks, and pick the day of the week that the task should be run. Make your selection
and click the Next button.
7. Next, you are prompted to enter the username and the password that will be used to start
the task. After you enter this information, click the Next button.
8. The final dialog box shows your selections for the scheduled task. If this information is
correct, click the Finish button.
EXERCISE 13.8 (continued)
Simpo PDF Merge and Split Unregistered Version -
Copyright ©2003 SYBEX Inc., 1151 Marina Village Parkway, Alameda, CA 94501.
COPYING PROHIBITED
www.sybex.com
Scheduling Tasks
583
Managing Scheduled Task Properties
You can manage a scheduled task through its properties dialog box; Figure 13.26 shows the
properties for the Calculator job. To access this dialog box, open the Scheduled Tasks window
(Start Control Panel Performance and Maintenance, and then select Scheduled Tasks).
Right-click the task you wish to manage, and choose Properties from the pop-up menu.
FIGURE 13.26 The Task properties for the scheduled task
The scheduled task properties dialog box has three tabs, Task, Schedule, and Settings, with
options for managing how and when the task is run and who can manage it. These options are
described in the following sections.
Task Properties
Through the Task tab (see Figure 13.26), you can configure the following options:
The command-line program that is used to run the task
The folders containing related files that might be required to run the specified task (this
is the Start In information)
Any comments that you want to include for informational purposes
The username and password to be used to run the specified task (this is the Run As
information)
Whether the scheduled task is enabled
Simpo PDF Merge and Split Unregistered Version -
Copyright ©2003 SYBEX Inc., 1151 Marina Village Parkway, Alameda, CA 94501.
COPYING PROHIBITED
www.sybex.com
584
Chapter 13
Optimizing Windows XP
Schedule Properties
The Schedule tab, shown in Figure 13.27, shows the schedule configured for the task. You can
change any of these options to reschedule the task.
FIGURE 13.27 The Schedule properties for the scheduled task
Settings Properties
The Settings tab (Figure 13.28) offers several configuration settings for the scheduled task:
The options in the Scheduled Task Completed section allow you to delete the task if it will
not be run again and specify how long the task should be allowed to run before it is stopped.
The options in the Idle Time section are useful if the computer must be idle when the task
is run. You can specify how long the computer must be idle before the task begins and
whether the task should be stopped if the computer ceases to be idle.
The options in the Power Management section are applicable when the computer on which
the task runs may be battery powered. You can specify that the task should not start if the
computer is running from batteries and choose to stop the task if battery mode begins.
If you are using Task Scheduler and your jobs are not running properly, make
sure that the Task Scheduler service is running and is configured to start
automatically. You should also ensure that the user who is configured to run
the scheduled task has sufficient permissions to run the task.
Simpo PDF Merge and Split Unregistered Version -
Copyright ©2003 SYBEX Inc., 1151 Marina Village Parkway, Alameda, CA 94501.
COPYING PROHIBITED
www.sybex.com
Scheduling Tasks
585
FIGURE 13.28 The Settings tab of the scheduled task dialog box
Troubleshooting Scheduled Tasks
If you are trying to use Scheduled Tasks and the tasks are not properly being executed, one of
the following troubleshooting options may resolve the problem.
If a scheduled task does not run as expected, right-click the task and select Properties.
From the Task tab, verify that the Enabled check box is selected. From the Schedule tab,
verify the schedule that has been defined for the task to run.
If the scheduled task is a command-line utility, make sure that you have properly defined the
command-line utility, including any options that are required for the utility to run properly.
Verify that the user who is configured to run the scheduled task has the necessary
permissions to the task that will be run.
Within the Scheduled Tasks window, check the task status within the Status column. The
status types are defined as:
Blank, which indicates that the task is not running, or that it was run successfully
Running, which means that the task is currently being run
Missed, which specifies that one or more attempts to run the task were missed
Could not start, which indicates that the most recent attempt to start the task failed
Verify that the Scheduled Tasks service has been enabled on the computer if no tasks can
be run on the computer.
Simpo PDF Merge and Split Unregistered Version -
Copyright ©2003 SYBEX Inc., 1151 Marina Village Parkway, Alameda, CA 94501.
COPYING PROHIBITED
www.sybex.com
586
Chapter 13
Optimizing Windows XP
If no user is logged into the computer when the task is scheduled to be run, the
task will still run, but it will not be visible.
Summary
In this chapter, you learned about managing Windows XP Professional optimization and
reliability. We covered the following topics:
How to use the System Monitor utility and the Performance Logs and Alerts utility to track
and monitor your system’s performance
How to monitor and optimize memory, the processor, the disk subsystem, and the network
subsystem, and how to create a system baseline
How to use the Task Manager utility to view and manage running applications and
processes, and to get an overview of CPU and memory usage
How to access settings for optimizing application performance through the System icon in
Control Panel
How to automate tasks through the Task Scheduler utility
Exam Essentials
Be able to monitor and troubleshoot Windows XP Professional performance. Know which
utilities can be used to track Windows XP performance events and issues. Know how to track
and identify performance problems related to memory, the processor, the disk subsystem, and
the network subsystem. Be able to correct system bottlenecks when they are identified.
Know how to use the Task Scheduler to automate system tasks. Understand the purpose of
Task Scheduler. Be able to configure Task Scheduler and identify problems that would keep
it from running properly.
Key Terms
Before you take the exam, be certain you are familiar with the following terms:
alerts Performance Logs and Alerts
baseline System Monitor
bottleneck Task Manager
counters Task Scheduler
page file
Simpo PDF Merge and Split Unregistered Version -
Copyright ©2003 SYBEX Inc., 1151 Marina Village Parkway, Alameda, CA 94501.
COPYING PROHIBITED
www.sybex.com
Review Questions
587
Review Questions
1. You are the network administrator of a medium-sized company. Tim is a user in the Finance
department. He notices that his computer’s performance is slow at times. You decide to monitor
the computer’s performance through Performance Logs and Alerts. You monitor counters
related to memory, processor, the disk subsystem, and the network subsystem. For memory, you
are monitoring the Memory > Available Mbytes counter. When you analyze the data from Tim’s
computer, the value for the Memory > Available Mbytes counter averages 12MB over a typical
sampling period. Based on this data, what course of action should you take?
A.
Add RAM.
B. Increase the size of the page file.
C. Split the page file over two physical disk channels.
D. Take no action.
2. Your accounting department runs a processor-intensive application and you are trying to
determine whether their current computers need to have the processors upgraded. You load a test
computer with a configuration identical to the production computers’ and run a program that
simulates a typical user’s workload. You monitor the Processor > %Processor Time counter.
What average value for this counter would indicate a processor bottleneck?
A.
Over 5%
B. Over 50%
C. Over 60%
D. Over 85%
3. You are the network administrator for the XYZ Corporation. Users in the Sales department
have been complaining that the Sales application is slow to load. Using Performance Logs and
Alerts, you create a baseline report for one of the computers, monitoring memory, the processor,
the disk subsystem, and the network subsystem. You notice that the disk subsystem has a high
load of activity. What other subsystem should you monitor before you can know for sure
whether you have a disk subsystem bottleneck?
A.
Memory
B. Processor
C. Network
D. Application
Simpo PDF Merge and Split Unregistered Version -
Copyright ©2003 SYBEX Inc., 1151 Marina Village Parkway, Alameda, CA 94501.
COPYING PROHIBITED
www.sybex.com
588
Chapter 13
Optimizing Windows XP
4. You are the network administrator for a network that consists of Windows XP Professional
computers configured as a workgroup. One of your users, Curtis, recently installed Visio on his
computer for creating engineering diagrams. When Curtis runs this application, it takes between
5 and 10 seconds to load. He uses the Task Manager utility to try to determine if he has a
resource bottleneck. Which two of the following subsystems should he monitor through Task
Manager to help determine what the bottleneck is?
A.
Memory
B. Processor
C. Network
D. Disk
5. You are the network administrator for a large corporation. The accounting department requires
that a specific application, ABC.EXE, be run every day to create daily reports on accounting
activity. The application needs to be run at 6
P.M. on Monday through Friday. The Accounting
Manager has asked you to automate the process so that reports are generated on the specified
schedule without any user interaction. Which Windows XP utility allows you to configure
automated tasks?
A.
Scheduled Tasks
B. Automated Scheduler
C. Task Manager
D. Task Automater
6. You are the network administrator for a large company. The payroll manager has Windows XP
Professional installed on her desktop computer. The computer has the following configuration:
Dual Pentium III Processors
128MB of RAM
Two physical SCSI disks
Disk 0 has Partition C: and D
Disk 1 has Partition E:
192MB page file on C:
100Mbps Ethernet NIC
The payroll manager requires the use of a database application. She has come to you to report
that when the database application is running, the computer slows down very significantly, and
she is unable to run any other applications. You run System Monitor on her computer and
record the following information when the database application is running:
Sustained processor utilization is at 100% for both processors
There are a significant number of hard page faults
Simpo PDF Merge and Split Unregistered Version -
Copyright ©2003 SYBEX Inc., 1151 Marina Village Parkway, Alameda, CA 94501.
COPYING PROHIBITED
www.sybex.com
Review Questions
589
When you record the data for the computer when the database application is not running, you
record the following information:
Average processor utilization is at 30%
There are a significant number of hard page faults
The database application is critical to the finance manager’s job. In order to be able to better
manage her productivity, which of the two following actions will have the greatest impact on
optimizing her computer’s performance?
A.
Upgrade the processors in her computer.
B. Add memory to the computer.
C. Split the page file over D: and E:.
D. Increase the page file to 256MB.
7. You are the network administrator, responsible for managing the computers used by the
Engineering department. Each user has a dual processor computer. The engineers all run CAD,
Visio, and some other specialized engineering applications. You are testing how performance
can be improved for these computers and want to test what will happen if you use processor
affinity to associate specific applications with specific processors. Which of the following
options should you use to configure processor affinity?
A.
Through Control Panel, System
B. Task Manager
C. Performance Monitor
D. System Logs and Alerts
8. You are the network administrator for a large company. The payroll manager has Windows XP
Professional installed on her desktop computer. The computer has the following configuration:
Dual Pentium III Processors
128MB of RAM
Two physical SCSI disks 20GB each
Disk 0 has Partition C: (10GB, 8GB free, and the system partition) and D (10GB, 4GB free)
Disk 1 has Partition E: (20GB, 12GB free)
192MB page file on E:
100Mbps Ethernet NIC
Simpo PDF Merge and Split Unregistered Version -
Copyright ©2003 SYBEX Inc., 1151 Marina Village Parkway, Alameda, CA 94501.
COPYING PROHIBITED
www.sybex.com
590
Chapter 13
Optimizing Windows XP
The payroll manager uses a specialized payroll application. She reports that when she initially
starts her computer, everything works well, but after using the payroll application for two hours,
her computer starts to get slower and slower. After about two hours and 15 minutes, she gets
an error message stating that her system is low on virtual memory. You have ordered additional
memory for her computer, but it is out of stock. In the meantime you want to optimize her
computer as much as possible. What course of action should you take?
A.
Increase the size of the paging file to 256MB.
B. Move the paging file to the C: drive.
C. Edit the config.sys file so that buffers = 128.
D. In Control Panel, System, Advanced Options, configure memory for Allow Best
Performance for System Cache.
9. You are the Help Desk manager of a large corporation. You want to make some changes to
your computer and would like to create a baseline report that will be used to measure your
computer’s performance before and after each change is made to the computer’s configuration.
When you open System Monitor, which of the following counters are active by default?
A.
Memory > Pages/Sec
B. Processor > %Processor Time
C. Paging File > %Usage
D. None
10. You are the network administrator for a large company. One of the computers that you are
monitoring is a Pentium computer. You suspect that you have a bottleneck, possibly due to a
malfunctioning piece of hardware. When you monitor the computer through System Monitor,
one of the counters you track is Processor > Interrupts/Sec. Which of the following values would
first indicate that a piece of hardware is malfunctioning due to spurious interrupts?
A.
250
B. 500
C. 750
D. 1,000
11. You are the network administrator for a medium-sized company. One of your responsibilities is
to monitor performance for the computers in the accounting department. You create a baseline
report that tracks counters for memory, processor, the disk subsystem, and the network subsystem.
One of the counters you track through System Monitor is the PhysicalDisk > Current Disk
Queue Length counter. You might have a disk subsystem bottleneck when this counter is initially
over which of the following values?
A.
1
B. 2
C. 10
D. 12
Simpo PDF Merge and Split Unregistered Version -
Copyright ©2003 SYBEX Inc., 1151 Marina Village Parkway, Alameda, CA 94501.
COPYING PROHIBITED
www.sybex.com
Review Questions
591
12. You are the network administrator for the XYZ Corporation. Your accounting manager uses a
financial application that requires several hours a day to create reports that are required by
the accounting department. While the application is running, the accounting manager finds that
his computer is very slow when running other accounting applications. You have been asked to
configure his computer so that the other accounting applications that are being run are more
responsive. Which of the following configuration changes should you make?
A.
Configure the accounting applications to run at high priority.
B. Configure the accounting applications to run at realtime priority.
C. Configure the financial application to run at below normal priority.
D. Configure the financial application to run at above normal priority.
13. When you schedule a task to be run, which of the following task properties cannot be configured?
A.
The username and password of the user who will run the task
B. Power management, so that if the computer is a laptop and is running from the battery,
the task will not run
C. Whether the task will be run once or repeatedly
D. Whether another task will be run if specific conditions trigger the secondary task
14. You want to track system performance for a baseline over a period of two days. You want
the data to be collected every 5 minutes. What type of log would you create for this monitoring,
through Performance Logs and Alerts?
A.
Counter log
B. Trace log
C. Monitoring log
D. Baseline log
15. You are monitoring the Memory > Pages/Sec counter through System Monitor. Which of the
following statements reflects what is considered optimal performance for this counter?
A. This counter’s value should be around 4 to 5.
B. This counter’s value should be around 30 to 40.
C. This counter’s value should be around 40 to 50.
D. This counter’s value should be around 50 to 60.
Simpo PDF Merge and Split Unregistered Version -
Copyright ©2003 SYBEX Inc., 1151 Marina Village Parkway, Alameda, CA 94501.
COPYING PROHIBITED
www.sybex.com