Báo cáo y học: "A comprehensive platform for quality control of botanical drugs (PhytomicsQC): a case study of Huangqin Tang (HQT) and PHY906" potx
Bạn đang xem bản rút gọn của tài liệu. Xem và tải ngay bản đầy đủ của tài liệu tại đây (1.32 MB, 15 trang )
RESEARC H Open Access
A comprehensive platform for quality control of
botanical drugs (PhytomicsQC): a case study of
Huangqin Tang (HQT) and PHY906
Robert Tilton
1
, Anthony A Paiva
1
, Jing-Qu Guan
1
, Rajendra Marathe
1
, Zaoli Jiang
1
, Winfried van Eyndhoven
1
,
Jeffrey Bjoraker
1
, Zachary Prusoff
1
, Hailong Wang
1
, Shwu-Huey Liu
1
, Yung-Chi Cheng
2*
Abstract
Background: Establishing botanical extracts as globally-accepted polychemical medicines and a new paradigm for
disease treatment, requires the development of high-level quality control metrics. Based on comprehensive
chemical and biological fingerprints correlated with pharmacology, we propose a general approach called
PhytomicsQC to botanical quality control.
Methods: Incorporating the state-of-the-art analytical methodologies, PhytomicsQC was employed in this study
and included the use of liquid chromatography/mass spectrometry (LC/MS) for chemical cha racterization and
chemical fingerprinting, differential cellular gene expression for bioresponse fingerprinting and animal
pharmacology for in vivo validation. A statistical pattern comparison method, Phytomics Similarity Index (PSI), based
on intensities and intensity ratios, was used to determine the similarity of the chemical and bioresponse
fingerprints among different manufactured batches.
Results: Eighteen batch samples of Huangqin Tang (HQT) and its pharmaceutical grade version (PHY906) were
analyzed using the PhytomicsQC platform analysis. Comparative analysis of the batch samples with a clinically
tested standardized batch obtained values of PSI similarity between 0.67 and 0.99.
Conclusion: With rigorous quality control using analytically sensitive and comprehensive chemical and biological
fingerprinting, botanical formulations manufactured under sta ndardized manufacturing protocols can produce
highly consistent batches of products.
Background
Quality control for herbal extracts containing tens to
hundreds of characteristic phytochemicals pose a chal-
lenge for developing robust quality control metrics [1,2].
Variations in climatic conditions, geographic locations,
methods of harvest, processing and extraction contribute
to differences in the composition of the final product.
Quality of herbal formulations was mainly assessed by
highly skilled herbalists using sensory analyses including
smell, taste and texture. More recently, these organolep-
tic methods have been augmented by histological identi-
fication [3], plant genetics [4,5] and increasingly
sophisticated chemical analyses such as thin layer chro-
matography (TLC), gas chromatography (GC) [6], capil-
lary electrophoresis [7] and liquid chromatography (LC)
and detection methods such as UV/VIS absorption [8],
Raman spectroscopy [9], infrared absorption [10], eva-
porative light scattering and mass spectrometry (MS)
[11-14]. A typical certificate of analysis for an herbal
formulation contains organoleptic information, TLC
markers, specifications for water content, water and
alcohol soluble extractives, total and acid soluble ash
content, heavy metal analysis, microbial test, pesticide
analysis and marker compound analysis as illustrated in
a batch of PHY906 (Table 1). While these data are use-
ful and generally accepted for herbal dietary supple-
ments, they do not fully chara cterize the phytochemical
* Correspondence:
2
Department of Pharmacology, Yale University School Of Medicine, New
Haven, CT 06510, USA
Full list of author information is available at the end of the article
Tilton et al. Chinese Medicine 2010, 5:30
/>© 2010 Tilton et al; licensee BioMed Central L td. This is an Open Access article distributed under the terms of the Creative Commons
Attribution License ( which permits u nrestricted use, distribution, and reproduction in
any medium, provided the original work is properly cited.
composition or the biological response of the herbal
extract.
While the current standards for quality controls uti-
lizes absolute quantitation of a few specific chemical
marker compounds [14], there is increasing interest in
using complete fingerprint patterns to characterize more
completely the multi-chemical species [15]. However, no
single analytical chemical method has high enough sen-
sitivity and resolution to detect every potential phyto-
chemical class of molecules Thus, an o rthogonal
biological methodology would be a useful complemen-
tary QC metric requirement. A robust bioresponse fin-
gerprint incorporating living cells as the biological
‘detector’ and the resulting genomic differential display
profile [16,17] after exposure to the botanical extract
could provide a s ensitive and global biological metric
that may help validate batch-to-batch similarity and
establish quality standards.
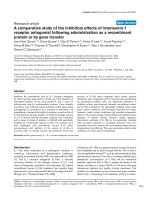
PhytomicsQC is a methodology combining chemical
analysis, bioresponse analysis and animal pharmacology
to determine batch-to-batch reproducibility (Figure 1).
Thus, it is a unified platform integrating: (1) informa-
tion-rich chemical and bioresponse fingerprints, (2)
molecular resolution details, (3) robust technologies (4)
quantitative data, and (5) statistical pattern comparisons.
For chemical analysis and fingerprinting, LC/MS was
chosen for i ts sensitivity, broad capability and spectral
sensitivity. Differential gene expression was selected for
bioresponse fingerprinting (PCT US99/24851) for its
comprehensive response, biological sensitivity and stan-
dardized methodology.
Huangqin Tang (HQT) is a classical Chinese medicine
formula for treating gastrointestinal ailments including
diarrhea, nausea and abdominal cramps [18]. PHY906 is
a modified pharmaceutical preparation of HQT (US
Patent No. 7,025,993). PHY906 reduc es gastrointestinal
toxicity and enhances the anti-tumor efficacy of some
anti-cancer drugs in animal models [19-21] and is cur-
rently under clinical investigations [22-24].
The present study aims to describe and exemplify the
PhytomicsQC approach to the quality control of herbal
formulae using the example of HQT and its pharmaceu-
tical derivative PHY906.
Methods
Herbal materials
A total of 18 batches of HQT were included in the pre-
sent study. Four batches coded as PHY906-6, 7, 8, 10
Table 1 Certificate of Analysis
Test item Specification Result
General description The product is a brown-colored powder possessing a little sweet taste Passed
Identification Identify Rf value and absorb spots of TLC to reference standards Passed
Loss on drying Not more than 10.0% Passed
Water-soluble extractive Not less than 60.0% Passed
Dilute alcohol-soluble extractive Not less than 60.0% Passed
Total ash Not more than 8.0% Passed
Acid-insoluble ash Not more than 2.0% Passed
Limit tests
Heavy metals (total) Not more than 50 ppm Passed
Copper (Cu) Not more than 50 ppm Passed
Arsenic (As) Not more than 5 ppm Passed
Cadmium (Cd) Not more than 2 ppm Passed
Mercury (Hg) Not more than 0.5 ppm Passed
Lead (Pb) Not more than 20 ppm Passed
Microbial tests
A. Bacteria count (colonies/g) A. Not more than 10000/g Passed
B. Samonella species and Escherichia. coli B. Negative Negative
Identification 1) Identify HLPC chromatogram retention time match to reference standards Passed
2) Marker 1 > 50.0 mg/g Passed
Marker 2 > 7.0 mg/g Passed
Marker 3 >5.3 mg/g Passed
Pesticide residues Total BHC’s: Not more than 0.2 ppm Not detected
Total DDT’s: Not more than 0.2 ppm Not detected
PCNB: Not more than 0.2 ppm Not detected
A typical Certificate of Analysis was supplied by the manufacturer of PHY9 06. Although these conventional tests provide specifications for botanical identification,
general extraction information, specific heavy metals, microbial contamination, pesticide contamination and specific marker compounds, it does not provide a
comprehensive chemical and biological profile of the extract for the purposes of quality control.
Tilton et al. Chinese Medicine 2010, 5:30
/>Page 2 of 15
were manufactured w ith PhytoCeutica’ sproprietary
SOP. Eight batches of HQT were purchased from Sun
Ten Pharmaceutical Co. LTD in Taiwan and designated
asHQT-E,F,G,H,I,J,KandL.SixbatchesofHQT
were obtained from various vendors (Chung Song Zong,
Ko Da, Min Tong, Sheng Chang, Sheng Foong, Kaiser;
Taiwan) who did not provide quality information, and
were labeled as HQT-CSZ, KD, MT, SC, SF and KP 3.
The proprietary standard operating procedures (SOP) by
PhytoCeutica for PHY906 used hot water extraction (80°
C) of four herbs, namely Scutellaria baicalensis Georgi
(S), PaeonialactifloraPall.(P), Glycyrrhiza uralensis
Fisch. (G) and Ziziphus jujuba Mill. (Z) (ratio 3:2:2:2).
Thehotwaterextractionisthenspraydriedwithinso-
luble dextran into a granulated powder, packaged and
stored in foil containers at 4°C.
Chemical standards including baicalin (S), baicalein
(S), wogonin (S), scutella rin (S), glycyrrhizin (G), ononin
(G), liquiritin (G), liqiritigenin (G), paeoniflorin (P) and
albiflorin (P), were obtained from Chromadex (USA).
Apigenin and formic acid were obtained from Sigma-
Aldrich (USA). Solvents were of LC/MS grade from JT
Baker (USA).
Extraction
Dried PHY906 or HQT powder (100 mg) was dissolved
in one mL of 80°C water. The mixture was vortexed for
one minute, placed in an 80°C water bath for 30 addi-
tional minutes with one minute of vortexing for every
ten minutes. The sample was then cooled in a water
bath of ambient temperature for five minutes, centri-
fuged for ten minutes at 10,000 rpm (Eppendorf Model
5810R, USA) and the resulting supernatant was filter
(0.2 μm) sterilized. For subsequent LC/MS analysis, a 20
μL aliquot of this light brown extract was diluted with
980 μL of water. The final nominal concentration after
extraction and dilution was 2 mg of dry weight PHY906
or HQT powder e xtract per mL of water. For biological
experiments, the 100 mg/mL nominal concentration
solution stock was diluted in the appropriate buffer or
medium to the required final concentration.
LC/MS methodology
High-performance liquid chromatography (HPLC) was
performed with a Waters (USA) CapLC XE Pump
equipped with a CapLC autosampler and a Waters
(USA) CapLC 2996 Photodiode Array Detector. The
Figure 1 PhytomicsQC. PhytomicsQC integrates technologies for chemical marker compound analysis and chemic al fingerpri nts,
comprehensive bioresponse fingerprints and in vivo animal pharmacology validation. Currently, it combines LC/MS analysis to provide a global
phytochemical fingerprint and a bioresponse differential gene expression profile to establish a multiplexed, quantitative metric for botanical
quality control. A relevant animal model is used to define and validate the quality control metric and to help set batch acceptance criteria.
Information-rich patterns are analyzed and compared with an established, well-characterized batch used for clinical studies. A statistical similarity
score based on the ratios of the various measured data values within the pattern and varying typically between 0.0 and 1.0 is used to define
pass/no-pass criteria for both the chemical and biological fingerprints.
Tilton et al. Chinese Medicine 2010, 5:30
/>Page 3 of 15
eluents were (A) 100% water with 0.1% formic acid and
(B) 100% acetonitrile with 0.1% formic acid and the col-
umn was a Waters Atlantis dC18 3 μm 0.3 mm × 150
mm NanoEase column (USA). The column was heated
to 40°C an d was preceded by a 0.5 μm precolumn frit.
Gradient elution from 0 to 50% B over 70 minutes at 8
μL/min was used with an initial hold of five minutes.
The column was then ramped to 95% B over four min-
utes, held in place for two minutes and returned to
initial conditions over two minutes. Total run time was
120 minutes. Electrospray ion ization was performed on
a Micromass (UK) Q-Tof-II mass spectrometer. Samples
(0.5 μL) were introduced without splitting into the elec-
trospray interface through a 60 μm stainless steel capil-
lary tube. A positive capillary voltage of 3.25 kV was
used in positive ion mode and a negative capillary vol-
tage of 3.25 kV was used in negative ion mode. The
electrospray source was heated to 80°C and the desol va-
tion gas (N
2
) was heated to 150°C at a flow rate of 400
L/hr. The Q-Tof was scanned from 50-2000 amu over
one second. The resolution of the instrument under
these conditions was ~10,000. For exact mass measure-
ments, a reserpine lock mass ([M+H] of 609 amu) was
introduced at the electrospray interface allowing mass
measurements to be within 0.0002 amu. With external
standards, mass accuracy to 0.002 amu was routine with
experimental and theoretical mass matching accuracy of
20 ppm or better.
Cell culture for gene expression studies
Three cell lines, namely Jurkat (ATCC no TIB-152), KB
(ATCC no CCL-17) and HepG2 (ATCC no HB-8065),
were selected for the experiments. HepG2 was selected
for three reasons: (1) the cell line is stable, robust and
well characterized; (2) the number of differentially
expressed genes in HepG2 is generally observed to be
higher than in the other two cell lines and (3) the liver
is considered the primary drug-metabolizing organ for
oral drugs. The HepG2 hepatocellular carcinoma cell
line was cloned and a cell-bank created. A strict set of
SOPs were developed to ensure reproducible growth
characteristics including passage number and c ell den-
sity. A HepG2 sub-clone cell was thawed with three
passages to 80% confluency in 10% FBS complete
MEME media at 37°C with 5% CO
2
.ComputedIC
50
values (conce ntration required to inhibit cell growth by
50%) were based on three independent experiments
comparing a 72-hour exposure of the cell s to eight con-
centrations ranging from 0.001 to 10 mg/mL of the
PHY906-6 extract with c ontrol untreated cells. Cells
were stained with 0.5% methylene blue, lysed with 1%
sarcosine and cell viability determined by UV/VIS
absorbance at A
595
.
GeneChip experiments
Three independent experiments were performed on the
HepG2 cells treated with one IC
50
dose of the herbal
extract or control buffer for 24 hours. At this time
point, 100% of the cells were still viable. RNA was col-
lected for gene profiling. GeneChip hybridization experi-
ments with Affymetrix Human genome chip U133A
(USA) were carried out at the Affymetrix Resource
Laboratory, Yale University School of Medicine, USA.
Data were processed with Microarray Suite 5.0 (Affyme-
trix, USA) software to generate a list of candidate genes
for further investigation.
Quantitative real-time polymerase chain reaction (qRT-
PCR) experiments
Selected gene probes were purchased as Assays-on-
Demand from Applied Biosystems (USA) to confirm
and quantify the candidate genes identified in the Gene-
Chip experiments.
Animal studies
PHY906-6,7,and8andHQT-Fwerecomparedfor
their effectiveness in potentiating the antitumor activity
of the cancer chemotherapy drug CPT-11 or Camptosar®
(Pfizer, USA). Female BDF-1 mice (Charles River
Laboratories, USA) of 4-6 weeks old (16-20 grams)
implanted with murine Colon 38 colorectal cancer cells
(National Cancer Institute, USA) were used in the
experiments. Colon 38 cells were grown in RPMI 1640
medium (JRH Biosciences, USA) supplemented with
10% fetal bovine serum and 100 μ g/ml kana mycin. Cells
were maintained at 37°C in a humidified atmosphere of
5% CO
2
:95% air. For studies of the effects of PHY906
on antitumor efficacy and toxicity, Colon 38 cells (1-2 ×
10
6
cells in 0.1 ml phosphate-bu ffered saline, PBS) were
transplanted subcutaneously (sc) into the BDF-1 mice.
The length and width of the tumors were measured
with a sliding caliper. The tumor size (S) was estimated
according to the formula as follows:
SLW/2
2
=×
where L is length, W is width.
After 10 to 14 days, mice with tumor sizes of 150-300
mm
3
were selected. Treatment groups consisted of five
mice each. Tumor size, body weight and mortality of
the mice were monitored daily. Mice were sacrificed
when the tumor size reached 10% of the body weight.
PHY906 was administered per oral (po) whereas
Camptosar® was administered intraperitoneally (ip).
PHY906 was given twi ce daily (bid) at approximately 10
am and 3 pm. On days when Camptosar® was also admi-
nistered, PHY906 was given 30 minutes earlier. Unless
Tilton et al. Chinese Medicine 2010, 5:30
/>Page 4 of 15
otherwise indicated, dosages were 500 mg/kg for
PHY906 and 360 mg/kg for Camptosar®. Mice in the
control groups were administered a vehicle of either
PBS (ip) or water (po). All animal studies were con-
ducted at the Yale University Animal Facility and
approved by the Institutional Animal Care and Use
Committee.
Pattern comparison by R value and Phytomics Similarity
Index (PSI)
The linear correlation R value is a standard statistical
method [25] used to compare two datasets and to com-
pare the absolute intensity or value of each of the col-
lected (N) data points. These data points can be either
ion current spectral intensities collected by LC/MS, UV-
VIS or relative gene expression level values determined
by qRT-PCR. The R value varies between -1.0 (perfect
anti-correlation) and 1.0 (perfect correlation) and is a
measure of the similarity of the two sets of intensities.
The Phytomics Similarity Index (PSI) is also a statistical
method that compares the fingerprint patterns by com-
puting a correlation value not of the intensities of the N
peaks but rather on the ratio data comput ed for each of
the N data points with each of the other (N-1) data
points. Using these (N-1) ratio values in the computa-
tion for each of the N data points provides the similarity
of that peak in relation to all of the other p eaks in the
fingerprint pattern (PCT US02/34121) The ratio infor-
mation is incorporated into the analysis as it provides
relative information between various peak intensities
reflecting the importance of the balance of the com-
pound amounts (or gene expression levels). As an exam-
ple, the integrated ion counts for each of the N peaks
(mass and retention time) are extracted from the overall
spectra of two different batches (A and B). These N ion
intensities, representing the chemical fingerprint of each
batch, are placed, conceptually, along the diag onal of a
matrix of dimension N × N and the ratios of the inten-
sities are p laced in the assigned M
i,j
(i ≠ jandi,j≤ N)
off-diagonal matrix locations. There are, therefore, a
total of N(N-1)/2 unique non-diagonal elements describ-
ing the full set of intensity ratio information between all
of the peaks with each peak contributing (n-1) ratios.
Matrices A and B were respective ly designated as M
A
and M
B
. Each column/row in M
A
and M
B
may be repre-
sented by the vectors as follows:
xMMMMMMMij
xMM
i
A
i
A
i
A
i
A
i
A
i
A
ij
A
iJ
A
i
B
i
B
i
=≠
=
(,,,,, , | )
(,
12345
1
22345
B
i
B
i
B
i
B
ij
B
iJ
B
MMM M M i j,,,, , | ) ≠
The linear correlation is then computed using all of
the columns or rows in both matrices.
R
nxx x x
nx x nx x
AB A B
AA BB
=
−
−
(
)
⎛
⎝
⎜
⎞
⎠
⎟
−
(
)
⎛
⎝
⎜
⎞
⎠
⎟
∑∑∑
∑∑ ∑∑
2
2
2
2
The correlation value R for each column i.e. peak,
can be obtained with the standard Pearson coefficient
or the Spearman ranked coefficient [25]. The result of
this analysis is a vector of R scores, where each vector
element corresponds to a data point (e.g. MS peak, or
gene) that is common to both datasets. While each
data point (i) has its own correlation sco re, R
i
,the
average of all of the individual R scores produces a
diagnostic single value for similarity defined as the PSI.
In this example, the PSI score would range between
0.0 (complete dissimilarity) to 1.0 (complete identity)
to -1.0 (perfect anti-correlation). The individual PSI
values can be weighted by a variety of factors including
intensity, slope or biological importance. A weighting
function found to be valuable is the individual peak
slope calculated from plotting (n-1) ratios for peak i
batch A to the equivalent (n-1) ratios for peak i in
batch B. Highly similar batches tend to have PSI values
greater than 0.85 with only a few outliers at lower PSI
values. Batches that have poor similarity tend to have
PSI values less than 0.75 with a greater number of
individual outliers at lower PSI values. The PSI algo-
rithm along with tools for filtering and sorting the LC/
MS data were implemented in the software package
PhytomicsQC™.
Results
PHY906 extraction
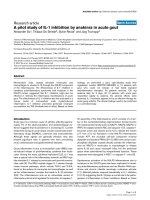
Multiple extractions of PHY906 exhibited similar LC/
MS profiles and indicated an extraction e fficiency of
85% with a composition greater than 80% low molecular
weight (<1000 amu) phytochemical species. (Figure 2)
The high extraction efficiency and the similarity of the
phytochemical profiles from multiple extractions sug-
gested that the soluble sample was an excellent repre-
sentation of the phytochemical components.
Phytochemical analysis
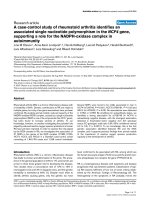
Comparison of LC/UV-VIS spectra and positive (+) and
negative (-) ion mode LC/MS spectra of PHY906 (Figure
3) indicated the presence of a similar pattern of peaks
with various intensity profiles. LC-MS (+) detected 39
distinct and quantifiab le peaks suitable for use in a che-
mical fingerprint. In contrast, LC-MS(-) revealed 32 of
the 39 peaks found in positive-ion mode and no addi-
tional new peaks whereas UV/VIS detection revealed
only 22 of the 39 peaks directly and no additional peaks.
Tilton et al. Chinese Medicine 2010, 5:30
/>Page 5 of 15
Sample stability
A freshly prepared extract of PHY906 was analyzed by
LC/MS (+) and indicated no significant changes over a
period of at least 18 hours (Figure 4). Sam ples stored at
-80°C were stable for a period of at least one month at a
concentration of 100 mg/mL.
Chemical fingerprints
A total of 64 LC/MS peaks were detectable in PHY906-
6 [26] under current LC/MS conditions. A diagnostic
chemical fingerprin t pattern of 39 of the LC/MS (+)
peaks was chosen for quality control. The peaks selected
for the chemical fingerprint all had peak intensities
greater than 0.2%, reproducible peak integration in three
independent spectra and linearity over a ten-fold con-
centration range. Ea ch of the 39 peaks identified in the
PHY906 LC/MS (+) spectrum was unique to an indivi-
dual herbal component; 25 from (S), 3 from (P), 10
from (G) and 1 from (Z) (Figure 5). These 39 peaks
represented 77% of the total ion count (TIC), summed
over the overall chromatogram from 0 to 65 minutes, at
athresholdof1%,82%oftheTICatathresholdof
1.5% and 87% of the TIC at a threshold of 2.0%. A list
of these 39 phytochemical peaks is in Additional file 1.
Marker standards
Quantitative analysis was performed for six markers
from (S), two markers from (G) and two markers from
Extraction 1
Extraction 2
Figure 2 LC/MS Chromatograms of Multiple Extractions of PHY906. Extraction efficiency of PHY906 spray-dried extract. PHY906-6 powd er
was extracted with 80°C water (100 mg/ml) for 30 minutes. The remaining solid after a high speed spin of 10,000 rpm was extracted a second
time with 80°C water for 30 minutes. LC/MS(+) spectra of each liquid extract indicate very similar peak patterns The efficiency for each extraction
was approximately 80% as determined by dilution factors to maintain the TIC at 1.7e4 (1:50 for the first extraction and 1:5 for the second
extraction) and by recovered masses.
Tilton et al. Chinese Medicine 2010, 5:30
/>Page 6 of 15
(P). No relevant marker from (Z) was av ailable although
one definitive marker peak is identified with mass
159.085 amu. Recovery studies reported a range between
96% and 105%. Standard curves for all markers were lin-
ear in the range 0.1 to 20 mg/ml with linear correlation
R-values greater than 0.99. The t en marker standards
accounted for approximately 20% of the total mass of
PHY906, 38% of the total mass of phytochemicals after
correction for excipient and residual water content and
58% of the total mass of phytochemicals excluding exci-
pient, residual water content and simple sugars (See
Additional file 1).
Compound identification
Ten of the 39 peaks were identified and confirmed with
external marker standards, high-resoluti on MS and MS/
MS fragmentation. An additional 13 of 39 peaks were
tentatively identified with high-resolution MS and/or
LC/UV-VIS
LC/MS(+)
LC/MS(-)
Figure 3 MS and UV/VIS Detection of PHY906. Three detection modes were employed to detect the spectrum of phytochemicals in PHY906
extracts. The top panel illustrates detection in the UV/VIS range using a photo diode array detector (200-400 nm). The middle panel illustrates
detection by MS(+) with a TIC of 1.5e4. The lower panel illustrates detection by MS(-) with a TIC of 2.5e3. UV/VIS detection was poor for many of
the saponins and triterpenoids associated with (G) and was unable to detect or resolve the marker for (Z) in the solvent front. Only 22 of the 39
peaks in the final chemical fingerprint were detected and no new peaks were observed. MS(+) detection was approximately eight fold more
sensitive than MS(-) by TIC resulting in increased S/N. 32 of the 39 chemical fingerprint peaks were observed in the MS(-) mode compared with
the MS(+) mode. No new peaks were observed in the MS(-) mode although the intensity profile was enhanced for a few species including
paeoniflorin sulfonate at 25.6 minutes.
Tilton et al. Chinese Medicine 2010, 5:30
/>Page 7 of 15
MS/MS. These 23 peaks comprised 78% of the ion cur-
rent intensity by all 39 peaks. The majority of these
identified compounds were flavonoids (60%), saponins
and triterpenoids.
Bioresponse analysis
Of the approximately 18,000 genes monitored, only 100-
300 genes were significantly regulated as indicated by an
over 1.5 fold change in the differential gene expre ssion
level in HepG2 cell culture in the presence of a one
IC
50
dose of an herbal extract over a period of 24 hours.
This list of genes was further filtered by reproducible
qRT-PCR and comparati ve gene function analysis to
form a unique signature set of 15-20 genes (Figure 6).
Gene expression
Gene respons e express ion data observed at an exposure
of one IC
50
concentration of eight herbs resulted in a
composite bioresponse gene set of 524 genes at a mini-
mum cut-off of 1.7 fold change in expression level
(Figure 7). Unique g ene expression patterns are evident
for each herb or herbal formulation. A biochemical
pathway analysis of these 524 genes suggested that over
50% of the genes were either in signalin g pathways or
involved in cellular metabolism. This gene-list repre-
sented an objective biological quality control metric for
an herbal extract.
In the specific case of PHY906-6, three independent
experiments revealed 1172, 1846 and 1158 regulated
genes in HepG2 cells, of which 466 genes were common
in all three experiments. Subsequent filtering of regu-
lated genes with changes of 1.5 fold, 2.0 or 3.0 folds
with respect to untreated control resulted in a surpris-
ingly small common gene set of 261, 77 or 28 genes
respectively. The set of 77 genes was filtered to a subset
of 17 genes, 15 of which were confirmed by qRT-PCR
analysis. Nearly all (14/15) of the altered genes were up-
regulated. The full expression range for these 15 genes
varied from 3-fold down-regulated to over-400-fold up-
regulated (Table 2). The subset of 15 genes formed a
100
41.07
45.55
%
59.30
0 Hours
-2
34.84
2.04
30.71
42.80
55.44
48.88
53.19
100
40.79
45 41
100
%
45
.
41
59 12
18 Hours
000
10 00
20 00
30 00
40 00
50 00
60 00
Time
-2
%
34.43
2.02
30.31
42.57
59
.
12
48.71
55.24
53.00
0
.
00
10
.
00
20
.
00
30
.
00
40
.
00
50
.
00
60
.
00
Figure 4 LC/MS Chromatograms of PHY906 Extract Stability. Sample stability. Sample and instrument stability were monitored by successive
LC/MS(+) profiles of a freshly prepared extract of PHY906-6. Two spectra taken at 0 hours and 18 hours indicate that LC peak positions and
peak integrations were stable, samples were visually unchanged with no observed precipitation and peak patterns and intensities did not vary
over at least an 18-hour period. The PSI value for the 39 peak pattern between the 0 and 18 hour time points was 0.98. Even minor degradation
of the liquid extract was not apparent for at least 24 hours at room temperature.
Tilton et al. Chinese Medicine 2010, 5:30
/>Page 8 of 15
Figure 5 LC/MS chromatogram of PHY906-6. LC/MS(+) spectrum of PHY906 extract and herbal source identification. Thirty-six peaks were
resolved and 64 compounds were identified or tentatively identified (23). Thirty-one peaks were found to contain a single molecular species
while 5 peaks contain multiple molecular species. 39 compound peaks defined the chemical fingerprint and were used for batch-to-batch
comparisons. Of the 39 peaks of the chemical fingerprint of PHY906 (S) accounted for 25 of 39 peaks, (P) accounted for 3 of 39 peaks, (G)
accounted for 10 of 39 peaks and (Z) accounted for only 1 of 39 peaks. All the identified peaks had a unique retention time and/or mass
signature and were associated with a single herbal ingredient. Water extracted (Z) was nearly devoid of resolved phytochemical peaks that could
be detected. The single identified peak for (Z) was very hydrophilic, had no UV chromophore, eluted in the solvent front of the C18 reverse
phase column and ionized only in (+) positive MS mode. The total ion count for the spectrum was 2.9e4. The complete chemical fingerprint of
39 peaks accounted for more than 82% of the total ions above a threshold of 1.5% of the largest peak.
Botanical A
Botanical A
RNA
Sl ti f
Gene Chip
(18,000 genes)
Bioinformatics
Clustering of
differentially expressed genes
S
e
l
ec
ti
on o
f
20 - 40 signature
set genes
Botanical
data base
Statistics
qRT-PCR assay
fQCf
Selection of 100-200
candidate genes
qRT-PCR
Reproducibility & stability
assessment
f
or
QC
o
f
botanicals
Based on:
• Statistical evaluation
assessment
•
Gene function
• Level of transcriptional regulation
Figure 6 Schematic for gene expression biorespo nse fingerprint. A Scheme of generating the bioresponse gene expression pattern for a
botanical extract. The bioresponse of a living cell, provides a unique biological fingerprint of complex actions by the full extract of the botanical
drug. The bioresponse can be one of many multifactorial responses, including differential gene expression, differential protein expression or
post-translational modifications such as phosphorylation. We illustrate the process using living cells as “detectors” and genomic expression levels
as the observed bioresponse. Well characterized gene chips (Affymetric UA133A) serve as the first filter to reduce the 18,000+ possible genes
down to the candidate gene expression pattern of 100-300 genes. This gene list is then compared against a botanical bioresponse database,
filtered and analyzed to produce unique sets of bioresponse genes. This list is further refined by statistical evaluation, gene function,
transcriptional level, relevance, etc. before validation with qRT-PCR. This iterative process generates a signature set of 15-30 genes that are stable,
quantitative, reproducible and unique to both the botanical formulation and manufacturing process.
Tilton et al. Chinese Medicine 2010, 5:30
/>Page 9 of 15
unique bioresponse signature of the PHY906 extract as a
quality control metric for quantitative batch-to-batch
comparisons.
Validation of the PSI method
The PSI method was tested and validated with artificial
data sets created within the boundary conditions of typi-
cal experimental data. Two identical datasets produced a
PSI value of 1.0. Random data sets provided low PSI
values in the range of 0.0 to 0.1. Data values greater
than ten provided a robust and stable score whereas five
or fewer data points did not provide reliable results. PSI
was accurate when the variations between the two
datasets were spread over a majority of the data values.
If only one of the data points was variable, both the PSI
average and the R-value correlation were high. However,
the data point was easily identified in the PSI histogram
plot as a low value outlier.
Batch-to-batch comparison-chemical fingerprints
The39peakchemicalfingerprintswereusedtocom-
pare 17 batches of PHY906 and generic forms of HQT
with a clinical standard batch PHY906-6. Mass spectra
of all batches revealed subtle (but distinct) quantitative
differences in the peak intensity pattern. With the
extracted intensities for each of the 39 chemical
AB C P Z GS
6 7 8
PHY906
DEF
HQT-F
Figure 7 Gene expression bioresponse profiles. Composite union gene expression of ten different herbal preparations. Ten different herbal
preparations including three forms of Ginseng (A) White, (B) Red, (C) American, (D) Cistanche tubulosa (Schenk) R. Wight, (E) sinensis sinensis, (F)
Ganoderma Lucidium, (S) Scutellaria baicalensis, (P) Georgi Paeonia lactiflora Pall., (Z) Ziziphus jujuba Mill. , (G) Glycyrrhiza uralensis Fisch., PHY906-6, 7,
8 and HQT-F were examined. Each preparation was used to treat HepG2 cell cultures for a period of 24 hours at the standard IC50 dose for the
herbal or formulation with gene expression levels measured using the Affymetric UA133A chip. Combining data from eleven different herbs or
herbal formulations generated a total of 524 genes in the union set that are regulated with greater than a 1.7 fold change compared with a
buffer-treated control. This color-coded gene expression map shows the unique expression patterns for these 524 genes observed for different
herbal preparations. While high similarity was observed for the three ginseng varieties, there were still subtle differences that distinguished th e
varieties. Similarly, although three clinical batches PHY906-6, 7 and 8 were nearly identical, there were subtle differences compared with the
bioresponse gene expression pattern of HQT-F.
Tilton et al. Chinese Medicine 2010, 5:30
/>Page 10 of 15
fingerprints, we computed the PSI and conventional cor-
relation values to compare similarity (Table 3). PSI
values ranged from 0.67 to 0.99 whereas the correlation
R values tightly clustered between 0.97 and 0.99. PSI
values of 0.99 confirmed that the 39 peak chemical fin-
gerprints of PHY906-6, 7 and 8 that were manufactured
as sequential batches using the same ingredient herbs
are nearly identical as chemical fingerprint patterns of
two sequential LC/MS data sets of the same sample
woul d have a PSI of 0.99. PHY906-10 was also found to
be highly similar (PSI 0.97) to PHY906-6 although it
was manufactured with herbs harvested six years later
(group I). Similarly, the seven batches of group II manu-
factured by the same vendor as group I were also highly
consistent with each other (PSI 0.95-0.98) but differed
from the clinical batch PHY906-6 (PSI 0.0.81-0.94). The
greatest variation, however, was between PHY906-6 and
the six batches in group III (PSI 0.67-0.96) sourced from
var ious vendors. Some batches such as HQT-SC, HQT-
KP3 and HQT-KD were very similar to PHY906-6 with
PSI scores greater than 0.90 while other batches such as
HQT-MT and HQT-SF were significantly different with
PSI scores less than 0.75. Without vendor information
for these samples, it was impossible to determine pro-
duct batch-to-batch reproducibility.
Comparison of PSI and R value
Although a very modest correlation (R
2
=0.81)existed
between PSI values and R values, the small range of R
values could not be used definitively to discriminate
between various batches of H QT. The PSI was
apparently more sensitive to variations in the intensity
pattern because each of the n peaks had (n-1) ratios
used in defining the correlation coefficient with the cor-
responding peak i n a separate batch while in the stan-
dard R value each peak intensity only contributed 1/n to
the overall correlation coefficient.
Batch-to-batch comparison-bioresponse fingerprints
Three clinica l batches PHY906-6, 7 and 8 and two non-
clinical batches HQT-E and F were selected for biore-
sponse fingerprint analysis as they were all manufac-
tured by a single vendor with batch HQT-E exhibiting
the highest chemical fingerprint similarity (PSI = 0.94)
and HQT-F the lowest chemical fingerprint similarity
(PSI = 0.81) compared with PHY906-6. Bioresponse PSI
values computed with qRT-PCR data of the 15 gene
expression pattern were 0.99 for PHY906-7, 0.98 for
PHY906-8, 0.94 for HQT-E and 0.68 for HQT-F com-
pared with PHY906-6 (Table 4). This complementary
bior esponse fingerprints confirmed the rank-order simi-
larity observed in the chemical fingerprints.
Batch-to-batch comparison
Based on chemical and bioresponse analysis, three
batches (PHY906-6, PHY906-10 and HQT-F) a ll pro-
duced by the same manufacturer, were used to investi-
gate the effects on the anti-tumor activity of Camptosar®
against murine colorectal cancer in mice (Figure 8).
There was a significant efficacy enhancement for Camp-
tosar® by batch PHY906-6 and batch PHY906-10 (P =
0.0001) but no significant enhancem ent by batch HQT-
Table 2 PHY906 gene expression bioresponse in HepG2 cell-line
Protein name Gene name Cellular function Fold change
Aldo-keto reductase family 1 member B10 AKR1B10 Metabolism 6.8
Carnitine palmitoyltransferase 1A CYP1A1 Metabolism 405
Epithelial membrane protein 2 EMP2 Cell growth regulation 3.2
Glucose-6-phosphatase catalytic subunit G6PC Metabolism 12.3
Glutamate-cystein ligase catalytic subunit GCLC Metabolism 3.4
Growth differentiation factor 15 GDF15 Cell growth/differentiation 2.2
Hepcidin antimicrobial peptide HAMP Homeostasis, metabolism 4.9
Insulin-like growth factor binding protein 3 IGFBP-3-2 Hormone, Immune response, 3.3
Palladin Palladin Cell growth regulation 2.6
Serine/threonine protein kinase PIM1 PIM1 Signalling transduction and cell proliferation, oncogene 3
Sterile alpha motifs- and SH3 domain-containing protein 1 SASH1 Cell growth regulation 2.8
SERTA domain SERTAD transcriptional regulator 2.2
Solute carrier family 7 member 11 SLC7A11 Membrane transport protein 3.2
Son of sevenless homolog 1 SOS 1 Signalling transduction and cell death regulation 9.4
Tubulin, alpha 3 TUBA3 Signalling transduction and cell death regulation -2.4
PHY906-6, at the IC
50
dose (0.85 g/ml dry weight), or control buffer was applied to a standardized cell culture of HepG2 cells for 24 hr. No cell death was
observed by methylene blue staining. Cells were harvested and RNA was isolated from both PHY906-6 treated and control treated cells. The RNA was
quantitated using qRT-PCR and standardized gene probes from App lied Biosystems Assays-On-Demand for the 15 genes in the gene signature. Fourteen of the
fifteen genes were up-regulated. The genes coded for proteins with a variety of cellular functions. No information regarding cellular mechanisms of action of
PHY906 could be inferred from these data, as the data indicated the cellular bioactivity of the entire extract rather than the bioavailable fraction. The qRT-PCR
data, however, were reproducible in an independent experiment within approximately 30%.
Tilton et al. Chinese Medicine 2010, 5:30
/>Page 11 of 15
F (P = 0.386) as determined by the paired t-test. These
in vivo results were consistent with the similarity rank-
ing in both in vitro chemical and bioresponse
fingerprints.
Discussion
The challenge of assessing the consistency of different
batches of a botanical extract is inherent in the phyto-
chemical complexity of botanical extracts. This chal-
lengeismademoreformidableduetothefactthattwo
batches of a botanical extract with the same chemical
spectrum may have different biological activities if the
bioactive chemical species is not detectable by the
specific chemical analysis methodologies. Similarly, two
batches of a botanical extract with different chemical
fingerprint compositions may exhibit the same biological
activity if the phytochemicals responsible for the differ-
ence are biologically inert. This challenge demands com-
prehensive quality control of polychemical botanical
extracts to include multiplexed and orthogonal methods
for both chemical and biological characterization.
While the traditional chemical analysis of standard
marker compounds provides a useful quantitativ e mass
balance, patterns of information-rich chemical finger-
prints provide a complementary, powerful and practical
approach to herbal quality control. Well suited for the
analysis of the p hytochemical-rich extract of PHY906,
LC-MS offers excellent sensitivity, molecular resolution
and good reproducibility in providing a comprehensive
chemical fingerprint pattern. Other information-rich
analytical chemical methods such as LC-NMR, UV-VIS
and FT-IR are also useful. However, while these meth-
ods are well suited for the characterization of low mole-
cular weight, phytochemical-rich botanical extracts,
these chemical analysis may not be well suited to fully
characterize the complex and heterogeneous protein/
carbohydrate profiles often associated with important
herbal or fungal extracts. A complementary biological
methodology is required.
Comprehensive biological methodologies such as a
quantifiable and global bioresponse fingerprinting are
more advantageous than a few specific single enzyme/
receptor assays. The advantages are due primarily to the
inherent multi-factorial biological activities of botanical
Table 3 PSI and R-values for the Chemical Fingerprints of
Seventeen Batches of PHY906 and HQT
Formulation PSI R
Group I
PHY906-6 1 1
PHY906-7 0.99 0.99
PHY906-8 0.99 0.99
PHY906-10 0.97 0.99
Group II
HQT-E 0.94 0.99
HQT-F 0.81 0.98
HQT-G 0.84 0.97
HQT-H 0.87 0.98
HQT-I 0.89 0.98
HQT-J 0.84 0.98
HQT-K 0.82 0.98
HQT-L 0.86 0.98
Group III
HQT-CSZ2 0.89 0.99
HQT-SF 0.67 0.97
HQT-SC 0.95 0.99
HQT-MT 0.74 0.98
HQT-KP3 0.93 0.99
HQT-KD 0.96 0.99
The chemical fingerprint intensity pattern of 39 peaks is used to compare the
similarity of seventeen independently manufactured batches of PHY906 or
HQT with the clinical batch PHY906-6. Group I consists of four clinical batches:
PHY906-6, 7, 8 and 10. Gro up II consists of eight batches manufactured for
sale as Huang Qin Tang by a single vendor: HQT-E, F, G, H, I, J, K and L. Group
III consists of six batches that are reported to be Huang Qin Tang and that are
manufactured by different vendors with unknown protocols, specifications or
quality control: HQT-CSZ, KD, MT, SC, SF and KP3. A PSI value of 1.0 indicates
identical patterns of the intensity ratio pattern of the chemical fingerprint
between the PHY906-6 and a second batch. A PSI value of 0.0 indicates no
similarity of the intensity ratio pattern between the two batches. Batches in
Group I are found to be highly similar to PHY906-6 including PHY906-10 that
is manufactured six years after batches PHY906-6, 7, 8 using different harvests
of the raw herbal starting products. Group II are relatively tightly clustered at
a lower PSI value, and while similar to each other are clearly distinguishable
from Group I. Group III are poorly clustered, highly variable and span the
largest PSI ran ge (0.67 - 0.95). While some batches are very similar to PHY906-
6, other batches are quite different. In the lower panel is a full matrix of PSI
values comparing PHY906-6, 7, 8, 10 and HQT-F. Intra-batch comparisons
indicate the high degree of similarity of the clinical batches (Group I) and the
lower degree of similarity of Group I batches with HQT-F.
Table 4 PSI of 15 Gene Expression Bioresponse
Fingerprint of PHY906 and HQT batches
PHY906-6 PHY906-7 PHY906-8 HQT-E HQT-F
PHY906-6 1 0.99 0.98 0.94 0.68
PHY906-7 1 0.97 0.92 0.71
PHY906-8 1 0.97 0.61
HQT-E 1 0.58
HQT-F 1
Five batches were selected from the total of 17 batches, based on chemical
fingerprint similarity. Three batches from Group I (PHY906-6, PHY906-7,
PHY906-8) that exhibit high similarity were chosen. Two bat ches, HQT-E and
HQT-F from Group II were selected that were manufactured by the same
vendor. HQT-E exhibited the highest similarity and HQT-F exhibited the lowest
chemical fingerprint similarity to PHY906-6. Differential gene expression values
for the 15 gene bioresponse fingerprint were measured by qRT-PCR using
Assay-on-Demand from Applied Biosystems, standardized HepG2 cells and a
one IC50 dose level of the PHY906 or the HQT batch. PSI values are based on
the Pearson correlation between the ratio matrices of the 15 differential gene
expression changes and vary between 0.0 (no similarity) and 1.0 (complete
identity). The gene expression values ranged between -2.4 and 405 and are
shown in supplemental table 3 for PHY906-6. Duplicate experiments with
either PHY906-6 or HQT-F results in PSI values of 0.97 indicating a high level
of reproducibility. Comparison of PSI values using this 15 gene fingerprint
indicate high similarity (0.92-0.99) between batches PHY906-6, PHY906-7,
PHY906-8 and HQT-E, but significant ly lower similarity (0.58-0.70) with batch
HQT-F.
Tilton et al. Chinese Medicine 2010, 5:30
/>Page 12 of 15
extracts. Even in the absence of a complete understand-
ing of the exact bioactive chemical species and the
underlying mechanisms of action, the global fingerprints
provide a comprehensive and objective assessment of an
herbal extract according to quality control metrics. As
illustrated by the example of PHY906, the results indi-
cate that a sensitive cellular detector and a gene expres-
sion readout is a useful approach to characterizing an
integrated bioresponse of macromolecule-rich extracts
found in various fungal extracts. Examination of multi-
ple cell types as potential “detectors” revealed that these
complex polychemical mixtures only regulate a few hun-
dreds of genes out of a total of ~18,000 possible genes.
This list of a few hundred genes could be filtered down
to a smaller subset of genes to form a selective, unique
and quantifiable bioresp onse signature pattern. Interest-
ingly, we found no obvious similarity in the gene expres-
sion bioresponse pattern for any of the individual herbal
ingredients used in the manufacture of PHY906 as com-
pared with the complete PHY906 formulation. This
finding suggests that the bioresponse of PHY906 mix-
ture, is more complex than the simple summation of
the individual bioresponses of the ingredients.
The ability to manufacture consistent batches of her-
bal extracts is fundamental to evidence-based scientific
and clinical study of botanical extracts. The problems of
botanical extract consistency [27-29] are mainly due to
poor product manufacturing protocols or non-standard
1 2 3 4 5 6 7 8 9 10 11 12
50
150
250
350
450
550
650
750
Control
PHY906-6
CPT-11
PHY906-6 + CPT-11
Days after Initial Treatment
Percent of Initial Tumor Size
PHY906-6
1 2 3 4 5 6 7 8 9 10 11 12 13
0
250
500
750
1000
Control
CPT-11
PHY906-F
PHY906-F + CPT-11
Days after Initial Treatment
Percent of Initial Tumor Size
HQT-F
PHY906-6 PHY906-10
1 2 3 4 5 6 7 8 9 10 11 12 13
0
250
500
750
1000
Control
PHY906-6 500 mg/kg
CPT -11 400 mg/kg
PHY906-6 + CPT-11
Days after Initial Treatment
% of Initial Tumor Size
1 2 3 4 5 6 7 8 9 10 11 12 13
0
250
500
750
1000
Control
CPT-11 400 mg/kg
PHY906-10 500 mg/kg
PHY906-10 + CPT-11
Days after Initial Treatment
% of Initial Tumor Size
% of initial tumor size
% of initial tumor size
Days after initial treatment
Days after initial treatment
% of initial tumor size
% of initial tumor size
Days after initial treatment
Days after initial treatment
Figure 8 Tumor growth in BDF-1 mice. Effects of three herbal batches on Camptosar® anti-tumor activity in mice. PHY906-6, PHY906-10 and
HQT-F were tested to monitor enhancement of the activity of Camptosar® on solid colon-38 tumors in vivo. BDF-1 mice (20-22 grams) with
tumor sizes of 150-300 mm
3
were selected. Five mice were used in each of four groups: (1) control (PBS for intraperitoneal or water for oral), (2)
PHY906 or HQT only (500 mg/kg), (3) Camptosar® (360 mg/kg) and (4) Camptosar® (360 mg/kg) and PHY906/HQT (500 mg/kg). PHY906 was
given orally (po) whereas Camptosar® was administered intraperitoneally (ip). Two different animal studies were conducted. The first study
compared PHY906-6 with PHY906-10 (upper panel). The results of this study indicate that both PHY906-6 and PHY906-10 enhance the anti-
tumor effect of Camptosar® compared with Camptosar® alone (P = 0.0001). A second independent study compared PHY906-6 with HQT-F (lower
panel). The results indicate that PHY906-6 enhances the anti-tumor effect of Camptosar® when compared with Camptosar® alone (P = 0.0001).
There was no significant enhancement by the HQT-F batch (p = 0.386)
Tilton et al. Chinese Medicine 2010, 5:30
/>Page 13 of 15
manufacturing procedures. The results of this study of
eighteen different batches of HQT confirm that signifi-
cant differences could be observed from samples from
different vendors. However, the analysis also strongly
indicates that when careful sourcing of botanical ingre-
dients and standardized manufacturing protocols are
employed, that multiple batches of a complex botanical
formulation, produced in different years and with differ-
ent harvests of raw herbal ingredients, can also be highly
consistent. The present study suggests that herbal
batches with chemical fingerprint PSI similarity scores
greater than 0.85 are likely to be pharmacologically
bioequivalent.
Chemical fingerprints and bioresponse fingerprints
corroborated by an in vivo pharmacology model, provide
orthogonal and complementary characterization meth-
odologies for determining batch-to-batch similarity.
Both LC/MS and qRT-PCR are standardized, highly
reproducible and cost-e ffective for characterizing phar-
maceutical botanical extracts. While neither methodol-
ogy by itself is sufficient to characterize a botanical
extract, the combination of chemical and biological
characterization does provide information-rich, high
resolution metrics fo r comparing different batches of an
herbal extract.
PhytomicsQC will be continually improved. The next
generation of the PhytomicsQC platform will include
sophisticated data mining tools and multiplexed chemi-
cal and biological response fingerprints to identify the
biologically active subset of the chemical fingerprints
and utilize PSI values that combine chemical and biolo-
gical information
Conclusion
Phytomics QC is a first generation platform for botanical
quality control that integrates high resolution, global
chemical fingerprints, novel bioresponse genomic
expression fingerprints, in vivo validation and a statisti-
cal pattern comparison algorithm, to provide an infor-
mation-rich approach to determining the batch-to-batch
similarity of botanical extracts. When this comprehen-
sive methodology was used to analyze HQT an d its
pharmaceutica l derivative PHY906, some significant dif-
ferences were found between herb al batches from differ-
ent manufacturers. However, when herbal selection and
manufacturing are carefully controlled, batches manu-
factured years ap art could be highly similar in their che-
mical, cellular response and pharmacological profiles.
Additional material
Additional file 1: Chemical fingerprint of PHY906
Abbreviations
S: Scutellaria baicalensis Georgi; P: Paeonia lactiflora Pall;G:Glycyrrhiza
uralensis Fisch;Z:Ziziphus jujuba Mill; QC: Quality Control; HQT: Huangqin
Tang; po: per oral or by mouth; ip: intraperitoneally; bid: “bis in die"; Latin for
twice a day; PSI: Phytomics Similarity Index; UV-VIS: Ultraviolet-Visible; MS:
Mass Spectrometry; LC/MS (+) (-): Liquid Chromatography coupled Mass
Spectrometry (positive mode) (negative mode); TIC: Total Ion Current; HPLC:
High Pressure Liquid Chromatography; GC:Gas Chromatography; TLC: Thin
Layer Chromatography; IACUC: Institutional Animal Care and Use Committee;
PSI: Phytomics Similarity Index
Acknowledgements
We gratefully acknowledge the support of National Center for
Complimentary and Alternative Medicine (NCCAM) and the Office of Dietary
Supplements (ODS) (R44-AT001448) and the National Cancer Institute (NCI)
(CA-63477) of the National Institute of Health USA and the National
Foundation for Cancer Research. We also acknowledge that a small subset
of the data and descriptions within this paper have been published in a
recent clinical article, as a strict requirement to demonstrate quality control
of PHY906 [30].
Author details
1
PhytoCeutica, Inc., 5 Science Park, New Haven, CT 06511, USA.
2
Department
of Pharmacology, Yale University School Of Medicine, New Haven, CT 06510,
USA.
Authors’ contributions
RT developed the PSI methodology. AP and JG conducted the LC/MS
characterization of HQT and PHY906. RM and WE conducted the
bioresponse gene expression fingerprints and quantitative PCR experiments.
ZJ and SHL performed the animal pharmacology experiments. JB and HW
developed the code and validated the PSI algorithm and implemented the
PhytomicsQC platform software. ZP, AAP and RT conducted data analysis
including PSI comparisons. YC developed the concept of phytomics and
invented the bioresponse gene expression analysis. All authors read and
approved the final version of the manuscript.
Competing interests
The authors of this paper are associated wit h PhytoCeutica, Inc.; YCC is the
scientific founder and the other authors are or were employees of
PhytoCeutica, Inc. RT, SHL and YCC hold stock or stock options in the
company.
Received: 9 February 2010 Accepted: 20 August 2010
Published: 20 August 2010
References
1. van Breemaen RB, Fong HHS, Farnsworth NR: The role of quality assurance
and standardization in the safety of botanical dietary supplements.
Chem Res Toxicol 2007, 20(4):577-82.
2. Khan IA: Issues related to botanicals. Life Sci 2006, 78(18):2033-2038.
3. Zhou Y, Hang Y, Chen B: Study on the original plants and macroscopic
characters of Radix Paeoniae. Zhongyaocai 2005, 28(10):877-879.
4. Kondo K, Shiba M, Yamaji H, Morota T, Zhengmin C, Huixia P, Shoyama Y:
Species identification of licorice using nrDNA and cpDNA genetic
markers. Biol Pharm Bull 2007, 30(8):1497-1502.
5. Yip PY, Chau CF, Mak CY, Kwan HS: DNA methods of identification of
Chinese medicinal materials. Chin Med 2007, 2:9.
6. Zeng ZD, Liang YZ, Chau FT, Chen S, Daniel MK, Chan CO: Mass spectral
profiling: an effective tool for quality control of herbal medicines. Anal
Chim Acta 2007, 604(2):89-98.
7. Yu K, Gong Y, Lin Z, Cheng Y: Quantitative analysis and chromatographic
fingerprinting for the quality evaluation of Scutellaria Baicalensis
Georgigi using capillary electrophoresis. J Pharm Biomed Anal 2007,
43(2):540-548.
8. Springfield EP, Eagles PKF, Scott G: Quality assessment of south African
herbal medicines by means of HPLC fingerprinting. J Ethnopharmacol
2005, 101(1-3):75-83.
9. Strehle KR, Rosch P, Berg D, Schulz H, Popp J: Quality control of
commercially available essential oils by means of raman spectroscopy. J
Agric Food Chem 2006, 54(19):7020-7026.
Tilton et al. Chinese Medicine 2010, 5:30
/>Page 14 of 15
10. Xu YQ, Sun SQ, Feng XF, Hu SL: Quick identification of skullcaps in
different geographical origins using clustering analysis method and
infrared fingerprint spectra. Guag Pu Xue Yu Guang Pu Fen Xi 2003,
23(3):502-505.
11. He XG: On-line identification of phytochemical constituents in botanical
extracts by combined high-performance liquid chromatographic-diode
array detection-mass spectrometric techniques. J Chromatogr A 2000,
880(1-2):203-232.
12. Mattoli L, Cangi F, Maidecchi A, Ghiara C, Ragazzi E, Tubaro M, Stella L,
Tisato F, Traldi P: Metabolomic fingerprinting of plant extracts. J Mass
Spectrom 2006, 41(12):1534-1545.
13. Han J, Ye M, Xu M, Sun J, Wang B, Guo D: Characterization of flavonoids
in the traditional Chinese herbal medicine-Huang Qin by liquid
chromatography coupled with electrospray ionization mass
spectrometery. J Chromatogr B Analyt Technol Biomed Life Sci 2007,
848(2):355-362.
14. Li S, Han Q, Qiao C, Song J, Cheng CL, Xu H: Chemical markers for the
quality control of herbal medicines: an overview. Chin Med 2008, 3:7.
15. He K, Pauli GF, Zheng B, Wang H, Bai N, Peng T, Roller M, Zheng Q:
Cimicifuga species identification by a high performance liquid
chromatography-photodiode array/mass spectrometric/evaporative light
scattering detection for quality control of black cohosh products. J
Chromatogr A 2006, 1112(1-2):241-254.
16. Bigler D, Gulding KM, Dann R, Sheabar FZ, Conaway MR, Theodorescu D:
Gene profiling and promoter reporter assays: novel tools for comparing
the biological effects of botanical extracts on human prostate cancer
cells and understanding their mechanisms of action. Oncogene 2003,
22(8):1261-1272.
17. Rong J, Tilton R, Shen J, Ng KM, Liu C, Tam PKH, Lau ASY, Cheng YC:
Genome-wide biological response fingerprinting (BioReF) of the
botanical formulation ISF-1 enables the selection of multiple marker
genes as a potential metric for quality control. J Ethnopharmacol 2007,
113(1):35-44.
18. Hsu HY, Hsu CS: Commonly Used Chinese Herb Formulas - With Illustrations
Los Angeles: Oriental Healing Art Institute 1980.
19. Liu SH, Jiang Z, Liddil J, Hu K, Gullen EA, Cheng YC: Prevention of CPT-11
induced toxicity by a Chinese medicinal formulation, PHY-906. [abstract].
Proc Am Assoc Cancer Res 2000, 41:410, 2608.
20. Liu SH, Jiang Z, Cheng YC: A Chinese medicine formulation, PHY-906, can
enhance the therapeutic index of CPT-11 and other anticancer drugs
against cancer in mice. Proc Am Assoc Cancer Res 2001, 42:85, [abstract]
458.
21. Liu SH, Jiang Z, Su TM, Gao WY, Leung CH, Lee Y, Cheng YC: Developing
PHY906 as a broad-spectrum modulator of chemotherapeutic agents in
cancer therapy. Proc Am Assoc Cancer Res 2004, 45:128, [abstract] #557.
22. Farrell MP, Kummar S: Phase I/IIA randomized study of PHY906, a novel
herbal agent, as a modulator of chemotherapy in patients with
advanced colorectal cancer. Clin Colorectal Cancer 2003, 2(4):253-256.
23. Liu SH, Foo A, Jiang Z, Marathe R, Guan J, Su TM, Tilton R, Yen Y, Rose M,
So S, Chu E, Cheng YC: PHY906 as a broad-spectrum enhancer in cancer
therapy: clinical and preclinical results in hepatocellular carcinoma.
[abstract]. Proc Am Assoc Cancer Res 2006,
47:2145.
24. Rose MG, Yen Y, So S, Saif MW, Chu E, Liu S, Jiang Z, Foo A, Tilton R,
Cheng YC: Phase I/II study of PHY906/capecitabine in hepatocellular
carcinoma. [abstract]. J Clin Oncol 2007, 25(18s):15152.
25. Spiegel MR: Correlation theory. Theory and Problems of Probability and
Statistics New York: McGraw-Hill, 2 1992, 294-323.
26. Ye M, Liu SH, Jiang Z, Lee Y, Tilton R, Cheng YC: Liquid chromatography/
mass spectrometry analysis of PHY906, a Chinese medicine formulation
for cancer therapy. Rapid Commun Mass Spectrom 2007, 21(22):3593-3607.
27. Bailey NJ, Sampson J, Hylands PJ, Nicholson JK, Holmes E: Multi-
component metabolic classification of commercial feverfew preparations
via high-field 1H-NMR spectroscopy and chemometrics. Planta Med 2002,
68(8):734-738.
28. Manning J, Roberts JC: Analysis of catechin content of commercial green
tea products. J Herb Pharmacother 2003, 3(3):19-32.
29. Ernst E: Herbal medicines: balancing benefits and risks. Novartis Found
Symp 2007, 282:154-167, discussion 167-172, 212-218.
30. Saif MW, Lansigan F, Ruta S, Lamb L, Mezes M, Elligers K, Grant N, Jiang ZL,
Liu SH, Cheng YC: Phase I study of the botanical formulation PHY906
with capecitabine in advanced pancreatic and other gastrointestinal
malignancies. Phytomedicine 2010, 17(3-4):161-169.
doi:10.1186/1749-8546-5-30
Cite this article as: Tilton et al.: A comprehensive platform for quality
control of botanical drugs (PhytomicsQC): a case study of Huangqin
Tang (HQT) and PHY906. Chinese Medicine 2010 5:30.
Submit your next manuscript to BioMed Central
and take full advantage of:
• Convenient online submission
• Thorough peer review
• No space constraints or color figure charges
• Immediate publication on acceptance
• Inclusion in PubMed, CAS, Scopus and Google Scholar
• Research which is freely available for redistribution
Submit your manuscript at
www.biomedcentral.com/submit
Tilton et al. Chinese Medicine 2010, 5:30
/>Page 15 of 15