Báo cáo y học: " Performance of UNHCR Nutrition Programs in Post-Emergency Refugee Camps" pot
Bạn đang xem bản rút gọn của tài liệu. Xem và tải ngay bản đầy đủ của tài liệu tại đây (618.28 KB, 22 trang )
This Provisional PDF corresponds to the article as it appeared upon acceptance. Fully formatted
PDF and full text (HTML) versions will be made available soon.
Performance of UNHCR Nutrition Programs in Post-Emergency Refugee Camps
Conflict and Health 2011, 5:23 doi:10.1186/1752-1505-5-23
Shannon Doocy ()
Hannah Tappis ()
Christopher Haskew ()
Caroline Wilkinson ()
Paul Spiegel ()
ISSN 1752-1505
Article type Research
Submission date 31 May 2011
Acceptance date 26 October 2011
Publication date 26 October 2011
Article URL />This peer-reviewed article was published immediately upon acceptance. It can be downloaded,
printed and distributed freely for any purposes (see copyright notice below).
Articles in Conflict and Health are listed in PubMed and archived at PubMed Central.
For information about publishing your research in Conflict and Health or any BioMed Central journal,
go to
/>For information about other BioMed Central publications go to
/>Conflict and Health
© 2011 Doocy et al. ; licensee BioMed Central Ltd.
This is an open access article distributed under the terms of the Creative Commons Attribution License ( />which permits unrestricted use, distribution, and reproduction in any medium, provided the original work is properly cited.
1
Performance of UNHCR Nutrition Programs in
Post-Emergency Refugee Camps
by Shannon Doocy
1
, Hannah Tappis
1
, Christopher Haskew
2
,
Caroline Wilkinson
2
, and Paul Spiegel
2
1
Bloomberg School of Public Health, Johns Hopkins University, Baltimore, Maryland, USA
2
United Nations High Commissioner for Refugees, Geneva, Switzerland
Corresponding Author: Shannon Doocy, Johns Hopkins Bloomberg School of Public
Health, 615 N Wolfe St, Ste E8132, Baltimore, MD 21205 USA. Tel. 1-410-502-2628
Fax 1-410-614-1419 Email:
2
Abstract
Background. The United Nations High Commissioner for Refugees (UNHCR) launched a health
information system (HIS) in 2005 to enhance quality and consistency of routine health
information available in post-emergency refugee camps. This paper reviews nutrition indicators
and examines their application for monitoring and evaluating the performance of UNHCR
nutrition programs in more than 90 refugee camps in 18 countries.
Methods. The HIS is a primary source of feeding program data which is collected using
standardized case definitions and reporting formats across refugee camps in multiple settings.
Data was aggregated across time periods and within and across countries for analysis. Basic
descriptive statistics were then compared to UNHCR program performance standards.
Results. Camp populations covered by the HIS ranged from 192,000 to 219,000 between 2007
and mid-2009; 87% of under five children covered by the HIS were in Africa and 13% in Asia.
Average moderate acute malnutrition (MAM) and severe acute malnutrition (SAM) rates reported
in 74 of 81 camps for the 2007-2009 time periods were 7.0% and 1.6%, respectively. The
supplementary feeding program (SFP) admission rate was 151/1000/yr with 93% of SFP
admissions occurring in Africa. SFP performance consistently exceeded all UNHCR standards
with the exception of length of enrollment. Average length of SFP enrollment was 12 weeks in
Africa and 22 weeks in Asia as compared to the UNHCR standard of <8 weeks. The therapeutic
feeding program (TFP) admission was 22/1000/yr with 95% of TFP admissions in Africa. TFP
performance met UNHCR standards with the exception of daily weight gain.
Conclusions. Inclusion of children identified as moderately and severely wasted in the HIS would
allow UNHCR to better track and respond to changes in nutrition status. Improved growth
monitoring coverage or active malnutrition surveillance would increase UNHCR’s ability to
identify and treat cases of acute malnutrition. Expansion of nutrition reporting to address the
transition to community-based therapeutic care is essential for adequate performance monitoring
in the future. In terms of program priorities, a focus on camps and countries with large refugee
populations and high feeding program enrollment rates would have the greatest impact in terms of
absolute reductions in the incidence and prevalence of malnutrition.
3
Introduction
In 2009, there were an estimated 10.5 million refugees of concern to the United Nations
High Commissioner of Refugees (UNHCR) [1]. Refugees represent a minority of the displaced
population worldwide and less than half of refugees live in camps. A small proportion live among
rural host communities and the majority are integrated among host country urban populations
[2,3]. UNHCR refugee camps are predominantly in rural areas of Africa and Asia in protracted or
post-emergency contexts where their populations benefit from relatively stable environments and
low mortality rates.
In contrast to acute phase emergencies, mortality rates rarely exceed
emergency thresholds and are often lower among refugees as compared to surrounding host
populations [4]. Factors contributing to lower mortality include better access to primary health
care, water and sanitation, food rations, and public health measures such as disease surveillance
and response [3,5,6]. Malnutrition contributes to more than half of child deaths in less-developed
settings and the association between malnutrition and mortality in refugee camp settings is well
documented [7,8]. However, as a result of emergency nutrition programming that includes routine
distribution of food rations, identification of malnourished children through screening and growth
monitoring, and rehabilitation of malnourished individuals through supplementary and
therapeutic feeding programs, malnutrition is no longer a major a cause of mortality in refugee
camp settings. In UNHCR camps, the World Food Program (WFP) provides food rations and
implementing partners, usually non-government organizations (NGOs), implement nutrition and
health programs with support from UNHCR and WFP.
Routine monitoring data is available from many of these programs, however operational
challenges, varied reporting structures, and lack of coordination across implementing agencies
has limited the utility of this information for the assessment of changes in population health status
or comparisons of trends across regions. Often, the most useful information concerning the
nutritional status of refugee populations is collected through periodic nutrition surveys that can be
of variable quality [9]. In 2005, UNHCR launched a health information system (HIS) to enhance
the quality and consistency of routine health information available in protracted refugee
situations. The HIS was initially piloted in three countries in East Africa (Tanzania, Kenya, and
Ethiopia) and is now operational over 90 refugee camps in 18 countries worldwide where it used
to monitor health and nutrition services provided to more than 1.5 million refugees by UNHCR
and their partners [10]. This paper reviews the nutrition indicators collected in the HIS and
examines the extent to which they can be used to monitor and evaluate the performance of
UNHCR’s nutrition programs in the field. It is the first global analysis of refugee nutrition
programs using a standardized routine data source.
Methods
UNHCR Nutrition Programs. UNHCR standards state the global acute malnutrition (GAM)
should not exceed 10% of the under-five population. All children under five years in UNHCR
camps should participate in routine growth monitoring as part of the Expanded Program for
Immunizations (EPI), which is managed by the maternal and child health (MCH) unit at the main
camp health facility. UNHCR guidelines recommend for monthly growth monitoring visits for
children under five, with quarterly visits as a minimum standard [11]. Children identified as
underweight, with weight-for-age measures falling in the 60-80% median range or <60% median
on the National Center for Health Statistics/World Health Organization (NCHS/WHO) growth
4
curve
b
are referred to supplementary and therapeutic feeding centers for further evaluation.
Feeding program admission criteria are defined by nutritional status. Children under five with
moderate acute malnutrition (MAM), defined by weight-for-height of 70% to 80% of the
NCHS/WHO median are enrolled in supplementary feeding programs (SFP) that provide
additional weekly rations until weight increases to 90% of the NCHS/WHO median at two
consecutive weekly weighings. Upon SFP exit, length of stay for children under five is calculated
in number of weeks in the program. UNHCR indicators for well performing SFP include length
of stay less than 8 weeks, recovery rate higher than 75%, default rate less than15% and death rate
less than 3%. Children under five with severe acute malnutrition (SAM), defined as weight-for-
height <70% of the NCHS/WHO median or oedema, are admitted to in-patient or daily
therapeutic feeding programs (TFP) for stabilization. Children admitted for severe acute
malnutrition are discharged from TFP to SFP weight-for-height stabilizes at 80% of the
NCHS/WHO median or oedema symptoms disappear [12]. Upon TFP exit, length of stay (days)
and average weight gain (g/kg/day) are calculated. UNHCR standards for well performing TFP
include length of stay less than 30 days, weight gain >8g/kg/day, recovery rate higher than 75%,
default rate less than 15% and death rate less than 10%. Program enrollment refers to the number
of children participating in SFP or TFP at the end of the reporting month. Program coverage
refers to the proportion of children under-five with MAM enrolled in SFP or proportion of
children under-five with SAM enrolled in TFP.
Data Analysis. Monthly HIS data on camp population, EPI growth monitoring participation, and
nutrition programs were exported from the UNHCR’s HIS database [13]. Nutrition program data
included the number of children admitted to feeding programs, number remaining enrolled in the
program at the end of each month, mean length of stay, reason for discharge (recovery, referral,
drop-out), and average weight gain (TFP only). Information on nutrition program admission and
enrollment was combined with population data to calculate admission rates and proportions.
Inclusion criteria developed for the analysis of HIS nutrition data included: 1) time period
of reporting—the HIS was piloted in 2005 and implemented more broadly in subsequent years;
analysis was limited to the period January 2007 to May 2009 to ensure the data were more
representative of the entire UNHCR refugee camp population; 2) low or no reporting—camps
were omitted to limit inconsistencies during aggregation if they reported data for less than six
months or reported less than one percent of the under-five population enrolled in SFP or TFP
(these included Cameroon and Guinea for SFP, and Burundi, Cameroon, Guinea, Nepal, Yemen,
and Zambia for TFP); and 3) admission criteria—analysis was limited to children under five that
were admitted for malnutrition. Microsoft Excel was used for visual data exploration and to
create tables and figures for publication. Descriptive statistics (frequency, mean, median, range)
and odds of admission/enrollment were calculated using STATA 11. Because the focus of the
analysis is program evaluation, camps were weighted equally, regardless of population size.
Results
Camp populations covered by the HIS remained relatively constant between 2007 and
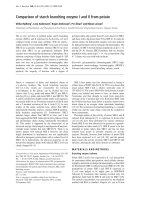
mid-2009 with averages of 192,472 under five children covered in 2007 (31%), 218,873 covered
in 2008 (36%), and 206,441 in 2009 (33%). When proportion of under five children covered by
the HIS was assessed by region, 87% were in Africa and 13% in Asia; under five refugee
5
populations by country are provided in Figure 1. When growth monitoring was evaluated in terms
of utilization rates, Asia had comparatively high utilization at 60% as compared to 34% in Africa.
The proportion of children identified in growth monitoring as having acute malnutrition or
wasting, which is indicated by low weight-for-height, is not recorded in the HIS; instead, acute
malnutrition prevalence from camp-level nutrition surveys is entered in the HIS intermittently.
The average MAM and SAM rates reported in 74 of 81 camps for the 2007-2009 time periods
were 7.0% and 1.6%, respectively. Country level MAM rates ranged from 1.1% in Zambia (2008)
to 15.8% in Sudan
a
(2009) and SAM rates ranged from 0.1% in Tanzania (2008) to 5.0% in Chad
(2009).
Supplementary feeding programs. There were a total 57,005 SFP admissions between January
2007 and May 2009 and more than half of admissions occurred in 2008. Under five refugee SFP
admissions and enrollment are summarized by year, continent, and country in Table 1; camp level
SFP and TFP enrollments are summarized in Table 2. The overall SFP admission rate was
151/1000/yr (range 1-540). Children in Asia accounted for 7% of SFP admissions and were
significantly less likely to be admitted to SFP than children in Africa (OR=0.41, CI: 0.39-0.42).
However, when assessed at the country level, average SFP admission and enrollment rates were
higher in Asia than in Africa due to high admission and enrollment rates in Bangladesh and the
small number of Asian countries reporting. Re-admissions, defined as malnourished children
enrolling in SFP within one month of successful discharge, accounted for 8.6% of total
admissions, and were substantially higher in Asia (31.9%) as compared to Africa (6.3%). The
lowest re-admissions levels were observed in Zambia (2.0%), Tanzania (2.1%) and Ethiopia
(4.3%).
SFP entry and exit criteria are variable and many SFP programs target the malnourished
in addition to other vulnerable groups. Average monthly enrollment for MAM children in SFP
programs (Table 1) provides a better perspective on program size and coverage of the under-five
population. Country-level SFP admissions ranged from a low of 16/1000/yr in Tanzania to a high
of 397/1000/yr in Djibouti. Bangladesh, Sudan and Kenya also had notably high SFP admission
rates. Although the country-level admission rate was highest in Djibouti at 14.6%, the refugee
population in Sudan, with a 12.4% enrollment rate, is seven times larger and contributed
substantially higher number of enrollment. Kenya also had large numbers of children enrolled in
SFPs with an average enrollment rate of 9.1% of children under five. On average, 4.7% (range of
0.5-13.7%) children less than five years of age in UNHCR refugee camps were enrolled in SFPs
because of poor nutritional status.
SFP performance consistently exceeded all UNHCR standards with the exception of
length of enrollment (Table 3). Average length of SFP enrollment was 12 weeks in Africa and 22
weeks in Asia as compared to the UNHCR standard of <8 weeks. All regions had average
recovery rates above 80% (standard >75%), death rates below 1% (standard <3%) and default
rates below 9% (standard <15%). At the country level, only Thailand (70%) and Yemen (55%)
did not meet the >75% standard for exits due to recovery. Thailand’s default and death rates did
fall within the standards; Yemen had a default rate of 28%, which was nearly double the UNHCR
standard. In addition, nine camps in other countries (Chad, Nepal, Rwanda, Tanzania and
Zambia) did not meet the UNHCR standard for recovery. All countries fell within the acceptable
mortality rate standard of <3% with the exception of Zambia where on average, SFPs had a 5.7%
6
mortality rate. Outside of Zambia, mortality rates ranged from 0% in many camps to 3.8% in
Farchana camp in Chad and 5.4% in Kilo 26 camp in Sudan.
Therapeutic feeding programs. The average TFP admission and enrollment rates were 22/1000/yr
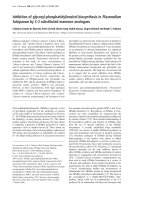
(range 0-124) and 5/1000/yr (range 0-45), respectively (Table 4). Figure 2 illustrates the
relationship between average SFP and TFP enrollment at the camp level. The majority of camps
that have average SFP enrollment rates above 10% have relatively low TFP enrollment rates
(≤0.5%) Under five refugee TFP admissions and enrollment are summarized by year, continent,
country, and admission type in Table 4. Overall, 79% of TFP admissions were for acute wasting
(n=3,372) and 21% were for oedema (n=944). Average admission rates were 17/1000/yr for acute
wasting and 5/1000/yr for Oedema. The vast majority of TFP admissions were in Africa, with
only 5% of admissions reported in Asia (including 7.1% of acute wasting and 0.6% of oedema of
admissions). Overall children in Africa were 1.85 (CI: 1.62-2.10) times more likely to be
admitted to TFP than children in Asia. Average monthly enrollment for SAM children in TFP
programs was less than 1% of the under-five population in most camps; only Sudan and Uganda
had camps with higher enrollment. Overall, 6.2% of acute wasting admissions and 3.9% of
oedema admissions were re-admissions, and re-admission rates were higher in Africa than Asia.
Re-admissions accounted for 20% of acute wasting admissions in Asia and 5% in Africa. For
oedema, the re-admission rate was 3.9% in African countries. No re-admissions were reported for
oedema in Asia.
TFP performance for acute wasting admissions met UNHCR standards with the
exception of daily weight gain in both Africa and Asia and recovery rate Asia (Table 5). Average
weight gain for acute wasting admissions in Asia and Africa were 7g/kg/day and 7.5g/kg/day,
respectively, which fell below the UNHCR standard of >8g/kg/day. In Asia, the average recovery
rate was below the 75% standard in both Bangladesh (69%) and Thailand (57%), contributing to
the low regional average of 66%. In Africa, Kenya and Djibouti, had sub-standard recovery rates
of 57% and 70%, respectively; the low recovery rate in Djibouti was attributed to a high default
rate. TFP performance for oedema admissions met all UNHCR standards with the exception of
recovery and death rates in Asia (Table 6). In Asia, the average recovery rate was 50% (UNHCR
standard >75%) and the average mortality rate was 17% (UNHCR standard <10%). High oedema
mortality and low recovery rates in Asia is likely due to a 50% average mortality rate in Mae La
camp and no reporting from other camps in Thailand. No oedema deaths were reported in
Bangladesh.
Discussion
SFP and TFP admission rates were consistently higher in Africa than in Asia. Most
refugee camp populations receive rations that account for most of their nutritional needs.
However, the total ration amount provided frequently depends on access to markets, livelihood
opportunities, donor funding, and supply chain logistics. Children in camps in Africa were
significantly more likely to be admitted to SFPs and TFPs than those in Asia due to more unstable
situations in Africa (e.g. insecurity and population movements in numerous camps due to
conflict). Furthermore, unlike in Asia, many of the camps in Africa are situated in arid conditions
where small scale agricultural projects are more difficult to implement.
7
SFP performance consistently met all standards with the exception of length of
enrollment (standard of <8 weeks), which was exceeded in 79% of camps reporting. UNHCR’s
SFPs predominantly provide dry weekly take home rations for MAM children and their
households. Slow recovery rates may be a function of children not consuming adequate amounts
of the supplementary ration. Sharing of dry take home rations is a frequent challenge in SFP
programs; even when additional food is provided for other household members it can be difficult
to ensure that the targeted child receives adequate amounts of the provided supplementary foods
[14,15]. In situations where ration reductions have occurred or where market conditions and/or
population preferences favor the sale of rations, extended SFP enrollment periods may be
especially problematic. In certain contexts where failure to meet length enrollment standards is of
particular concern, wet feeding programs or ready-to-use foods may promote faster recovery (and
thus shorter enrollment). However, these approaches to supplementary feeding can be time and
cost intensive [16,17].
SFPs in all countries fell within the acceptable mortality standard of <3% with the
exception of Zambia which had a 5.7% mortality rate. Overall, 4% (n=4) of camps did not meet
the SFP mortality standard including 2 of 4 camps in Zambia. GAM prevalence among children
in Zambia was estimated at 6.2% in December 2008, which is above the UNHCR standard of 5%
for that time period (the standard has since been changed to 10%). However, the under-five
mortality rate was reportedly relatively low at 5 deaths/1,000 under-5 children/year [18].
Underweight status is associated with increased risk of infectious disease morbidity and
childhood mortality [19,20]. Malaria accounted for more than one third of morbidity in Zambia
refugee camps, and an estimated 57% of malarial illness in children is attributed to underweight
status. Children that are moderately and severely underweight are five to eight times as likely to
die before the age of five as compared to children that were better nourished [21]. Thus it is
likely that children in MAM programs would have elevated mortality rates, though this would not
be limited to Zambia and the highest mortality rates would be anticipated among children in
TFPs.
Overall, 94% of TFP admissions were in Africa and children in Africa were significantly
more likely to be admitted to TFP than those in Asia. Access to food in African camps appears to
be a greater concern than in Asian camps, however, effective SFP and growth monitoring
programs with high coverage levels would ideally reduce the number of TFP admissions in food
insecure contexts. The fact that majority of camps that have average SFP enrollment rates above
10% have relatively low TFP enrollment rates (≤0.5%) suggests that growth screening and SFP
objectives are being met and that SAM is relatively well controlled. Camps with both high SFP
and TFP enrollment rates (Um Gargour, Suki, and Abuda, all in Sudan), however, are deserving
of additional attention because this is potentially indicative of a poor nutrition situation. SFP
enrollment in most camps in Sudan exceeds 10% and Um Gargour and Wad Sharifey had
especially high SFP enrollment rates at 19%; the situation in Abuda appears particularly critical,
where the TFP enrollment rate of 2.8% exceed the UNHCR standard for SAM of <2%.
Camp level statistics for Sudan were not available however, aggregated data for all camps
indicates generally poor nutritional status among refugees, with GAM and SAM rates of 17.1%
and 2.1%, respectively, and inadequate daily ration of 1575kcal/person/day [18]. Increasing the
general ration, blanket supplementary feeding in camps where GAM exceeds 15%, and active
8
screening for malnutrition which would result in increased SFP and TFP enrollment are steps that
could be taken to lower malnutrition prevalence rates and stabilize the nutrition situation [22].
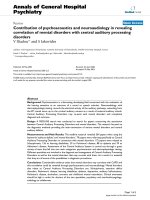
Camp-level MAM prevalence, SFP enrollment rates, and estimated SFP coverage rates
are presented in Figure 3. SFP coverage rates varied widely, however, nearly half of the camps
(22 of 53 where MAM could be calculated) were estimated to fall below 50% which is
concerning. It is possible that coverage estimates are inaccurate due to problems with surveys
where MAM prevalence was over estimated or due to unreliable population denominator
estimates. Another potential scenario is that poor coverage and use of growth monitoring
programs and lack of active nutrition screening programs result in low identification and referral
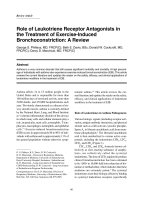
rates of MAM children to SFP programs. Camp-level SAM prevalence, TFP enrollment rates, and
estimated TFP coverage rates are shown in Figure 4. SFP coverage rates varied widely in the
majority of camps (9 of 12) where SAM rates exceeded the UNHCR standard of 2%, TFP
coverage rates were estimated at <25%. As with MAM, it is possible that coverage rates were
underestimated as a result of poor quality nutrition survey data, however it is unlikely that this
alone is would result in consistently low coverage rates. Active surveillance for MAM and SAM
and subsequent referral of malnourished children to SFP and TFP programs is a critical activity
that could increase the coverage and effectiveness of UNHCR nutrition programs.
TFP performance was variable when compared to UNHCR standards, suggesting the
need for targeted improvement efforts in some camps. TFP readmission rates in Africa were more
than four times higher than those in Asia for both acute wasting and oedema. This suggests that
SFP programs in camps with high TFP admission and re-admission rates should be examined for
potential improvements. In addition, camps with small SFP programs but high TFP enrollment
(Kiryandongo and Oruchinga in Uganda, Gihembe in Rwanda) could expand and improve SFP
programming to prevent deterioration from MAM to SAM. The ongoing transition to community-
based therapeutic care (CTC) for uncomplicated SAM cases may be effective in reducing TFP re-
admission rates. The TFP length of stay standard (<30 days) was frequently exceeded, however,
regional averages for length of stay only exceed this standard by several days and this indicator
may not be of particular importance provided that daily weight gain standards are met.
Other TFP program performance measures indicate a need for close monitoring during
the transition to CTC. This is particularly true in Asia where low recovery rates, substandard
weight gain, high oedema death rates observed. However, given that Asia comprises only 5% of
TFP admissions, a focus on improving TFP performance in Africa would benefit a larger
population. Given that 54.7% of SFP beneficiaries and 33.6% of TFP beneficiaries worldwide are
in Kenya, feeding program improvements here would yield sizeable benefits in terms of absolute
reductions in malnutrition prevalence and mortality rates among refugee children of concern to
UNHCR.
Limitations. The primary aim of the HIS is to provide basic information on refugee health
status and services provided by health facilities in camps. There are several key limitations when
trying to draw conclusions related to nutritional status. Firstly, as HIS data is predominantly
collected in health facilities, it may be biased because populations that do not seek care are
excluded. As camps are small, circumscribed areas and their residents generally do not access
outside health services, this is not perceived as a major concern. Secondly, because data are
reported at camp level and not at the individual level, some information cannot be gleaned from
available data. For example, it would have been useful to assess individual predictors for feeding
9
program enrollment or re-admission but this is rarely possible from routine nutritional
surveillance. Thirdly, the frequency of reporting was sometimes inconsistent or implausible
monthly variations were observed in some reported values. Outliers were dropped and averages
were used to minimize the effect of inconsistencies on findings, however, the overall quality of
nutrition data used was variable. Similar findings were noted in a recent Centers for Disease
Control (CDC) evaluation of the HIS [23,24]. Finally, information was lacking on several key
indicators that could have greatly contributed to analysis; these included growth monitoring
outcomes, prevalence of malnutrition (necessary to calculate coverage rates), information on
ration content and frequency of distributions, and the extent and use of community-based
therapeutic care (CTC) programs for SAM children which is beginning to replace facility-based
programs and which was reported only for a minority of camps.
Conclusions
UNHCR’s HIS is a primary source of routine feeding program data collected using
standardized case definitions and reporting formats across refugee camps in multiple settings.
Findings from this paper, which analyzed available data from growth monitoring, supplementary
and therapeutic feeding programs, includes more than 90 refugee camps in 18 countries and
provides the first comprehensive assessment of feeding programs in UNHCR refugee camps
worldwide. A number of important findings with regard to the performance of selective feeding
programs in post-emergency settings were identified in addition to areas requiring further analysis
and programmatic improvements. Higher growth monitoring coverage rates (≥ 90%, the UNHCR
standard) of children under-five or active surveillance for malnourished children would increase
the ability of UNHCR and its partners to identify and treat cases of acute malnutrition.
Additionally the inclusion of the number of children identified as moderately and severely wasted
would allow UNHCR to better track and respond to changes in acute malnutrition prevalence
rates. Expansion of nutrition reporting in the HIS will be especially important during the
transition to community-based therapeutic care if CTC performance is to be adequately
monitored. In terms of priority regions for program improvement, a focus on camps and countries
with large refugee populations and high feeding program enrollment rates, in particular Kenya
and Sudan, would have the greatest impact in terms of absolute reductions in the incidence and
prevalence of malnutrition among children in UNHCR refugee camps.
10
Author Contributions
SD conceived of the study and led the manuscript drafting and finalization process. HT led data
analysis and assisted with drafting the manuscript. CH provided HIS technical support for data
analysis and critical review of the manuscript. CW contributed to drafting and critical review of
the manuscript. PS conceived of the study and contributed to critical review of the manuscript.
All authors read and approved the final version of the manuscript.
Funding
This study was supported by the United Nations High Commissioner for Refugees.
Competing Interest Declaration
The authors declare that they have no competing interests.
11
Table 1. Beneficiary population and SFP feeding program admissions by year, region, and country
Supplementary Feeding Program
Under Five Population
Admissions (# admitted monthly) Total Enrollment (# enrolled monthly)
Average % of total
Average
new
admissions
% of new
admissions
Admission
Rate (per
1000/yr)
Odds of
Admission (CI)*
Average
Enrollment
% of
Children
Enrolled
Odds of Enrollment
(CI)
Moderate
Acute
Malnutrition
Prevalence**
By Year
2007 192,472 31.2% 25,694 23.8% 74 0.49 (0.36-0.67) 6,635 4.6% 0.66 (0.63-0.68)
2008
218,873 35.4% 27,678 53.1% 122 0.85 (0.65-1.11) 9,631 5.7% 0.85 (0.83-0.88)
2009* 206,441 33.4% 12,016 23.1% 140 Reference 10,598 5.2% Reference
By Region
Africa 211,336 86.9% 413 81.5% 148 Reference 1474 0.7% Reference
Burundi 3,651 1.5% 8 1.6% 100 0.64 (0.48-8.45) 23 2.0% 2.94 (2.29-3.73)
4.2%
Chad 46,234 19.0% 37 7.3% 140 0.94 (0.72-1.21) 101 3.3% 4.86 (4.51-5.22)
12.3%
Djibouti 1,283 0.5% 40 7.9% 397 3.79 (3.04-4.74) 158 12.4% 20.14 (16.86-24.05)
12.7%
Ethiopia 15,535 6.4% 18 3.6% 98 0.63 (0.47-0.83) 89 4.5% 6.67 (6.08-7.33)
9.8%
Kenya 38,588 15.9% 195 38.5% 248 0.24 (0.21-0.29) 587 6.6% 10.03 (9.39-10.71)
11.3%
Rwanda 9,817 4.0% 25 4.9% 99 0.63 (0.47-0.83) 96 3.1% 4.57 (4.02-5.18)
6.9%
Sudan 9,012 3.7% 30 5.9% 291 2.36 (1.88-2.97) 194 13.7% 22.63 (20.89-24.51)
17.9%
Tanzania 38,588 15.9% 10 2.0% 19 0.11 (0.65-0.18) 26 0.5% 0.75 (0.64-0.87)
2.3%
Uganda 17,121 7.0% 11 2.2% 59 0.36 (0.26-0.50) 25 1.2% 1.72 (1.47-1.99)
4.3%
Yemen 4,518 1.9% 14 2.8% 62 0.38 (0.27-0.52) 42 1.6% 2.24 (1.73-2.85)
N/A
Zambia 10,591 4.4% 25 4.9% 117 0.76 (0.58-0.99) 133 5.0% 7.47 (6.74-8.28)
6.2%
Asia 31,971 13.1% 94 18.5% 171 Reference 302 3.3% Reference
Bangladesh 5,148 2.1% 77 15.2% 351 2.62 (2.11-3.25) 223 8.6% 2.77 (2.47-3.12)
8.6%
Nepal
8,082 3.3% 3 0.6% 29 0.14 (0.09-0.21) 29 2.3% 0.70 (0.59-0.82)
10.5%
Thailand 18,741 7.7% 14 2.8% 77 0.40 (0.30-0.54) 50 2.7% 0.83 (0.74-0.92)
2.7%
OVERALL 243,307 100.0% 507 100.0% 151 1,776 3.80%
*Includes January thru May 2009 only.
**Prevalence as reported in UNHCR 2008 Public Health Factsheets.
12
Table 2: Camp Level TFP and SFP enrollment rates by region
SFP Enrollment Rate
TFP Enrollment
Rate
Low (<2.5%) Medium (2.5-4.9%) High (5.0-9.9%) Very High (10+%)
ASIA
Nu Poh (Thailand) Mae La Oon (Thailand) Ban Don Yang (Thailand)
Mae La (Thailand)
Mae Ra Ma Luang (Thailand)
Very Low (<.25%)
Umpiem Mai (Thailand)
Kutupalong (Bangladesh) Medium
(0.25 49%)
Nayapara (Bangladesh)
High (0.5-0.9%)
Very High (>1%)
AFRICA
Dimma (Ethiopia) Djabal (Chad) Oure Cassoni (Chad) Shimelba (Ethiopia)
Lugufu (Tanzania) Gaga (Chad) Hagadera (Kenya)
Lugufu II (Tanzania) Goz Amer (Chad) Dagahaley (Kenya)
Lukole (Tanzania) Kounoungou (Chad)
Mtabila(Tanzania) Yaroungou (Chad)
Nyarugusu (Tanzania) Bonga (Ethiopia)
Nduta (Tanzania) Kebribeyah (Ethiopia)
Kyaka II (Uganda) Kakuma (Kenya)
Kyangwali (Uganda)
Very Low (<.25%)
Nakivale (Uganda)
Amboko Chad) Dosseye (Chad) Dosseye (Chad) Kilo 26 (Sudan)
Kiziba (Rwanda) Bredjing (Chad) Ifo (Kenya) Wad Sharifey (Sudan)
Fugnido (Ethiopia)
Sherkole (Ethiopia)
Kanembwa (Kenya)
Medium
(0.25 49%)
Nyabiheke (Rwanda)
Oruchinga (Uganda) Gihembe (Rwanda) Awbarre (Ethiopia) Girba (Sudan)
High (0.5-0.9%)
Shagarab I II III (Sudan)
Kiryandongo (Uganda) Suki (Sudan) Abuda (Sudan)
Ikafe (Uganda) Fau 5 (Sudan)
Very High (>1%)
Um Gargour (Sudan)
Note: TFP enrollment categories for camps excluded from the SFP analysis were as follows: Low Adjumani and Palorinya (Uganda); Medium Kanembwa
(Uganda); Very High Ikafe (Uganda). SFP enrollment categories for camps excluded from the TFP analysis were as follows:Low Mtabila II, Nduta, and
Kanembwa (Tanzania); Khudunabari, Beldangi II Ext, Timai, and Goldhap (Nepal); Kyangwali and Madi Okollo (Uganda); Dimma (Ethiopia), and Kouankan II
(Guinea); Medium Beldangi I & II and Sanishare (Nepal); Amnaba, Gondje, Treguine, and Gaga (Chad), and Bonga (Ethiopia); High Oure Cassoni (Chad);
and Very High Ali Adde (Djibouti) and Shimelba (Ethiopia).
13
Table 3: SFP Indicators and Program Performance by Region
Africa Asia
SFP Indicator Type Standard
Mean Median Range Mean Median Range
Total Admissions
(January 2007-May 2009)
Process NA 48,630 3,467
Length of Stay
Outcome < 8 weeks 12.2 8.3 0-132 22.1 12 0-151
Recovery Rate
Outcome >75% 87.2% 97.0% 8-100% 81.8% 100% 3-100%
Death Rate
Outcome <3% 0.5% 0 0-33% 0.8% 0 0-50%
Default Rate
Outcome < 15% 7.0% 0 0-85% 2.6% 0 0-60%
14
Table 4. Beneficiary population and TFP feeding program admissions by year, region, country, and admission type
Therapeutic Feeding Program
Under Five
Population
Admissions (# admitted monthly) Total Enrollment (# enrolled monthly)
Average % of total
Average
new
admissions
% of new
admissions
Admission
Rate (per
1000/yr)
Odds of Admission
(CI)*
Average
Enrollment
% of
Children
Enrolled Enrollment Odds (CI)
Severe Acute
Malnutrition
Prevalence **
By Year
2007 185,613 33.6% 2,144 49.7% 8 2.24 (2.07-2.43) 320 0.2% 2.22 (1.81-2.73)
2008 189,858 34.3% 1,789 41.5% 6 1.83 (1.69-1.98) 258 0.1% 1.74 (1.41-2.16)
2009* 177,340 32.1% 383 8.9% 5 Reference 138 0.1% Reference
By Region
Africa 180,528 90.2% 321 91.7% 21 Reference 371 0.2% Reference
Chad 32,561 16.3% 102 29.1% 46 2.25 (1.30-3.99) 70 0.2% 1.02 (0.77-1.32)
0.8%
Ethiopia 16,362 8.2% 32 9.1% 23 1.09 (0.57-2.09) 45 0.3% 1.31 (0.93-1.79)
0.7%
Kenya 35,368 17.7% 95 27.1% 35 1.69 (0.95-3.08) 71 0.2% 1.07 (0.83-1.37)
1.3%
Rwanda 9,571 4.8% 18 5.1% 25 1.19 (0.64-2.26) 40 0.5% 2.35 (1.69-3.19)
1.7%
Sudan 8,888 4.4% 28 8.0% 52 2.56 (1.59-4.50) 69 1.6% 7.77 (6.35-9.49)
2.0%
Tanzania 49,746 24.9% 21 6.0% 7 0.33 (0.12-0.81) 32 0.1% 0.39 (0.27-0.54)
0.1%
Uganda 28,032 14.0% 25 7.1% 14 0.66 (0.31-1.37) 44 0.3% 1.62 (1.27-2.03)
2.6%
Asia 19,571 9.8% 30 8.6% 26 Reference 20 0.2% Reference
Bangladesh 5,050 2.5% 16 4.6% 37 1.44 (0.84-2.49) 10 0.4% 2.11 (1.14-3.79)
0.3%
Thailand 14,521 7.3% 14 4.0% 13 0.49 (0.23-1.00) 10 0.1% 0.50 (0.24-0.96)
0.1%
By Type
Acute wasting
3,372 78.1% 17 3.62 (3.36-3.89) 230 0.1% 1.27 (1.04-1.55)
Oedema
944 21.9% 5 Reference 181 0.1% Reference
OVERALL 200,099 100% 351 100.0% 22 391 0.2%
*Includes only January thru May 2009.
**Prevalence as reported in UNHCR 2008 Public Health Factsheets.
15
Table 5: TFP Indicators and Program Performance for Acute Wasting by Region
Africa Asia
TFP Indicator Type Standard
Mean Median Range Mean Median Range
Total acute wasting admissions
(January 2007-May 2009)
Process N/A 3,171 201
Length of Stay
Outcome < 30 days 27.2 22.7 0-600 29.9 28.9 4-82
Weight gain
Outcome >8 g/kg/day 7.5 7.7 0-32 7.0 5 0-46
Recovery Rate
Outcome >75% 78.9% 100% 0-100% 66.3% 83% 0-100%
Death Rate
Outcome <10% 4.6% 0% 0-100% 5.9% 0% 0-100%
Default Rate
Outcome < 15% 7.3% 0% 0-100% 9.0% 0% 0-100%
Table 6: TFP Indicators and Program Performance for Oedema by Region
Africa Asia
TFP Indicator Type Standard
Mean Median Range Mean Median Range
Total oedema admissions
(January 2007-May 2009) Process N/A 938 6
Length of Stay
Outcome < 30 days 27.2 23.5 0-352 21.7 25 14-26
Weight gain
Outcome >8 g/kg/day 12.0 8 0-368 20.7 6 16953
Recovery Rate
Outcome >75% 78.4% 100% 0-100% 50.0% 50% 6-50
Death Rate
Outcome <10% 5.7% 0% 0-100% 16.6% 0% 0-100%
Default Rate
Outcome < 15% 3.7% 0% 0-100% 0% 0% 0%
16
Endnotes
a
In the case of Sudan, country-level analysis refers only to the post-emergency camps in East Sudan.
b
UNHCR has since transitioned to the use of the 2006 WHO International Reference Population for many
of its programs.
References
[1] UNHCR. Figures at Glance, 2007-2009. URL: accessed
January 21, 2010.
[2] Tuekper A and Chunhei C. Evaluating integrated healthcare for refugees and hosts in an African
context. Journal of Health Economics, Policy and Law. 2009. 4:159-78.
[3] Spiegel P, Checchi F, Colombo S and Palk E. Health-care needs of people affected by conflict: future
trends and changing frameworks. Lancet 2010. 375, 9711: 341-345.
[4] Salama P, Spiegel P, Talley L and Waldman R. Lessons learned from complex emergencies over the
past decade. Lancet 2004; 364:1801-13.
[5] Spiegel P, Sheik M, Gotway-Crawford C, Salama P. Health programs and policies associated with
decreased mortality in displaced persons in post-emergency phase camps: a retrospective study. Lancet
2002; 360:1927-364.
[6] Hynes M, Sheikh M, Wilson HG, and Spiegel P. Reproductive Health Indicators and Outcomes Among
Refugee and Internally Displaced Persons in Postemergency Phase Camps. Journal of the American
Medical Association, 2002. 288:595-603
[7] Pelletier DL, Frongillo EA jr, Schroeder DG, Habicht JP. The effects of malnutrition on child mortality
in developing countries. Bull World Health Organ 1995; 73(4): 443-8.
[8] Toole MJ, Nieburg P, Waldman R. The association between inadequate rations, undernutrition
prevalence, and mortality in refugee camps: case studies of refugee populations in eastern Thailand,
1979-1980 and eastern Sudan, 1984-1985. J Trop Peiatr 1988; 34: 218-24.
[9] Spiegel PB, Salama P, Maloney S, van der Veen A. Quality of malnutrition assessment surveys
conducted during famine in Ethiopia. JAMA 2004; 292(5): 613-618.
[10] UNHCR. Health Information System Training Manual to Support Implementation in Refugee
Operations. UNHCR: Geneva. March 2007.
[11] UNHCR/UNICE/WFP/WHO. Food and Nutrition Needs in Emergencies. 2007.
[12] UNHCR. Guidelines for Interagency Health and Nutrition Evaluations in Humanitarian Crises.
UNHCR: Geneva. August 2007.
[13] UNHCR (2010). Health Information System (HIS) database.
[14] Kenya Joint Assessment Mission by WFP, UNHCR, UNICEF, NGOs and the Canadian International
Development Agency. November 2008. Nairobi.
[15] Skau J, Belachew T, Girma T, et. al. (2009) Outcome evaluation study of the Targeted Supplementary
Food program in Ethiopia. World Food Programme, Ethiopia.
[16] Brown K, et. al. (2009) Management of Children with Acute Malnutrition in Resource-Poor Settings.
National Review of Endocrinology. 5: 597-603.
[17] Collins S, Sadler. K. (2002) Outpatient care for severely malnourished children in emergency relief
programmes: a retrospective cohort study. Lance; 360: 1824–30.
[18] UNHCR.(2008) Programme Overview Factsheets: Refugee Public Health. UNHCR: Geneva, 2009.
[19] Black RE, Morris SS, Bryce J. Where and why are 10 million children dying every year? Lancet
2003; 361: 2226-34.
[20] Pelletier DL (1994) The relationship between child anthropometry and mortality in developing
countries: implications for policy, programs and future research. Journal of Nutrition, 124:S2047–
2081.
[21] Fishman S, Caulfield LE, de Onis M, et al. Childhood and maternal underweight. In: Ezzati M, Lopez
AD, Rodgers A, Murray CJL, eds. (2004). Comparative quantification of health risks: global and
regional burden of disease attributable to selected major risk factors. WHO: Geneva.
17
[22] WHO. (2000). The Management of Malnutrition in Emergencies. WHO: Geneva.
[23] Jentes E and Ahmed J. Health Information System Assessment for the United Nations High
Commissioner of Refugees in Kenya. CDC: Atlanta. October 2009.
[24] Williams, HA and Townes, D. Health Information System Assessment for UNHCR in Ethiopia. CDC:
Atlanta. November 2008.
Figure Legends
Figure 1. Average under five refugee population by country, 2007 to mid-year 2009.
Figure 2: Average Feeding Program Enrollment by Camp.
Figure 3: Global Acute Malnutrition Rates and Supplementary Feeding Program
Enrollment. *MAM prevalence was calculated as the difference between GAM and SAM prevalence from
2008 surveys reported in UNHCR Nutrition Survey database or most recent year where 2008 data not
available; all prevalence data measured using WHO growth standards except for Gasorwe and Musasa
(Burundi), Awbarre and Kebribeyah (Ethiopia), Wad Sharifey (Sudan), and Basteen and Kharaz (Yemen)
which only reported GAM and SAM prevalence using NCHS growth standards. Note: GAM and SAM
prevalence were measured across multiple camps in a joint survey in Amboko & Gondje (Chad);
Adjumani, Impevi, Kiryandongo, Palorinya & Rhino (Uganda) and Kyaka, Kyangwali, Nakivale, &
Oruchinga (Uganda).
Figure 4: Severe Acute Malnutrition Rates and Supplementary Feeding Program
Enrollment * SAM prevalence from 2008 surveys reported in UNHCR Nutrition Survey database or most
recent year where 2008 data not available; all prevalence data measured using WHO growth standards
except for Awbarre, Kebribeyah, Shimelba (Ethiopia) and Wad Sharifey (Sudan) which only reported SAM
prevalence using NCHS growth standards. Note: SAM prevalence was measured across multiple camps in
a joint survey in Amboko & Gondje (Chad); Adjumani, Impevi, Kiryandongo, Palorinya & Rhino (Uganda)
and Kyaka, Kyangwali, Nakivale, & Oruchinga (Uganda)
11
"
"
Figur e 1. Aver age under five refugee population by country, 2007 to mid-year 2009
Figure 1
17
"
"
Figur e 2: Average Feeding Progr am Enrollment by Camp
Figure 2
18
"
"
Figur e 3: Global Acute Malnutrition Rates and Supplementary Feeding Pr ogr am
Enr ollment
*MAM prevalence was calculated as the difference between GAM and SAM prevalence from 2008 surveys reported in
UNHCR Nutrition Survey database or most recent year where 2008 data not available; all prevalence data measured
using WHO growth standards except for Gasorwe and Musasa (Burundi), Awbarre and Kebribeyah (Ethiopia), Wad
Sharifey (Sudan), and Basteen and Kharaz (Yemen) which only reported GAM and SAM prevalence using NCHS
growth standards. Note: GAM and SAM prevalence were measured across multiple camps in a joint survey in Amboko
& Gondje (Chad); Adjumani, Impevi, Kiryandongo, Palorinya & Rhino (Uganda) and Kyaka, Kyangwali, Nakivale, &
Oruchinga (Uganda).
Figure 3
19
"
"
Figur e 4: Severe Acute Malnutr ition Rates and Supplementary Feeding Pr ogram
Enr ollment
* SAM prevalence from 2008 surveys reported in UNHCR Nutrition Survey database or most recent year where 2008 data not
available; all prevalence data measured using WHO growth standards except for Awbarre, Kebribeyah, Shimelba (Ethiopia) and Wad
Sharifey (Sudan) which only reported SAM prevalence using NCHS growth standards. Note: SAM prevalence was measured across
multiple camps in a joint survey in Amboko & Gondje (Chad); Adjumani, Impevi, Kiryandongo, Palorinya & Rhino (Uganda) and
Kyaka, Kyangwali, Nakivale, & Oruchinga (Uganda)
Figure 4