Báo cáo y học: "Research Saturation Behavior: a general relationship described by a simple second-order differential equation" ppt
Bạn đang xem bản rút gọn của tài liệu. Xem và tải ngay bản đầy đủ của tài liệu tại đây (2.07 MB, 13 trang )
© 2010 Kepner; licensee BioMed Central Ltd. This is an Open Access article distributed under the terms of the Creative Commons Attri-
bution License ( which permits unrestricted use, distribution, and reproduction in any me-
dium, provided the original work is properly cited.
Kepner Theoretical Biology and Medical Modelling 2010, 7:11
/>Open Access
RESEARCH
Research
Saturation Behavior: a general relationship
described by a simple second-order differential
equation
Gordon R Kepner
Abstract
Background: The numerous natural phenomena that exhibit saturation behavior, e.g.,
ligand binding and enzyme kinetics, have been approached, to date, via empirical and
particular analyses. This paper presents a mechanism-free, and assumption-free, second-
order differential equation, designed only to describe a typical relationship between the
variables governing these phenomena. It develops a mathematical model for this relation,
based solely on the analysis of the typical experimental data plot and its saturation
characteristics. Its utility complements the traditional empirical approaches.
Results: For the general saturation curve, described in terms of its independent (x) and
dependent (y) variables, a second-order differential equation is obtained that applies to any
saturation phenomena. It shows that the driving factor for the basic saturation behavior is
the probability of the interactive site being free, which is described quantitatively. Solving
the equation relates the variables in terms of the two empirical constants common to all
these phenomena, the initial slope of the data plot and the limiting value at saturation. A
first-order differential equation for the slope emerged that led to the concept of the
effective binding rate at the active site and its dependence on the calculable probability
the interactive site is free. These results are illustrated using specific cases, including ligand
binding and enzyme kinetics. This leads to a revised understanding of how to interpret the
empirical constants, in terms of the variables pertinent to the phenomenon under study.
Conclusions: The second-order differential equation revealed the basic underlying
relations that describe these saturation phenomena, and the basic mathematical
properties of the standard experimental data plot. It was shown how to integrate this
differential equation, and define the common basic properties of these phenomena. The
results regarding the importance of the slope and the new perspectives on the empirical
constants governing the behavior of these phenomena led to an alternative perspective
on saturation behavior kinetics. Their essential commonality was revealed by this analysis,
based on the second-order differential equation.
Background
This paper answers the question: is there a general mathematical model common to the
numerous natural phenomena that display identical saturation behavior? Examples include
ligand binding, enzyme kinetics, facilitated diffusion, predator-prey behavior, bacterial cul-
ture growth rate, infection transmission, surface adsorption, and many more. The mathe-
matical model developed here is based on a general second-order differential equation
* Correspondence:
1
Membrane Studies Project, PO
Box 14180, Minneapolis, MN
55414, USA
Full list of author information is
available at the end of the article
Kepner Theoretical Biology and Medical Modelling 2010, 7:11
/>Page 2 of 13
(D.E.), free of empirical constants, that describes the basic relation underlying these sat-
uration phenomena [1].
A common and productive way to analyze a specific saturation phenomenon uses a
model for the proposed mechanism. This leads to an algebraic relation that describes the
experimental observations, and helps interpret features of the mechanism. Where the phe-
nomenon involves chemical reactions, for example, the models rely on assumptions about
reaction mechanisms, dissociation constants, and mass action rate constants [2-7]. Note
that such mechanisms cannot be proved definitively by standard kinetic studies [8].
In view of the ubiquity of saturation phenomena, it seems useful to seek one mathe-
matical model that describes all such phenomena. The model presented here relies solely
on the basic mathematical properties of the experimentally observed data plot for these
phenomena the independent variable versus the dependent variable. It is free of mecha-
nism and therefore applies uniformly to all these phenomena. The analysis starts with a
second-order differential equation, free of constants, that offers a general way of describ-
ing them. This equation is then integrated and applied to illustrative examples.
Results
Basic saturation behavior case
The general nature of the initial extensive mathematical analysis suggests using familiar
mathematical symbols x, y, dy, dx, dy/dx, d
2
y/dx
2
, etc instead of using the symbols
and notation particular to a specific saturation phenomenon, such as ligand binding
where x would be A (free ligand), and y would be A
b
(bound ligand). One can then substi-
tute any phenomenon's particular symbols into the key equations.
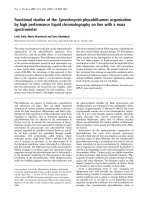
A typical experimental data plot for these natural phenomena that exhibit saturation
behavior is shown in Figure 1. Its essential feature is that each successive incremental
increase, dx, in x is less effective at increasing dy. At very large values of x (saturation),
the plot approaches its limiting value, the asymptote. As x increases: the fractional
changes (dx/x and dy/y) decrease; the slope (dy/dx) is positive, steadily decreasing, and
continuous; the second derivative (d
2
y/dx
2
) is steadily decreasing, and negative because
the tangent at P is above the curve. Thus, (d
2
y/dx
2
) = -|d
2
y/dx
2
|.
The following generalized D.E. leads to many different mathematical relations,
depending on the particular integer values of N and M. These describe, collectively,
numerous natural phenomena.
Note that each term takes the fractional change form. It will be shown here, for N = M
= 2, that this yields the second-order D.E., free of empirical constants, that gives the
mathematical relation y = a·x/(b +x). This relation describes the saturation plot of Figure
1. Integration and analysis then lead to the definitions of the basic empirical constants
that describe all saturation plots. Setting κ = dy/dx = slope gives
where dκ/κ is the fractional change in the slope.
(/)
(/)
d y dx dx
dy dx
N
dy
y
M
dx
x
22
⋅
=⋅
⎛
⎝
⎜
⎞
⎠
⎟
−⋅
⎛
⎝
⎜
⎞
⎠
⎟
(1)
ddy
y
dx
x
k
k
=⋅ −
⎛
⎝
⎜
⎞
⎠
⎟
2
(2)
Kepner Theoretical Biology and Medical Modelling 2010, 7:11
/>Page 3 of 13
Integrating and taking anti-logarithms gives the first-order D.E. for the slope,
Integrating again and rearranging gives
This algebraic relation, when substituted into equation (1), satisfies the second-order
D.E. Therefore, it is a general solution. The system constants are determined by forcing
the general solution to fit the physical boundary conditions (x → 0 and x → ∞), giving a
unique solution.
Evaluate C
1
and C
2
using equation (4). Let x → 0, so that C
1
>>C
2
·x, and therefore
k
==⋅
⎛
⎝
⎜
⎞
⎠
⎟
dy
dx
C
y
x
1
2
(3)
y
x
CCx
=
+⋅
12
(4)
1
1
0
0
0
C
y
x
dy
dx
=
⎛
⎝
⎜
⎞
⎠
⎟
=≡=
⎛
⎝
⎜
⎞
⎠
⎟
→x
Initial Slope
k
(5)
Figure 1 Typical idealized experimental data plot for those natural phenomena showing saturation
behavior. The black dashed line is the initial slope, (dy/dx)
0
, and the red dashed line is the tangent at point P,
(dy/dx)
P
.
Kepner Theoretical Biology and Medical Modelling 2010, 7:11
/>Page 4 of 13
Rearranging so y = 1/[(C
1
/x) + C
2
], let x → ∞, then C
2
= 1/y
∞
= 1/Υ
sat
, where Υ
sat
is the
limiting value as y approaches the asymptote (saturation). Thus
This equation defines the roles of the two directly measurable and independent empir-
ical constants of the experimental system, κ
0
and
sat
. Rearranging equation (6) gives
the general form of the standard algebraic relation used to describe the data plot in Fig-
ure 1, [2-7,9-12].
These saturation phenomena are typified by the binding of a substance (e.g., a ligand or
substrate) to a binding site. This can be analyzed in terms of random interactions
between x and the binding site. In general, y
x
/Υ
sat
= Γ
bd
, the fraction bound, which can be
equated to the probability the site is occupied, for a given value of x. Thus Γ
bd
= x/(K + x)
= κ
0
·x/[Y
sat
+ (κ
0
·x)]. The probability the site is free is Γ
fr
= 1 - Γ
bd
, so
Thus, as x → 0, Γ
fr
→ 1, and as x → ∞, Γ
fr
→ 0.
Define Δ to mean the change in. Then the (change in slope)/(slope) equals Δ (dy/dx)/
(dy/dx). Let Δ (dy/dx) = (1/2)·(d
2
y/dx
2
)·dx. The average slope is (y/x). Thus, Δ (y/x) = d
(y/x), where d (y/x)/(y/x) = (dy/y) - (dx/x). Rearranging equation (1) with N = M = 2, and
substituting equations (7) and (8) into it, yields
Thus, the change in the slope (dy/dx) divided by the change in the average slope (y/x) is
determined by Γ
fr
.
Substituting into equation (3) for the slope gives
Ligand binding
Consider a small molecule, the ligand, that is present in either the free form, A, or the
bound form, A
b
. For the simplest case, assume that each ligand binds to a single specific
binding site (bs). This could be on a macromolecule, M
bs
, such as a protein. These sites
are presumed to be independent and to have the same binding constant. The details of
the experimental conditions required for these binding studies are found in standard ref-
erence texts [2,5,7,9-12].
y
x
Y
x
=
+⋅
1
0
1
k
sat
(6)
y
Yx
Kx
=
⋅
+
sat
(7)
Γ
fr
sat
sat
=
+
=
+⋅
K
Kx
Y
Yx[]
k
0
(8)
Δ
Δ
Γ
(/)
(/)
dy dx
yx
=
fr
(9)
dy
dx
y
x
⎛
⎝
⎜
⎞
⎠
⎟
== ⋅
⎛
⎝
⎜
⎞
⎠
⎟
=⋅
x
xfrx
k
k
k
1
0
2
0
2
()Γ
(10)
Υ
Kepner Theoretical Biology and Medical Modelling 2010, 7:11
/>Page 5 of 13
The basic overall binding reaction is defined to be
The necessary and sufficient condition for this analysis is the experimental data plot of
A
b
versus A. In Figure 1, set y = A
b
and x = A. Then substitute into the key equations, for
example, equation (6).
The total number of binding sites in the experimental system (M
bs
, A, A
b
) is (A
b
)
sat
. It is
the limiting amount of ligand binding observed at saturation with A. The initial slope is
κ
0
, the system's limiting binding rate when A → 0, and Γ
fr
→ 1. Thus, (A
b
)
sat
and κ
0
are the
empirical constants of the ligand binding system. The conventional models of the bind-
ing mechanism identify K
d
as the dissociation constant in mol L
-1
[2,5,6,10-12]. Equation
(11) is often referred to as the Langmuir adsorption isotherm, or the Hill binding equa-
tion. It is sometimes written using the binding fraction, Γ
bd
= A
b
/(A
b
)
sat
.
The units of κ
0
= k
bind
·(A
b
)
sat
, where k
bind
= 1/K
d
, are
Thus, k
bind
is the binding rate constant for one mole of binding sites evaluated at A →
0, where Γ
fr
→ 1. It characterizes the binding strength of the ligand for the binding site.
Therefore, a high value of k
bind
means a high value of the initial slope of the system, κ
0
,
and so the value of K
d
is decreased.
The complete expression for the units of κ
0
illustrates how descriptive information
could be lost when units are cancelled. Thus, the units [mol L
-1
of (dA
b
) bound/mol L
-1
of
(dA) added]
0
describe a useful aspect of the binding process the fraction of the added
(dA) that is bound [(dA
b
)/dA], as A → 0. Taken over one minute, this yields the binding
rate constant for one mole of binding sites.
The slope is given by
where Γ
fr
= (A
b
)
sat
/[(A
b
)
sat
+ (κ
0
·A)]. Thus, κ
A
is defined as the system's effective binding
rate at any value of A to distinguish it from the highest value of κ, when A → 0, giving
κ
0
, the system's limiting binding rate. Thus, if κ
0
is increased, then the ligand binding
increases and (Γ
fr
)
A
decreases, for a given value of A, because now more of the sites are
A
M
A mol L
mol L
mol L
-1
bs
-1
b
-1
⎯→⎯⎯⎯⎯⎯⎯
A
A
A
A
AA
KA
b
bsat
bsat
d
=
+⋅
=
⋅
+
1
0
1
k
()
()
(11)
k
0
=
⋅
[mol L
-1
of (
b
bound mol L
-1
of ( ) added]
0
min one m
dA dA)/
ool L
-1
of Binding Sites
mol L Binding sites present in ×
−
(
1
ssystem
fraction of added bound per
system’s lim
=
=
(min)
(
dA
0
iiting binding rate) min
0
1
=
−
dA
dA
A
A
bb
A
AfrA
2
⎛
⎝
⎜
⎞
⎠
⎟
=⋅
⎛
⎝
⎜
⎞
⎠
⎟
==⋅
1
0
2
0
k
kk
()Γ
(12)
Kepner Theoretical Biology and Medical Modelling 2010, 7:11
/>Page 6 of 13
occupied at A. If (A
b
)
sat
is doubled, for example, Γ
fr
will be increased but not proportion-
ately, see equation (11).
Knowing the value of κ
0
, obtained from experimental data, one can calculate Γ
fr
for any
A. Also, , using equation (12), which shows how the slope depends on (1/
A
2
). The values of κ
0
and (A
b
)
sat
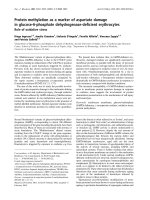
can be obtained directly by using a standard linear transfor-
mation of the data plot, see the enzyme kinetics case, equation (19). This gives a plot of (A/
A
b
) versus A, with a slope of 1/(A
b
)
sat
, and ordinate intercept of 1/κ
0
, see Figure 2.
Other examples
The term, binding site, is used for convenience as a general way of identifying the inter-
active locus of many saturation phenomena. For example: ligand binds to a macromole-
cule; a nutrient molecule binds to a receptor on a bacterial membrane and is transported
inside; a prey is bound to a predator's jaws; a substrate binds to an enzyme's catalytic site;
a molecule is adsorbed at sites on a surface (Langmuir's adsorption). Some saturation
phenomena are less well-suited to this binding site characterization e.g., the stock-
recruitment model for producing new fish biomass from spawning stock [13].
kk
AfrA
2
=⋅
0
()Γ
Figure 2 Typical plot of idealized experimental data to facilitate calculation of the empirical constants,
(A
b
)
sat
and κ
0
.
Kepner Theoretical Biology and Medical Modelling 2010, 7:11
/>Page 7 of 13
The simplest case of bacterial growth in a chemostat shows saturation dependence on
the available nutrient [14,15]. Thus, dr/dA = κ
A
= (1/κ
0
)·(r/A)
2
= , so
where r is the experimentally measured bacterial growth rate (g·L
-1
min
-1
), at a given
concentration of nutrient, A(g·L
-1
). R
sat
is the limiting growth rate at saturation with
nutrient (g·L
-1
min
-1
). So, K = R
sat
/κ
0
in g·L
-1
, where the initial slope is κ
0
(grams
bacteria·L
-1
min
-1
/grams nutrient·L
-1
), evaluated at A → 0. It measures the effectiveness
of the specific bacteria's ability to convert a specific nutrient to bacterial growth when
all the receptor sites on the bacterial membrane are available. Thus, different bacteria
using the same nutrient would have different values of κ
0
, reflecting the relative effective-
ness of nutrient binding to the different receptor sites.
Consider predator-prey behavior in the simple case of the functional response model,
where the attack rate increases, but at a decreasing rate with increased prey density [15-
18]. Here, dn/dA = κ
A
= (1/κ
0
)·(n/A)
2
= , so
where n is the number of prey attacked over unit time by the predators present, and
N
sat
is the limiting rate of attack at saturation with prey. Set A equal to the prey density
(e.g., number of prey per square kilometer). Then K = N
sat
/κ
0
, where the initial slope, κ
0
,
measures the effectiveness of the predator attacking the prey, as A → 0. Thus, a predator
attacking two different prey yields different values of κ
0
.
Michaelis-Menten (M-M) enzyme kinetics
The basic overall enzymatic reaction is the conversion of one substrate molecule, A, to
one product molecule, P, by an enzyme molecule, E, that catalyzes this conversion at its
catalytic site (cs).
The necessary and sufficient condition for this analysis is the experimental data plot of
(dP/dt) = p, versus A. See Figure 1, where p = y and A = x. The experimental conditions
required for measuring p and A are described in standard reference texts [2-4,7,9-12].
The use here of p, instead of the conventional v, focuses attention on the actual mea-
sured quantity and how it relates to A, in terms of dp/dA and d
2
p/dA
2
.
Equation (9) becomes Δ (dp/dA)/Δ (p/A) = Γ
fr
, and equation (1) gives
k
0
2
⋅Γ
fr
r
RA
KA
R
A
=
⋅
+
=
+⋅
sat
sat
1
1
0
1
k
(13a)
k
0
2
⋅Γ
fr
n
NA
KA
N
A
=
⋅
+
=
+⋅
sat
sat
1
1
0
1
k
(13b)
A
E
P mol L
mol L
mol L
-1
cs
−
−
⎯→⎯⎯⎯⎯⎯⎯
1
1
1
2
22
⋅
⋅
=−
(/ )
(/)
d p dA dp
dp dA
dp
p
dA
A
(14)
Kepner Theoretical Biology and Medical Modelling 2010, 7:11
/>Page 8 of 13
Thus, the slope at any point, A, is κ
A
= κ
0
·(Γ
fr
)
2
, where, from equation (8), Γ
fr
= P
sat
/[P
sat
+ (κ
0
·A)]. Note that κ
A
equals [(dA)converted/(dA)added]
A
= (dp/dA)
A
. This could be
viewed as a measure of how effectively the system is converting substrate to product at
A. It decreases rapidly as (1/A
2
).
Equation (6) becomes
The initial slope is κ
0
, and P
sat
is the limiting rate of enzyme catalysis when saturated
with A. Increasing κ
0
will increase the binding of A to the catalytic site. These are the two
independent empirical constants of the experimental system (E
t
, A, P). Equating (P
sat
/κ
0
)
to K
m
, the Michaelis constant, and with p = v, and P
sat
= V, gives
the standard form for the M-M equation of enzyme kinetics.
Note that P
sat
≡ k
cat
·E
t
, where E
t
is the total enzyme concentration present experimen-
tally, which may not be known. The catalytic constant, k
cat
, is the limiting catalytic rate at
which one mole of enzyme molecule could operate if completely saturated with sub-
strate. Similarly, κ
0
≡ k
bind
·E
t
, where k
bind
is here defined to be the binding rate constant of
the substrate for the catalytic sites on one mole of enzyme (min
-1
mol
-1
) evaluated
when A → 0, where the catalytic site is maximally available, because Γ
fr
→ 1.
Equation (8) can be rewritten to give
Thus, if k
bind
is increased, Γ
fr
is decreased, because there are fewer free sites available at
a given value of A. Whereas, if k
cat
is increased, Γ
fr
is increased. The increased turnover
rate means more free sites are available at a given value of A. As expected, Γ
fr
is indepen-
dent of E
t
, because Γ
fr
depends only on the basic properties of the enzyme's catalytic
function, k
bind
and k
cat
.
Enzyme kinetics differs from ligand binding because there is also a conversion step.
The binding step is much faster than the conversion step, where the catalytic site con-
verts the bound substrate to product and releases it. This is commonly assumed to
involve a simple 1:1 stoichiometric relation between substrate bound and product
released [19]. The binding rate constant for one mole of enzyme is defined here to be =
κ
0
/E
t
= k
cat
/K
m
. The ratio, k
cat
/K
m
, is often referred to as the specificity constant [19,20].
Thus, k
bind
indicates the strength of the mutual interaction between a specific substrate
and a specific enzyme, at the catalytic site, measured when A → 0. It defines a collective
property for each particular combination of substrate and enzyme. For example, let A
and E
cs
→ k
bind
, while A' and E'
cs
→ k'
bind
, where k
bind
most probably differs from k'
bind
, but
p
A
P
A
=
+⋅
1
0
1
k
sat
(15)
v
VA
KA
=
⋅
+
m
(16)
Γ
fr
sat
bind
cat
=
+
⎛
⎝
⎜
⎞
⎠
⎟
⋅
=
+
⎛
⎝
⎜
⎞
⎠
⎟
⋅
1
1
0
1
1
k
P
A
k
k
A
(17)
Kepner Theoretical Biology and Medical Modelling 2010, 7:11
/>Page 9 of 13
might not. Therefore, the higher the value of k
bind
, the more effectively does the substrate
bind to the enzyme's catalytic site. The enzyme and substrate, taken together, perform
better at higher values of k
bind
[20].
Thus, k
bind
and k
cat
can be considered the basic properties of this single enzyme mole-
cule's catalytic function. So
Therefore, K
m
is defined by the ratio of the experimental system's empirical constants,
which depend on the enzyme's basic properties. When E
t
is known, one can obtain val-
ues for k
cat
and k
bind
. Whereas, although P
sat
and κ
0
often are measured experimentally
where E
t
is not known, their ratio still gives K
m
. Doubling E
t
will double both P
sat
and κ
0
,
so the ratio, K
m
, remains unchanged.
For clarity and convenience, the definitions and units of the various constants are
explicitly stated here.
PkE
kE
k
k
sat
0
cat t
bind t
cat sat
bind
system
k
⎛
⎝
⎜
⎞
⎠
⎟
=
⋅
⋅
=
⎡
⎣
⎢
⎤
⎦
⎥
()
()
0
eenzyme molecule
m
= K
(18)
()
min
Aystem
A
mol L
-1
increase in Product
mol
s
dp
dA
=
⎛
⎝
⎜
⎞
⎠
⎟
=
−1
L
-1
increase in Substrate
the system’s effect
A
⎛
⎝
⎜
⎜
⎞
⎠
⎟
⎟
= (iive conversion rate of substrate to product
A
)
k
E
bind
t
(mol L
-1
of Product produced)
(mol L
-1
of Subs
=
=
0
0
ttrate added )
0
min one mol L of Enzyme)
binding rate c
-1
÷⋅
=
(
oonstant one mole enzyme
()
0
/.
()
0ystem bind t
mol L
-1
min
-1
increase in P
s
dp
dA
kE=
⎛
⎝
⎜
⎞
⎠
⎟
=⋅
=
0
rroduct
mol L
-1
increase in Substrate
the system
0
⎛
⎝
⎜
⎜
⎞
⎠
⎟
⎟
= ’ss limiting binding rate
()
0
.
k
P
E
cat
sat
t
limiting mol L
-1
min
-1
of Product
one mol L
-1
of
=
=
Enzyme
limiting rate of catalysis one m
sat
sat
⎛
⎝
⎜
⎜
⎞
⎠
⎟
⎟
=
()
/oole enzyme.
k
k
k
Kepner Theoretical Biology and Medical Modelling 2010, 7:11
/>Page 10 of 13
There are various standard linear transformations of equations (15) and (16) that aid in
the initial analysis of the data plot in Figure 1, [4-6]. Equation (19) is one.
This gives a linear plot of (A/p) versus A. The slope is (1/P
sat
) and the ordinate inter-
cept is (1/κ
0
), recall Figure 2. This provides direct evaluation of the system's empirical
constants, κ
0
, and P
sat
, from the experimental data. Using C
1
= 1/κ
0
, obtained from equa-
tion (19), one can calculate κ
A
, at any value of A, using the equation for κ
A
.
Discussion
Basic case
The mathematical model presented here is based solely on the observed experimental
data plot for these phenomena, as shown in Figure 1. This analysis of the second-order
D.E. offers an alternative approach, free of mechanism, that describes the common pro-
cess underlying all natural phenomena exhibiting saturation behavior. It provides a gen-
eral mathematical description of these phenomena. The D.E. approach takes a path of
discovery that reveals the salient features of these phenomena on the way to reaching y =
x/[(1/κ
0
) + (1/Y
sat
)·x]. It complements approaches that model each specific saturation
phenomenon separately, in terms of a proposed mechanism.
The D.E. analysis provided two general integration constants, C
1
and C
2
, evaluated at
the known boundary conditions, x → 0 and x → ∞. This gave the two empirical con-
stants, κ
0
and Y
sat
, that defined the relation between the variables of any saturation phe-
nomenon see equation (6), the general algebraic description of these saturation
phenomena. The empirical constant, κ
0
, the initial slope, and its practical significance,
have not been recognized previously.
Applying the quantitative relation for Γ
fr
clarified the functioning of the interactive site.
It showed that the underlying relation describing these phenomena, equation (1),
became Δ(dy/dx)/Δ(y/x) = Γ
fr
, see equation (9). The slope, equation (3), became κ =
κ
0
·(Γ
fr
)
2
. Its strong dependence on (1/x
2
) was shown. As x increases, each added incre-
ment, dx, sees a lower Γ
fr
, because a greater fraction of the sites are occupied at the
instant of adding dx. This leaves fewer sites free to attend to the conversion of this addi-
tional dx. This behavior is the essence of how these saturation phenomena function in
response to increased x.
()
(min
PkE
tsat system cat
-1
sa
limiting mol L of Product)
=⋅
=
−1
tt
sat
the system s limiting rate of catalysis=
()
’.
K
Pk
k
A
m
-1
M
sat
0
cat
bind
mol L
Michaelis concentration [19
== =
=≡
k
]].
the ratio of the system s empirical constants as def= ’,iined by the basic properties of
f
the enzyme s catalytic fu’nnction.
A
pP
A=⋅+
11
0sat
k
(19)
Kepner Theoretical Biology and Medical Modelling 2010, 7:11
/>Page 11 of 13
Ligand binding, bacterial growth, predator-prey
The response of these saturation phenomena to increased A is driven by Γ
fr
, see equa-
tions (9) and (10). The independent empirical constants for each phenomenon relate the
variables of each and define the K that characterizes each one, see equations (11), (13a)
and (13b). This mathematical model defines K, in general, as the ratio of the limiting
rate/initial slope. Figure 2 shows how to obtain their values from the data. Other applica-
tions of this general approach include surface adsorption, facilitated transport, and
transmission of infection. It emphasizes the utility of the initial slope, κ
0
.
Michaelis-Menten enzyme kinetics
Equation (10) shows that the slope, κ
A
, depends on (Γ
fr
)
2
and (1/A
2
). Thus, Γ
fr
drives the
experimental system's behavior and accounts, quantitatively, for the decrease in the slope
with increasing A. This leads to the concepts of:
the system's effective binding rate, for E
t
moles of enzyme, at A.
the binding rate constant for one mole of enzyme, at A → 0.
For E
t
moles, (dp/dA)
0
= κ
0
, and for one mole, (dp/dA)
0
/E
t
= κ
0
/E
t
= k
bind
. Note that κ
A
=
(dp/dA)
A
can be calculated using the equation for the slope and equation (19). Thus, the
(slope)
A
/(slope)
0
= (Γ
fr
)
2
, where Γ
fr
= P
sat
/[P
sat
+ (κ
0
·A)].
The D.E. analysis defined the two independent empirical constants of this experimen-
tal system as κ
0
and P
sat
. Equation (15) is the general algebraic relation for illustrating
their independent roles. Equation (18) ties together these empirical constants and the
basic properties, k
cat
and k
bind
, to relate them to K
m
. Thus, k
bind
and k
cat
, taken together,
can expand the ability to characterize and compare the interaction of enzymes and their
substrates.
The usual model for the M-M enzyme reaction mechanism defines K
m
as a constant
derived from the reaction rate constants. Such models are essential in pursuing the
details of a proposed mechanism for M-M enzyme reactions, or for any saturation phe-
nomenon. Yet, numerous different interpretations of what K
m
means have arisen in the
literature, based on the standard model and mechanism. Some examples include: param-
eter, kinetic constant, not an independent kinetic constant, empirical quantity, a con-
stant for the steady-state, measures affinity in the steady-state, should not be used as a
measure of substrate affinity, most useful fundamental constant of enzyme chemistry,
not a true equilibrium constant, dubious assertion that K
m
reflects an enzyme's affinity
for its substrate [2-12,21]. According to Riggs, "Notice that the Michaelis constant is not
a rate constant, nor an affinity constant, nor a dissociation constant, but is merely a con-
stant of convenience" [22]. The interpretation presented here, based on the mathemati-
cal model, is rooted in equation (18). It showed that K
m
= k
cat
/k
bind
, the ratio of the
enzyme's basic properties. Thus, this model viewed K
m
as a derived quantity, and not as
an independent basic property of the enzyme molecule's catalytic function.
The action of enzyme inhibitors offers additional perspective on interpreting K
m
= k
cat
/
k
bind
. Consider five basic cases of enzyme inhibition: Competitive, Uncompetitive, Pure
Non-Competitive, Predominantly Competitive, Predominantly Uncompetitive [19]. In
no case does the inhibitor (I) cause the limiting rate, P
sat
, or the initial slope, κ
0
, of
the observed data plot for the experimental system (E
t
, I, A, P) to increase. The value of
Kepner Theoretical Biology and Medical Modelling 2010, 7:11
/>Page 12 of 13
K
m
= k
cat
/k
bind
, however, is observed to increase, remain unchanged, or decrease
depending on the relative effects of the inhibitor on k
cat
and k
bind
. Any basic property of
an enzyme molecule's catalytic function should never increase in the presence of an
inhibitor. Thus, k
cat
and k
bind
meet this condition. Their ratio, k
cat
/k
bind
= K
m
, does not.
Therefore, K
m
is not one of the two basic properties. Changing from K
m
to A
M
, the
Michaelis concentration, would be consistent with this interpretation [19].
The ratio of these observable empirical constants, P
sat
/κ
0
, defines K
m
. Thus, the mathe-
matical analysis offers an operational definition of K
m
, independent of any interpreta-
tions [19]. This approach to defining K
m
is consistent with all the known factors.
"Definitions based on what is actually observed are therefore on a sounder and more
lasting basis than those that depend on an assumed mechanism" [19]. Numerous mecha-
nisms can generate M-M kinetics; "Consequently there is no general definition of any of
the kinetic parameters in terms of the rate constants for the elementary steps of a reac-
tion's mechanism" [19].
The algebraic relation, p = P
sat
·A/(K
m
+ A), describes the data plot of an enzyme kinetic
study. Its validity is independent of any mechanism. The mechanism-free approach
derives this algebraic relation directly from the second-order D.E. This general analysis
also reveals the underlying factors, such as Γ
fr
, that govern the basic behavior of these
saturation phenomena.
The enzyme's catalytic function involves two distinct processes, binding the substrate
and converting it to product. This mathematical analysis demonstrated that the two
empirical constants of the D.E., κ
0
= E
t
·k
bind
and P
sat
= E
t
·k
cat
, define these two processes
binding and catalysis in terms of the basic properties, k
bind
and k
cat
.
Conclusions
The results presented here are completely general and based entirely on a mathematical
model that analyzes the observed experimental data plot for the relation between the
independent and dependent variables. They apply directly to every natural phenomenon
displaying the characteristic saturation behavior that produces the hyperbolic kinetics
described by the relation, . The second-order
D.E. presented here reveals the basic underlying relation that applies to these phenom-
ena and its dependence on the probability a site is free. The analysis provides a theoreti-
cal basis for defining the empirical constants and basic properties of each saturation
phenomenon, based on the two constants of integration evaluated at the boundary con-
ditions. The universality of these saturation phenomena makes it useful to have the D.E.,
free of constants, that describes the basic properties of all these systems.
The first-order D.E. derived here introduces the concept of the effective binding rate. It
is directly related to the slope of the experimental data plot. The initial slope is where it is
highest, the binding rate constant of the ligand for the binding site. The analysis revealed
the significance of the initial slope as an independent empirical constant for these sys-
yx Yx YxKx=+
⎡
⎣
⎤
⎦
=+
−−
/ /()κ
0
11
sat sat
·
·
Kepner Theoretical Biology and Medical Modelling 2010, 7:11
/>Page 13 of 13
tems exhibiting saturation behavior, and its role in determining the probability that the
active site is free.
Competing interests
The author declares that he has no competing interests.
Author Details
Membrane Studies Project, PO Box 14180, Minneapolis, MN 55414, USA
References
1. Mellor J: Higher Mathematics for Students of Chemistry and Physics New York: Dover; 1955.
2. Bisswanger H: Enzyme Kinetics 2nd edition. Weinheim: Wiley-VCH; 2008.
3. Cook P, Cleland W: Enzyme Kinetics and Mechanism New York: Garland Science; 2007.
4. Cornish-Bowden A, Wharton C: Enzyme Kinetics Oxford: IRL Press; 1988.
5. Klotz I: Ligand-Receptor Energetics New York: Wiley; 1997.
6. Matthews J: Fundamentals of Receptor, Enzyme and Transport Kinetics London: CRC; 1993.
7. Purich D, Allison R: Handbook of Biochemical Kinetics New York: Academic Press; 2000.
8. Hammes G: Physical Chemistry for the Biological Sciences New York: Wiley-Interscience; 2007.
9. Bisswanger H: Practical Enzymology Weinheim: Wiley-VCH; 2004.
10. Gutfreund H: Kinetics for the Life Sciences Cambridge University Press; 1995.
11. Van Holde K, Johnson W, Ito P: Principles of Physical Biochemistry 2nd edition. New Jersey: Pearson/Prentice Hall; 2006.
12. Wilson K, Walker J: Practical Biochemistry 5th edition. Cambridge University Press; 2000.
13. Beverton R, Holt S: On the dynamics of exploited fish populations London: HMSO; 1959.
14. Monod J: La Technique de culture continue: theorie et applications. Ann Inst Pasteur 1950, 79:390-410.
15. Edelstein-Keshet L: Mathematical models in biology New York: Random House; 1988.
16. Holling CS: The components of predation as revealed by a study of small mammal predation of the European
pine saw fly. Can Entomol 1959, 91:293-320.
17. Real L: The kinetics of functional response. Am Naturalist 1977, 111:289-300.
18. Berryman A: The origin and evolution of predator-prey theory. Ecology 1992, 73:1530-1535.
19. International Union of Biochemistry: Symbolism and terminology in enzyme kinetics. Biochem J 1983,
213:561-571.
20. Koshland DE: The application and usefulness of the ratio k
cat
/K
(M)
. Bioorg Chem 2002, 30:211-213.
21. Netter H: Theoretical Biochemistry Edinburgh: Oliver and Boyd; 1969.
22. Riggs D: The Mathematical Approach to Physiological Problems Cambridge: MIT Press; 1963.
doi: 10.1186/1742-4682-7-11
Cite this article as: Kepner, Saturation Behavior: a general relationship described by a simple second-order differential
equation Theoretical Biology and Medical Modelling 2010, 7:11
Received: 25 March 2010 Accepted: 13 April 2010
Published: 13 April 2010
This article is available from: 2010 Kepner; licensee BioMed Central Ltd. This is an Open Access article distributed under the terms of the Creative Commons Attribution License ( s/by/2.0), which permits unrestricted use, distribution, and reproduction in any medium, provided the original work is properly cited.Theoretical Biology and Medical Modelling 2010, 7:11