Báo cáo y học: " Research Mathematical framework for human SLE Nephritis: disease dynamics and urine biomarkers" pdf
Bạn đang xem bản rút gọn của tài liệu. Xem và tải ngay bản đầy đủ của tài liệu tại đây (987.99 KB, 20 trang )
© 2010 Budu-Grajdeanu et al; licensee BioMed Central Ltd. This is an Open Access article distributed under the terms of the Creative
Commons Attribution License ( which permits unrestricted use, distribution, and repro-
duction in any medium, provided the original work is properly cited.
Budu-Grajdeanu et al. Theoretical Biology and Medical Modelling 2010, 7:14
/>Open Access
RESEARCH
Research
Mathematical framework for human SLE Nephritis:
disease dynamics and urine biomarkers
Paula Budu-Grajdeanu
1
, Richard C Schugart
2
, Avner Friedman*
3
, Daniel J Birmingham
4
and Brad H Rovin
4
Abstract
Background: Although the prognosis for Lupus Nephritis (LN) has dramatically improved
with aggressive immunosuppressive therapies, these drugs carry significant side effects. To
improve the effectiveness of these drugs, biomarkers of renal flare cycle could be used to
detect the onset, severity, and responsiveness of kidney relapses, and to modify therapy
accordingly. However, LN is a complex disease and individual biomarkers have so far not
been sufficient to accurately describe disease activity. It has been postulated that
biomarkers would be more informative if integrated into a pathogenic-based model of LN.
Results: This work is a first attempt to integrate human LN biomarkers data into a model of
kidney inflammation. Our approach is based on a system of differential equations that
capture, in a simplified way, the complexity of interactions underlying disease activity.
Using this model, we have been able to fit clinical urine biomarkers data from individual
patients and estimate patient-specific parameters to reproduce disease dynamics, and to
better understand disease mechanisms. Furthermore, our simulations suggest that the
model can be used to evaluate therapeutic strategies for individual patients, or a group of
patients that share similar data patterns.
Conclusions: We show that effective combination of clinical data and physiologically
based mathematical modeling may provide a basis for more comprehensive modeling and
improved clinical care for LN patients.
Background
Autoimmune diseases occur when the immune system recognizes normal healthy tissues as
foreign and attacks them. Systemic lupus erythematosus (SLE) is a chronic inflammatory
autoimmune disorder that may affect the skin, joints, kidneys, and other organs. Lupus
nephritis (LN) refers to the kidney disease caused by SLE. LN is associated with a worse
prognosis than non-renal SLE [1,2], and can lead to chronic kidney disease (CKD). The
pathogenesis of LN is complex and appears to be influenced by environmental and genetic
factors [3]. Anti-DNA antibodies or immune complexes which contain these antibodies, are
deposited in the kidney, which results in activation of the complement system, This leads to
tissue inflammation and damage, and the consequent release of DNA, nuclear material, and
cell debris. These products of tissue damage can serve as antigens, further stimulating the
immune system and increasing the intrarenal inflammatory response. Clinical signs of LN
include blood and protein in the urine, deterioration of kidney function, and high blood
pressure. LN is typically characterized by exacerbations/relapses of disease activity (flares)
and remissions (after treatment).
* Correspondence:
3
Department of Mathematics,
Ohio State University, Columbus
OH 43210, USA
Full list of author information is
available at the end of the article
Budu-Grajdeanu et al. Theoretical Biology and Medical Modelling 2010, 7:14
/>Page 2 of 20
The accumulation of immune complexes in the renal glomeruli is pathogenic in LN, so
there have been significant efforts directed toward developing treatments that control
the formation, deposition, and clearance of immune complexes. Because there are multi-
ple categories of lupus kidney disease, treatment is based largely on histologic severity
[4,5]. The goal of treatment is to resolve the inflammation caused by the immune com-
plexes and improve kidney function. Although the disease cannot be cured, aggressive
immunosuppression is often effective in controlling renal flares. Despite improving dis-
ease outcome, these drugs are associated with significant morbidity and mortality.
Until more specific and less toxic therapies are developed, it is important to use the
currently available immunosuppressive drugs more effectively and limit their toxicity.
One way to improve current therapy is to monitor LN flare activity, accurately predict
who will flare, when the flare will occur, and at what level of intensity, and plan the treat-
ment accordingly, with the goals of forcing remission quickly, and minimizing cumula-
tive immunosuppressive dose. Such effective approaches, however, are dependent on
identifying biomarkers that monitor LN flare activity. Biomarkers discovery for SLE is an
intense area of research [6-9]. Considerable efforts to validate biomarkers that best
reflect flare status suggest that a panel of biomarkers rather than a single candidate will
be needed. To determine which set of biomarkers is to be used will require the integra-
tion of biomaker data into a model of renal flare.
The present work presents a mathematical framework to correlate physiological pro-
cesses relevant to LN with observed patient disease profiles. The differential equations
model developed here is based on the dynamics of a few key components of the immune
system and their effects on tissue damage. The complexity of the disease is effectively
captured by this model, which qualitatively reproduces the clinical variations observed
in LN patients undergoing therapy. Relevant parameter values are estimated using
results of urine biomarker discovery studies conducted in the Ohio SLE Study (OSS).
Although the model is simple, it nevertheless provides a useful first step in suggesting
possible approaches to effective integration of LN biomarker data.
Autoimmunity and inflammation
Although autoimmunity initiates SLE and subsequently LN, the molecular and cellular
mechanisms that trigger this autoimmunity are not discussed here. For this work it is
assumed that autoimmunity has already been initiated and the body's immune system
has turned on itself to attack normal tissue. Helper T cells (Th2) produce cytokines (IL2,
IL4, IL10) that help B cells proliferate and mature as auto-antibody producing cells.
Released by the differentiated B cells into the blood, these auto-antibodies combine with
self-antigens and form immune complexes. Under normal conditions, immune com-
plexes are rapidly removed from the bloodstream and tissue by mechanisms involving
the complement system, erythrocyte complement receptors, and phagocyte complement
and Fc receptors [10,11]. During autoimmunity, however, the continuous production of
auto-antibodies, in conjunction with defects in the clearance system, allows immune
complexes to deposit in various organs, like the kidneys in LN. The localization of
immune complexes in tissues is influenced by the nature of the antigen, the class of the
antibody, and the size of the complex.
The complement system is part of the innate immune system, and consists of a group
of soluble circulating proteins and cell-bound receptors. The complement system is acti-
vated by immune complexes, and as mentioned, is important for the proper clearance of
Budu-Grajdeanu et al. Theoretical Biology and Medical Modelling 2010, 7:14
/>Page 3 of 20
immune complexes. However, when locally deposited immune complexes activate the
complement system, the cascade of biochemical events results in the release of pro-
inflammatory mediators that can increase vascular permeability, draw leukocytes to the
area of immune complex localization, and directly induce tissue damage. Leukocytes are
also activated by complement, and by direct interaction with antibodies in the immune
complex via Fc receptors. This activation leads to more vascular damage and tissue
destruction through the release of pro-inflammatory cytokines, toxic oxygen products,
and proteolytic lysosomal enzymes. Coincident with these pro-inflammatory processes,
anti-inflammatory mechanisms are activated to help control inflammation, however in
LN these are generally overwhelmed. Prolonged inflammation is undesirable because it
is characterized by healing of the tissue through scarring, causing the loss of normal tis-
sue architecture. This can lead to chronic organ dysfunction.
Therapy
Prognosis and outcome of LN can usually be improved dramatically by treatment. The
considerations regarding the treatment of LN rest on an accurate assessment of the type
and severity of renal involvement [4,5]. Current treatment for patients with severe kid-
ney disease generally involves high dose corticosteroids accompanied by cytotoxic drugs
that reduce the harmful effects of humoral or cellular immunity, and thereby allow the
body to reestablish immunologic homeostasis.
The goal of treatment is to induce sustained remission, preserve renal parenchyma,
and stabilize or improve kidney function (normalize serum creatinine). The time to
reach remission varies from patient to patient, but early remission is a predictor of good
prognosis. However, despite therapy, many patients flare again, raising questions about
the effectiveness of immunosuppressive therapies, and the pathogenesis of LN flare. The
efficacy of therapy may be dependent on when it is initiated relative to the status of renal
injury, dosing of therapy, and drug combinations.
Biomarkers/urine chemokines
To improve clinical treatment protocols, biomarkers that reflect different phases of the
LN flare cycle have been sought in recent years. In this regard, we consider phases of a
flare cycle as those times representing baseline, immediately before flare, at flare and
immediately after flare. Most of these putative biomarkers are urine and serum factors
closely related to renal flare cycles. One such group of biomarkers are the various com-
plement proteins and activated fragments [12], though it is still unclear how clinically
useful these are. Another candidate group of biomarkers are urine chemokines, which
appear to change in amount with disease activity [9]. These chemotactic factors are
believed to be induced locally within the kidney by the immune complex accumulation,
and appear to be responsible for amplifying the inflammatory response by recruiting
additional leukocytes to the kidney, thereby mediating tissue injury and renal dysfunc-
tion. The chemokine that has received the most attention in this regard is monocyte
chemotactic protein-1 (MCP-1). Other potential urine biomarkers of LN activity include
the iron regulatory hormone hepcidin, and the adipokine adiponectin [6-9].
Modeling LN dynamics
The most frequent test ordered for the evaluation of LN activity is the urine protein
level. Although proteinuria is an accepted LN clinical biomarker, it does not accurately
forecast the LN flare cycle. Furthermore, while complement proteins, urine MCP-1
(uMCP-1), adiponectin, and hepcidin have been proposed as candidate LN flare cycle
biomarkers, it is presently not clear how these would be used clinically to provide diag-
Budu-Grajdeanu et al. Theoretical Biology and Medical Modelling 2010, 7:14
/>Page 4 of 20
nostic, pathologic, or therapeutic information on each phase of the flare cycle to signifi-
cantly impact LN treatment.
To accurately describe the complex dynamics of the renal flare, models incorporating
these LN biomarkers need to be built to effectively capture the multiple time-dependent
interactions among the biomarkers and other variables involved in the disease. Statistical
models applied to large population clinical studies have been successful in highlighting
relationships and correlations among various biological quantities, but have so far failed
to provide reliable quantitative or even qualitative models [13].
Another way to address the issue of complex biological interactions and their effects is
by means of mathematical modeling. Here we propose a mathematical model of LN
dynamics based on a set of known biological interactions and experimental investiga-
tions. The model reproduces temporal changes in disease activity, including some LN
urine biomarker profiles. We suggest that this model, paired with further clinical and
experimental investigations, will provide a basis for more comprehensive modeling and
improved clinical care for LN patients.
Materials and methods
Study data
The data examined here came from patients enrolled in the prospective longitudinal
study OSS. Patients in OSS had four or more American College of Rheumatology criteria
for SLE, and either currently active SLE, two or more SLE flares that required an increase
in therapy in the preceding three years, or persistently active SLE defined as more than
four months of activity despite therapy. Most patients were receiving maintenance
immunosuppressive therapy before flare. Each patient was evaluated clinically and with
laboratory tests every two months regardless of disease activity, and provided blood, a 24
hour urine specimen, and a freshly voided urine specimen at the visit. Renal and nonre-
nal flares were identified and uMCP-1, urine protein to urine creatinine ratio (uP:C), and
plasma levels of complement components C3 and C4 were measured. Serial measure-
ments from four individual patients, accompanied by therapy recordings when available,
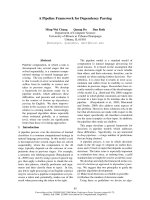
are shown in Fig. 1 and Fig. 2.
Model description
We introduce here a model of kidney inflammation sustained by autoimmunity and
damaged tissue. Based on the assumption that LN is mainly due to immune complex
accumulation and resulting inflammation [3], the model captures the temporal behavior
of serial measurements of candidate biomarkers from patients with unstable LN disease
activity.
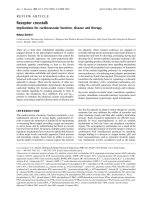
Fig. 3 summarizes the mechanisms upon which our model is built. The schematic dia-
gram represents a network of interactions that mediate renal damage in LN. Naive T
cells (not shown) are activated by the self-antigen presenting cells (APCs), and release
cytokines and various chemical signals that stimulate the activity of other immune cells,
such as natural killer cells, helper T cells, B cells and macrophages. Each of these activa-
tion pathways can lead to tissue destruction. Frequently, helper T cells can cause local
inflammation and tissue damage by recruiting macrophages via cytokines and chemok-
ines. Tissue damage can also occur directly via the activity of cytotoxic natural killer
cells. However, the most extensive tissue damage is due to auto-antibodies, produced by
the B cells. These auto-antibodies form immune complexes with self-antigen, either by
binding directly to cell surface self-antigens, or by forming immune complexes in the cir-
Budu-Grajdeanu et al. Theoretical Biology and Medical Modelling 2010, 7:14
/>Page 5 of 20
culation that get deposited in the kidney. Immune complexes activate the complement
system (not shown), which recruits and activates effector leukocytes (e.g. neutrophils,
macrophages). These pro-inflammatory activated leukocytes produce toxic products
that damage tissue. Concurrent production of anti-inflammatory cells and chemicals
counterbalance the action of pro-inflammatory mediators. The flare process undergoes
positive feedback because debris from apoptotic damaged cells further stimulates the
autoimmune response. As the flare is treated, activated effector cells are reduced, the
production of auto-antibodies is disrupted, the deposition of immune complexes
decreases, inflammation is resolved, and tissue that is not permanently scarred under-
goes repair or regeneration.
Figure 1 Experimental data of individual patients enrolled in the Ohio SLE Study (I). Clinical measure-
ments of urine MCP-1, urine P:C, serum C3 and serum C4 taken every 2 months, and accompanying therapy
(Prednisone (Pred) = corticosteroids, Mycophenolate Mofetil (MMF) = immunosuppressants) around 6 months
before flare and 4 months after flare, for patient 416 (first column) and patient 444 (second column). The hori-
zontal dotted lines represent baseline values determined at two different time points that were at least 6
months from any flare activity. The gray vertical line marks the renal flare.
-6m -4m -2m Flare +2m +4m
0
2
4
uMCP-1 (pg/mg)
-6m -4m -2m Flare +2m +4m
0
4
8
12
uP:C
-6m -4m -2m Flare +2m +4m
50
100
150
C3 (mg/dl)
-6m -4m -2m Flare +2m +4m
10
25
40
C4 (mg/dl)
-6m -4m -2m Flare +2m +4m
0
10
20
Pred (mg)
-6m -4m -2m Flare +2m +4m
Time (months)
500
1250
2000
MMF (mg)
-6m -4m -2m Flare +2m +4m
0
2
4
uMCP-1 (pg/mg)
-6m -4m -2m Flare +2m +4m
0
4
8
12
uP:C
-6m -4m -2m Flare +2m +4m
50
100
150
C3 (mg/dl)
-6m -4m -2m Flare +2m +4m
10
25
40
C4(mg/dl)
-6m -4m -2m Flare +2m +4m
0
10
20
Pred (mg)
-6m -4m -2m Flare +2m +4m
Time (months)
500
1250
2000
MMF (mg)
Patient 416 Patient 444
Budu-Grajdeanu et al. Theoretical Biology and Medical Modelling 2010, 7:14
/>Page 6 of 20
Because LN develops in parallel with the systemic disease of SLE, it is hard to draw dis-
tinction between clinical manifestations that are only relevant to LN. While we cannot
ignore the contribution of systemic disease to temporal changes of the LN biomarkers,
some LN biomarkers, such as uMCP-1, appear to be specific and do not reflect systemic
disease activity.
Of all the paths leading to renal dysfunction in SLE, we have assumed that immune
complex-mediated damage is central to LN. This simplified view of the interactions rele-
vant to lupus renal flares is shown in the gray background area of Fig. 3. The simplified
model does not address the spatial, dynamic, and compartmental aspects (blood, tissue,
etc.) of the immune and inflammatory responses.
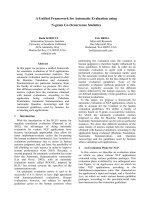
Figure 2 Experimental data of individual patients enrolled in the Ohio SLE Study (II). Clinical measure-
ments of urine MCP-1, urine P:C, serum C3 and serum C4 taken every 2 months, and accompanying therapy
(Prednisone (Pred) = corticosteroids, Mycophenolate Mofetil (MMF), Azathioprine (AZA) = immunosuppres-
sants) around 6 months before flare and 4 months after flare, for patient 448 (first column) and patient 491 (sec-
ond column). The horizontal dotted lines represent baseline values determined at two different time points
that were at least 6 months from any flare activity. The gray vertical line marks the renal flare.
-6m -4m -2m Flare +2m +4m
0
2
4
uMCP-1 (pg/mg)
-6m -4m -2m Flare +2m +4m
0
4
8
12
uP:C
-6m -4m -2m Flare +2m +4m
50
100
150
C3 (mg/dl)
-6m -4m -2m Flare +2m +4m
10
25
40
C4 (mg/dl)
-6m -4m -2m Flare +2m +4m
0
10
20
Pred (mg)
-6m -4m -2m Flare +2m +4m
Time (months)
500
1250
2000
MMF (mg)
-6m -4m -2m Flare +2m +4m
0
2
4
uMCP-1 (pg/mg)
-6m -4m -2m Flare +2m +4m
0
4
8
12
uP:C
-6m -4m -2m Flare +2m +4m
50
100
150
C3 (mg/dl)
-6m -4m -2m Flare +2m +4m
10
25
40
C4 (mg/dl)
-6m -4m -2m Flare +2m +4m
0
10
20
Pred (mg)
-6m -4m -2m Flare +2m +4m
Time (months)
49
50
51
AZA (mg)
Patient 448 Patient 491
Budu-Grajdeanu et al. Theoretical Biology and Medical Modelling 2010, 7:14
/>Page 7 of 20
Model variables
The mathematical model builds on the gray box interactions and follows the evolution in
time of four variables:
• Immune complexes (I), implicitly related to other components of the immune sys-
tem which contribute to the formation of immune complexes (antigens, antigen pre-
senting cells, T cells, B cells);
• Pro-inflammatory mediators (P), that represent the combined effect of immune
cells such as macrophages and lymphocytes, and pro-inflammatory mediators, such
as complement (as measured by C4 or C3), MCP-1, TNF-α, IL-1-β;
• Damaged tissue (D), namely, healthy tissue that has been damaged by the immune
cells and/or immune complexes, and is undergoing apoptosis or necrosis;
Figure 3 Network of interactions that mediate renal damage in lupus nephritis. Naive T cells (not shown)
are activated by the self-antigen presenting cells (APCs), and release cytokines and various chemical signals
that stimulate the activity of other immune cells, such as natural killer cells, helper T cells, B cells and mac-
rophages. Each of these activation pathways can lead to tissue destruction. Frequently, helper T cells can cause
local inflammation and tissue damage by recruiting macrophages via cytokines and chemokines. Tissue dam-
age can also occur directly via the activity of cytotoxic natural killer cells. However, extensive tissue damage is
due to auto-antibodies, produced by the B cells. These auto-antibodies form immune complexes with self-an-
tigen, either by binding directly to cell surface antigens, or by forming immune complexes in the circulation
that deposit in the kidney. Immune complexes activate the complement system (not shown), which recruits
and activates effector leukocytes (e.g. neutrophils, macrophages). These pro-inflammatory activated leuko-
cytes produce toxic products that damage tissue. Concurrent activation of anti-inflammatory cells and produc-
tion of anti-inflammatory mediators counterbalance the action of pro-inflammatory mediators. The flare
process undergoes positive feedback because debris from apoptotic and damaged cells further stimulates the
autoimmune response. As the flare is treated, activated effector cells are reduced, the production of auto-anti-
bodies is disrupted, the deposition of immune complexes decreases, and tissue that is not permanently scarred
undergoes repair or regeneration. Our mathematical model, Eqs (1)-(4), builds on the gray box interactions and
follows the evolution in time of four variables: immune complexes (I), pro-inflammatory mediators (P), dam-
aged tissue (D), and anti-inflammatory mediators (A).
Immune
mediators (P)
mediators (A)
Damage (D)
cells
T helpers 2
T helpers 1
B cells
T killers
complexes (I)
Pro-inflammatory
Anti-inflammatory
Effector
Budu-Grajdeanu et al. Theoretical Biology and Medical Modelling 2010, 7:14
/>Page 8 of 20
• Anti-inflammatory mediators (A), that represent the combined effect of anti-
inflammatory cells, anti-inflammatory cytokines such as IL-10, TGF-β, as well as
therapeutics.
Model equations
Equation for I (immune complexes)
The model assumes that circulating immune complexes deposit in the kidneys at a rate
s
i
. This term is also a base value for the activity of the complement system. Although
complement activation in the tissue and at the site of tissue damage will occur under at
least three scenarios when considering SLE (when I form in the circulation, when I
deposit in tissue, and when tissue damage occurs), we average them here for simplicity.
Apart from the immune complexes passively trapped within glomeruli, we also account
for immune complexes formed as a result of self-antigen accumulation within the tissue.
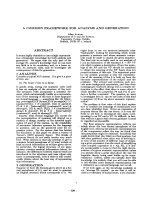
A reasonable function for the I inducement is considered to be a sigmoid (S-shape) func-
tion as shown in Fig. 4. Thus, as in [14-16], we take here a functional response of Hill
kinetics of order 2, assuming that just a few self-antigens will not raise a strong immune
response, but as debris accumulates the immune response is gradually induced, and sat-
uration, s
id
, is reached for sufficiently many self-antigens. The accumulation of immune
complexes activates the complement cascade, generating peptides and chemotactic fac-
tors that trigger the inflammatory response, with various mediators being activated and
cells being recruited (at rate k
pi
) to remove the immune complexes from the system (at
rate k
ip
). In summary,
Figure 4 Hill functional of order 2. We represent the immune complexes (I) formation due to accumulation
of self-antigens from debris D, by a Hill functional of order 2, . When there are only a
few antigens around, not many immune complexes are produced; as antigens accumulate, more immune
complexes are being created, and saturation, s
id
, is reached for sufficiently many self-antigens.
D (Debris, self-antigens)
0
s
id
I (Immune complexes)
s
id
*D
2
/(k
id
2
+D
2
)
sD k D
id id
222
/ +
()
Budu-Grajdeanu et al. Theoretical Biology and Medical Modelling 2010, 7:14
/>Page 9 of 20
Here and in the following, for simplicity, we take all the functions f to be the same, but
they will also depend on the anti-inflammatory mediators; see Eq. (5).
Equation for P (pro-inflammatory mediators)
The prolonged presence of immune complexes sets the stage for more damaging inflam-
matory events. The immune response is amplified by existing immune cells and pro-
inflammatory mediators, providing positive feedback at rate k
pi
, respectively k
pp
. To
these immune responses, we add a term that accounts for the activation of pro-inflam-
matory agents as a result of cytokines released or induced by damaged tissue, at rate k
pd
.
This term accounts for the clinically observed increase in the number of immune cells in
the kidney due to infiltration by circulating leukocytes. As the infiltration in a non-lym-
phoid organ is usually due to biologic mediators released by damaged cells themselves
and/or by resident or infiltrated leukocytes stimulated by the damaged cells, the infiltra-
tion term is taken to be dependent on the concentration of damaged cells; this also
ensures that in the absence of damaged cells there is no infiltration. By including decay of
pro-inflammatory mediators at rate μ
p
, we have
Equation for D (damaged tissue)
The damaged tissue not only releases pro-inflammatory cytokines (at rate k
pd
) that cause
further immune cells activation, but also the phagocytosis of immune complexes by
immune cells can result in release of cytokines and toxins that lead to tissue damage
[17,18], a phenomenon described here by the first term in the equation for D. The posi-
tive feedback interactions between immune cells and damage exists even in the absence
of immune complexes and can be triggered by other stimuli, such as tissue trauma [19].
We take k
dp
the rate at which collateral damage is produced by the pro-inflammatory
mediators. The decay rate of damage, μ
d
, is a combination of repair, resolution, and
regeneration of tissue. Hence,
Equation for A (anti-inflammatory mediators)
To keep the inflammation under control, most LN patients are regularly prescribed anti-
inflammatory drugs. The anti-inflammatory therapy is mathematically modeled here by
adding a source term s
a
in the equation for A. There is also intrarenal production of anti-
inflammatory mediators, production correlated to the level of inflammation and dam-
age, at rates k
ap
, and respectively k
ad
. Once activated, the anti-inflammatory chemicals
dI
dt
fs fs
D
k
id
D
i
deposition
id
renal p roduction
=
()
+
()
+
2
22
−
()
kf PI
ip
phagocytosis
.
(1)
dP
dt
fkI kP fkD
pi pp
pro inflammation
pd
infiltrati
=+
()
+
()
−
oon
p
decay
P
−
m
.
(2)
dD
dt
kfPI kfP
dip
phagocytosis
dp
collateral damage
=
()
+
()
−
m
d
decay
D .
(3)
Budu-Grajdeanu et al. Theoretical Biology and Medical Modelling 2010, 7:14
/>Page 10 of 20
inhibit the production of more pro-inflammatory mediators, decrease the ability of pro-
inflammatory chemicals and cells to fight against immune cells, and lower the damage
created by the inflammation. Unfortunately, the anti-inflammatory cytokines discor-
dantly counter the effects of pro-inflammatory mediators, thus losing the battle. The use
of immunosuppressive drugs allows some attenuation of the inflammation, so the natu-
ral anti-inflammation can be effective. Finally, the anti-inflammatory agents degrade at
rate μ
a
. In summary,
While directly lowered by the immunosuppression, both s
i
and s
id
, are also controlled
by the endogenous anti-inflammatories. All these inhibitions are incorporated into the
model by taking
The functions f in the above equations need not all be the same, although they should
have similar form and profile as the function in Eq. (5). However, in the absence of data,
for simplicity, we have taken all these functions to be the same.
Clinical relevance
In order to assess whether the model we developed here can be used to further study the
dynamics of the disease, we compare the simulations of the model with clinical data pre-
sented in Fig. 1 and Fig. 2. In doing so, the surrogate marker for P will be the chemotactic
factor MCP-1, represented here by the uMCP-1, which is thought to be mainly induced
by the presence of the immune complexes. MCP-1 is a chemokine responsible for
recruiting inflammatory cells to the kidney and activating these cells.
Blood or protein in the urine is a sign of kidney damage, as most proteins are too big to
pass through the renal filtration barrier into the urine unless the glomeruli are damaged.
Generally, worsening of proteinuria reflects the extent of kidney damage. Consequently,
proteinuria, represented here by the uP:C, is taken as a surrogate clinical marker for
acute kidney damage, D.
In addition to using urine biomarkers data when evaluating the efficacy of the model,
therapy protocols are also considered when available. In the model, immunosuppression
is enhanced due to any drug/event leading to decreased production of immune com-
plexes. Therefore, in terms of model parameters, immunosuppressive therapy means
decreasing the rate of immune complex deposition into the kidney, s
i
, and/or decreasing
the rate of intrarenal production of immune complexes, s
id
. In LN either steroids or
immunosuppressants can trigger these salutary effects. Lastly, the anti-inflammatory
therapy is simulated as any drug/event leading to an increase of anti-inflammatory medi-
ators, modeled here by the source term s
a
.
dA
dt
sfkPkD
a
therapy
ap ad
intrarental production
=+ +
()
−
m
aa
decay
A
.
(4)
fx
x
AA
inf
()
=
+
()
1
2
/
.
(5)
Budu-Grajdeanu et al. Theoretical Biology and Medical Modelling 2010, 7:14
/>Page 11 of 20
Parameters
To explore the model computationally, the ordinary differential equations (1)-(4) are
numerically solved in Matlab. Initial conditions are chosen to match the clinical data
when available (P
0
, D
0
), and to depict some preexisting conditions stemming from earlier
stages of the disease dynamics (I
0
> 0, A
0
> 0).
For each individual patient, not only we match P
0
and D
0
to uMCP-1 and uP:C mea-
surements at 6 months before flare, but we also estimate patient-specific parameters that
would produce results consistent with individual biological observations on these urine
biomarkers. In that sense, solutions to the differential equations for P and D fit the data
sets on uMCP-1 and uP:C, respectively, for each of the four patients considered.
In fitting the model to clinical data, we fixed μ
a
to a biologically realistic value. Based
on parameter values used in [19], the decay rate of the anti-inflammatory mediators is
calculated using an average half-life of 7.5 h (≈ 0.31 days).
Since the model variables represent various types of cells and cytokines concurrently,
units for the model variables are not fixed, but rather represented as generic units like I-
units, P-units, D-units, and A-units. However, as we are interested in possible biological
and medical applications of the mathematical model, we compare some of the general-
ized variables with clinically-measured variables (like uMCP1 and uP:C), and calibrate
the model to these available clinical data.
Results
We incorporate clinical measurements of uMCP-1 and uP:C from OSS LN biomarker
discovery studies into the mathematical model, to find sets of parameters that best
describe data and disease dynamics. Estimated parameter values are then used to per-
form computational experiments that address model usefulness. We show that effective
combination of clinical data and mathematical modeling can improve our understanding
of disease dynamics, and can be used to gain insight into why failures occur with the way
LN is currently treated.
Comparison of simulated uMCP-1 and uP:C dynamics during flare cycle with patients data
As disease progression and response to treatment varies from one patient to another, we
choose to separately calibrate the mathematical model to each individual patient clinical
data shown in Fig. 1 and Fig. 2. More precisely, we fit the clinical urine biomarkers data
sets on uMCP-1 and uP:C to the solutions of the differential equations for P and D,
respectively, to derive the patient-specific parameter estimates listed in Table 1 and
Table 2. The derivations were handled with the curve fitting tool of Berkeley Madonna
[20], using nonlinear least-squares regression that minimizes the sum of the squared
residuals between the clinical data and the computational solutions.
Comparisons of model simulations to clinical data are shown in Fig. 5, panels A-D
(solid curves). The filled squares connected by the dotted curves represent the clinical
serial measurements of uMCP-1 and uP:C, taken approximately two months apart. The
flare cycle spans ten months, six months before flare to four months after the renal flare.
We have found that the model qualitatively and (to some degree) quantitatively repro-
duces the experimental measurements around the renal flare. Given the simplifications
imposed on the model we expect some variations from data. For example, in the model P
reflects the overall activity of all pro-inflammatory mediators, rather then the uMCP-1
dynamics alone.
Budu-Grajdeanu et al. Theoretical Biology and Medical Modelling 2010, 7:14
/>Page 12 of 20
Because parameters s
i
, s
id
and s
a
are used to reflect therapy changes and/or therapy
effects on the disease dynamics, these parameters are in general time dependent; s
i
, for
instance, may vary greatly during the flare cycle (changes in therapy, therapy failure or
success), and can also vary greatly from patient to patient (stages of disease, general
patient health). Taking them as piecewise constant is just a way of simplifying the com-
putations, but one may think of the solutions as smooth functions which are approxi-
mated by the discontinuous ones.
Although the Berkeley Madonna software finds parameter estimates that correspond
to the best fit of the model to the data, there is some variance which of course increases if
the data set is too small. We acknowledge that our data set is small, but this is the state of
the experimental knowledge at this time. Findings from clinical studies with more fre-
quent sampling, as well as incorporating more detailed biological information, would be
useful to improve the accuracy of parameter estimation and data fitting.
The parameterized model can be used to gain insight into disease mechanisms
Parameter values that best describe the data could yield valuable insights into the
dynamics of pro- and anti-inflammatory pathways within the kidneys during LN. For
example, intrarenal levels of immune complexes could be modulated by increasing the
rate at which the immune complex deposit into the kidney (s
i
), or by increasing the
Table 1: Initial conditions and parameter estimates that correspond to the best fit of the
model to the data.
Patient 416 Patient 444 Patient 448 Patient 491 Units
I
0
0.1 0.1 0.1 0.1 I-units
P
0
0.4 0.5 0.58 0.5 P-units
D
0
1.7 3.590.850.38D-units
A
0
0.1 0.1 0.1 0.1 A-units
s
i
0.001-0.005 0.5-6 0.02-4.5 0.1-0.5 I-units day
-1
s
id
0.002-0.015 0.5-2 0.02-3.8 0.1-0.6 I-units day
-1
k
id
1111D-units
k
ip
0.025 0.015 0.01 0.003 P-units
-1
day
-1
k
pi
0.13 0.01 0.006 0.05 P-units C-units
-1
day
-1
k
pp
0.02 0.015 0.02 0.12 day
-1
k
pd
0.001 0.001 0.001 0.01 P-units D-units
-1
day
-1
μ
p
0.06 0.06 0.13 0.33 day
-1
k
dip
0.025 0.015 0.01 0.003 P-units
-1
day
-1
k
dp
0.27 0.01 0.03 0.015 D-units P-units
-1
day
-1
μ
d
0.04 0.015 0.03 0.035 day
-1
s
a
0.05-0.3 2-7 0.4-10 1-4 A-units day
-1
k
ap
0.022 0.006 0.035 0.001 A-units P-units
-1
day
-1
k
ad
0.22 0.06 0.35 0.01 A-units D-units
-1
day
-1
μ
a
2.2 2.2 2.2 2.2 day
-1
A
inf
0.45 0.45 0.45 0.45 A-units
For each patient, parameter estimates are given along with the initial conditions for the best fits of the P
and D model solutions to the serial measurements of uMCP-1 and uP:C, respectively. Detailed information
on parameter estimates for s
i
, s
id
, and s
a
is included in Table 2.
Budu-Grajdeanu et al. Theoretical Biology and Medical Modelling 2010, 7:14
/>Page 13 of 20
Table 2: Parameter estimates for s
i
, s
id
, and s
a
, that correspond to the best fit of the model
to the data.
Patient 416 Patient 444 Patient 448 Patient 491
Time
frame
si sid sa si sid sa si sid sa si sid sa
[-6m, -4m]0.0020.0050.056130.20.260.40.50.61
[-4m, -2m] 0.001 0.003 0.1 2 0.5 4 0.2 0.26 0.4 0.5 0.6 1.2
[-2m, -2w] 0.005 0.015 0.05 2 0.5 2 0.02 0.06 0.4 0.5 0.6 1.2
[-2w, Flare]0.0050.0150.055224.53.80.40.50.61.2
[Flare, +2w] 0.001 0.002 0.3 0.5 0.5 7 0.06 0.02 5 0.1 0.1 2.4
[+2w, +6w] 0.001 0.002 0.3 0.5 0.5 7 0.06 0.02 10 0.1 0.1 2.4
[+6w, +2m] 0.001 0.002 0.3 0.5 0.5 7 0.06 0.02 2 0.1 0.1 2.4
[+2m, +4m] 0.005 0.012 0.1 1.5 0.5 7 0.06 0.02 2 0.1 0.1 4
Because parameters s
i
, s
id
and s
a
are used to reflect therapy changes and/or therapy effects on the disease
dynamics, they are in general time dependent. All these parameters may vary greatly during the flare cycle
(changes in therapy, therapy failure or success), and can also vary greatly from patient to patient (stages of
disease, general patient health).
immune response to accumulation of damaged cells (s
id
). In spite of the fact that both
mechanisms are targeted by maintenance immunosuppressive therapy, during disease
flare new immune complexes continue to add to the initial levels and aggravate the
symptoms. For patients considered here, major changes in disease dynamics are mostly
explained by significantly increased intrarenal immune complexes levels beginning 2
months to 2 weeks before flare (patients 416, 444 and 448), as suggested by the estimated
values of s
i
and s
id
. The values for s
a
, and the information related to ongoing therapy for
each individual patient, suggest that immune complexes levels increase when therapy is
too weak (patients 448 and 419) or timed incorrectly (patients 416 and 444). Another
reason for the sudden increase of s
i
and s
id
while on therapy could be that during immu-
nosuppression a higher amount of self-antigen from the apoptotic cells is needed to acti-
vate the immune cells to produce auto-antibodies. Once that threshold is reached
maintenance therapy cannot control the immune response wave. Unsuccessful therapy
could also theoretically be explained by a shorter half-life of endogenous anti-inflamma-
tory factors compared to the half-lives of pro-inflammatory mediators and damaged tis-
sue.
The parameterized model can be used to explore therapeutic strategies
We are interested not only in matching model simulations with clinical data and learning
about possible mechanisms leading to renal flare, but also in investigating therapeutic
implications of these results. By computational experiments in which inputs and param-
eters are varied, we explored the responses of the model to various clinical interventions,
and identified administration strategies that would result in the best outcomes. This is
illustrated here for each of our four patients individually, but the method can be applied
to any group of patients that have similar clinical manifestations.
Patient 416
Despite baseline complement component levels, and increased immunosuppression,
there is worsening of symptoms leading to flare. One can argue that renal flare is a result
of either inadequate handling of immunosuppression at 2 months before flare, or low
Budu-Grajdeanu et al. Theoretical Biology and Medical Modelling 2010, 7:14
/>Page 14 of 20
anti-inflammatory levels (s
a
= 0.05 A-units/day). Fig. 6A shows that pro-inflammation
and organ dysfunction could be significantly lowered by maintaining the therapy at the 4
months before flare levels (dashed curves). To address the low levels of anti-inflamma-
tion, one could increase the anti-inflammatory therapy at any time before flare, by
increasing s
a
(results not shown). Alternatively, methods that increase the half-life of
anti-inflammatory mediators, i.e. from 0.3 days to 0.6 days, would also successfully lower
inflammation and reduce tissue damage (Fig. 6B, dashed curves).
Patient 444
Low complement component values suggest a significant increase of intrarenal immune
complexes, even as immunosuppression dose is increased 4 months before flare. While
the high levels of pro-inflammatory agents alone would explain the renal flare, the drop
in therapy 2 months before flare could also be responsible. If the anti-inflammatory ther-
apy would have been kept stronger, s
a
= 4, 2 months before flare (Fig. 7A, dashed curves),
the clinical outcome would have been greatly improved. Moreover, if the anti-inflamma-
tory drugs would have been stronger immuno-inhibitors and lower s
i
and s
id
even more,
no change in anti-inflammation would have been needed to improve disease dynamics
(Fig. 7B, dashed curves). Given that immune complexes are a leading cause of damage
and their numbers are not lowered by current therapy, we could also explore other ways
of reducing the level of immune complexes. One option is to increase the rate at which
phagocytes remove immune complexes from the system, k
ip
. However that could inad-
vertently increase tissue damage by the activated phagocytes, and make more debris
available to trigger increased production of immune complexes (results not shown).
Decreasing the half-life of damaged tissues - i.e. by facilitating apoptosis, or the clearance
of the damaged cells, could be a better option, as will be illustrated for the next patient.
Patient 448
Maintenance therapy did not avoid LN symptoms. We therefore compare outcomes of a
stronger therapy, increasing the anti-inflammatory drug dose, either at 2 months before
flare (Fig. 8A, dashed curves), or later at 2 weeks before flare (results not shown). In both
cases, pro-inflammation and tissue dysfunction tend to improve rapidly. Whereas pro-
inflammation is low with or without intervention, timing of intervention affects damage
decrease. Impaired clearance of apoptotic cells could explain the elevated levels of dam-
age vs. lower levels of pro-inflammation. Even a later increase of corticosteroids, at 2
weeks before flare, results in a lower range of damage and dysfunction, when the removal
rate of damage cells is increased (Fig. 8B, dashed curves). It is reasonable to assume that
strategies to lower the formation of apoptotic cells could be helpful in reducing the
intensity of LN symptoms.
Patient 491
Both, uMCP-1 and uP:C, levels are above the baseline during the whole flare cycle (Fig.
9, solid curves). But, as shown in Fig. 9A (dashed curves), increased corticosteroid dose 4
months before flare would control the inflammation and avoid clinical manifestations of
the renal flare. The significant increase of pro-inflammation could also be explained by
half-life differences, with the pro-inflammatory mediators having a much longer half-life
than the anti-inflammatory mediators. The initial anti-inflammatory therapy would have
better results if methods to lower the half-life of the pro-inflammatory mediators, μ
p
,
would have been also implemented (Fig. 9B, dashed curves).
Budu-Grajdeanu et al. Theoretical Biology and Medical Modelling 2010, 7:14
/>Page 15 of 20
Conclusions
Lupus nephritis is a chronic, relapsing-remitting autoimmune disease that damages the
kidneys. It is caused by immune complex/auto-antibody accumulation within the kid-
neys, resulting in inflammatory injury to the kidneys. Left untreated, LN causes kidney
failure that may necessitate dialysis or a kidney transplant. High doses of steroids and
immunosuppressive drugs, that globally suppress the immune system, are used in
patients with severe LN. Unfortunately, despite aggressive therapy only about 50% of LN
patients experience a complete or partial response by 6 months.
Figure 5 Fit of the model (solid curves) to experimental data (filled squares) collected from patients
enrolled in the Ohio SLE Study. (A) Patient 416; (B) Patient 444; (C) Patient 448; (D) Patient 491. Each pair of
graphs presents the pro-inflammatory mediators (P) (top panels, solid curve), and the tissue damage (D) (bot-
tom panels, solid curve) dynamics during flare cycle (6 months before and 4 months after the renal flare),
against the patient data (filled squares) on uMCP-1 and uP:C, respectively. The horizontal dotted lines mark the
baseline values determined at two different time points that were at least 6 months from any flare activity. The
solid curves are obtained by numerically solving Eqs. (2) and (3) with the parameters listed in Table 1 and Table
2. Parameter estimations were performed with the curve-fitting tool of Berkeley Madonna [20]. With few excep-
tions, the model simulations reproduce the experimental measurements around the renal flare. The difficulty
in exactly matching the simulations to the experimental data is due to the simplifications assumed when con-
structing the model; for example P reflects the overall activity of all pro-inflammatory mediators, rather then the
uMCP-1 dynamics alone.
-6m -4m -2m Flare +2m +4m
0
1
2
uMCP-1, P (P-units)
-6m -4m -2m Flare +2m +4m
Time (months)
1
3
5
uP:C, D (D-units)
-6m -4m -2m Flare +2m +4m
0
1
2
3
uMCP-1, P (P-units)
-6m -4m -2m Flare +2m +4m
Time (months)
0
4
8
uP:C, D (D-units)
-6m -4m -2m Flare +2m +4m
0
1
2
uMCP-1, P (P-units)
-6m -4m -2m Flare +2m +4m
Time (months)
0
2
4
6
uP:C, D (D-units)
-6m -4m -2m Flare +2m +4m
0
2
4
uMCP-1, P (P-units)
-6m -4m -2m Flare +2m +4m
Time (months)
0
2
4
6
uP:C, D (D-units)
AB
CD
Patient 416 Patient 444
Patient 448 Patient 491
Budu-Grajdeanu et al. Theoretical Biology and Medical Modelling 2010, 7:14
/>Page 16 of 20
Reasons for unsuccessful treatments include the complexity of the disease itself, the
lack of reliable outcome measures, a limited understanding of the pathogenesis of the
disease, the heterogeneity of the patient population, the unpredictable course of disease
in individual patients, and the lack of reliable biomarkers [21]. Consequently, to improve
LN outcome it is necessary to identify clinically relevant biomarkers that can provide
diagnostic, pathogenic and therapeutic information on each phase of the flare cycle.
Moreover, to accurately follow disease progression and impact the outcome, such bio-
markers need to be integrated into global LN-specific models of autoimmunity and
inflammation. These models can exhibit various outcomes and facilitate the understand-
ing of the complex interactions relevant to LN, adding to the statistical efforts that seek
correlations among various clinical data and outcomes in large patient populations.
Summary of paper
This is the first mathematical model that describes the chronic disease of LN in terms of
a dynamic system. Based on differential equations that describe the dynamics of immune
cells, pro- and anti-inflammatory mediators, and global tissue damage/dysfunction, this
model represents, in a simplified way, the complexity of interactions underlying disease
activity. Despite its simplicity, when calibrated with actual individual patient data sets,
the model qualitatively reproduces the observed clinical behavior for each patient, and
can be used to better understand disease mechanisms specific to each patient. Further-
more, by computational experiments in which inputs and parameters are varied, the
model provides a framework for future modeling opportunities related to LN. Specifi-
cally, the model may be used to evaluate therapeutic strategies for individual patients, or
a group of patients that share similar data patterns. Additionally, this may be a feasible
approach to personalizing care for LN patients.
Figure 6 Before flare interventions: simulations for patient 416. (A) Instead of decreasing the dose of cor-
ticosteroids and immunosuppressants at 2 months before flare (as shown in Fig. 1), maintaining the therapy
dosage lowers the levels of both pro-inflammation and damage; s
i
= 0.005 I-units day
-1
, s
id
= 0.015 I-units day
-1
,
s
a
= 0.05 A-units/day, at 2 months before flare (solid curves); s
i
= 0.001 I-units day
-1
, s
id
= 0.003 I-units day
-1
, s
a
=
0.1 A-units/day, at 2 months before flare (dashed curves). (B) Increasing the half-life of the anti-inflammatory
mediators by decreasing the decay rate μ
a
, also controls the inflammation wave; μ
a
= 2.2/day (solid curves); μ
a
= 1.1/day (dashed curves). All other parameters are as listed in Table 1 and Table 2.
-6m -4m -2m Flare +2m +4m
0
1
2
uMCP-1, P (P-units)
-6m -4m -2m Flare +2m +4m
Time (months)
1
3
5
uP:C, D (D-units)
-6m -4m -2m Flare +2m +4m
0
1
2
uMCP-1, P (P-units)
-6m -4m -2m Flare +2m +4m
Time (months)
1
3
5
uP:C, D (D-units)
AB
Budu-Grajdeanu et al. Theoretical Biology and Medical Modelling 2010, 7:14
/>Page 17 of 20
Figure 7 Before flare interventions: simulations for patient 444. (A) No drop in the anti-inflammatory ther-
apy 2 months before flare would keep pro-inflammation and damage low; s
a
= 2 A-units/day, 2 months before
flare (solid curves); s
a
= 4 A-units/day, 2 months before flare (dashed curves). (B) Therapeutic strategies aimed
at restricting immune complex infiltration into the kidneys and the production of more immune complexes as
a result of debris accumulation, could also improve disease symptoms; s
i
= 6 I-units/days, and s
id
= 1 I-units/days
(solid curves); s
i
= 3 I-units/days, and s
id
= 0.5 I-units/days (dashed curves). All other parameters are as listed in
Table 1 and Table 2.
-6m -4m -2m Flare +2m +4m
0
1
2
3
uMCP-1, P (P-units)
-6m -4m -2m Flare +2m +4m
Time (months)
0
4
8
uP:C, D (D-units)
-6m -4m -2m Flare +2m +4m
0
1
2
3
uMCP-1, P (P-units)
-6m -4m -2m Flare +2m +4m
Time (months)
0
4
8
uP:C, D (D-units)
AB
Figure 8 Before flare interventions: simulations for patient 448. (A) Worsening of LN symptoms is greatly
improved if the maintenance therapy is accompanied by an increase in anti-inflammatory therapy 2 months
before flare, with close results when the decision is delayed for 6 more weeks (results not shown); s
a
= 0.4 A-
units/day, 2 months before flare (solid curves); s
a
= 1.5 A-units/day, 2 months before flare (dashed curves). (B)
When the increase of the anti-inflammatory treatment is delayed 2 weeks before flare, parallel therapeutic strat-
egies aimed at faster removal of apoptotic cells greatly improves the outcome;, μ
d
= 0.03/day, and s
a
= 0.4 A-
units/day at 2 weeks before flare (solid curves); μ
d
= 0.1/day, and s
a
= 1.5 A-units/day at 2 weeks before flare
(dashed curves). All other parameters are as listed in Table 1 and Table 2.
-6m -4m -2m Flare +2m +4m
0
1
2
uMCP-1, P (P-units)
-6m -4m -2m Flare +2m +4m
Time (months)
0
2
4
6
uP:C, D (D-units)
-6m -4m -2m Flare +2m +4m
0
1
2
uMCP-1, P (P-units)
-6m -4m -2m Flare +2m +4m
Time (months)
0
2
4
6
uP:C, D (D-units)
AB
Budu-Grajdeanu et al. Theoretical Biology and Medical Modelling 2010, 7:14
/>Page 18 of 20
Model usefulness
Our computational experiments reproduce many observations characteristic of LN dis-
ease progression, and support the hypothesis that inflammation plays an important role
in LN dynamics and flare severity. In light of our simulations, it is reasonable to assume
that therapies aimed at controlling inflammation and/or balancing the activity of anti-
and pro-inflammatory mediators could improve the treatment outcome for LN patients.
Furthermore, extended versions of the model could be used to computationally test the
outcome of manipulating the chemokine network in experimental murine models of SLE
nephritis [9], and simulations may also point to novel potential biomarkers to evaluate
disease mechanisms and the response to therapy.
We have also shown with this model, in a number of clinical cases, how continuous
deposition of immune complexes into the kidney can lead to persistent inflammation
and subsequent tissue damage. This suggests that successful therapies may be aimed at
controlling both immune complex formation/deposition, and the pro-inflammatory
response. Timing and combination of various therapies may be important, and models
like ours are cost-efficient ways to test different protocols in a timely manner.
Rather than predicting a flare, we suggest that close monitoring of biomarkers such as
uMCP-1 and uP:C, in conjunction with the mathematical model, can provide pathogenic
(disease evolution) and therapeutic (response to treatment) information that can be used
to further guide interventions to decrease inflammation and tissue damage before more
harm occurs. If a flare cannot be avoided, the model calibrated to pre-flare patient data
could be used to learn particulars about disease dynamics, point towards causes and
solutions, test possible therapies and compare outcomes, improve and shorten treatment
decision making process. As individual flares are different, information from previous
flares may not be very useful to treat future flares. Fortunately, our mechanistic mathe-
Figure 9 Before flare interventions: simulations for patient 491. (A) A larger increase of the corticosteroid
dose 4 months before flare would control the inflammation and avoid clinical manifestations of the renal flare;
s
a
= 1.2 A-units/day 4 months before flare (solid curves); s
a
= 2 A-units/day 4 months before flare (dashed
curves). (B) The initial anti-inflammatory therapy would have better results if methods to lower the half-life of
the pro-inflammatory mediators, μ
p
, could also be implemented; μ
p
= 0.33/day (solid curves), and μ
p
= 0.66/day
(dashed curves). All other parameters are as listed in Table 1 and Table 2.
-6m -4m -2m Flare +2m +4m
0
2
4
uMCP-1, P (P-units)
-6m -4m -2m Flare +2m +4m
Time (months)
0
2
4
6
uP:C, D (D-units)
-6m -4m -2m Flare +2m +4m
0
2
4
uMCP-1, P (P-units)
-6m -4m -2m Flare +2m +4m
Time (months)
0
2
4
6
uP:C, D (D-units)
AB
Budu-Grajdeanu et al. Theoretical Biology and Medical Modelling 2010, 7:14
/>Page 19 of 20
matical model is particularly useful in such cases, as model equations (interactions) do
not change, only model parameters (strength of interactions) vary to reflect new data
(evolution of the disease and therapy). Maybe most important, the way parameters are
estimated (i.e. for each set of data we choose the set of parameters for which simulations
are closest to that clinical data), makes the model equally applicable to analyzing individ-
ual patient data, as well as data collected from a larger patient population. Although our
goal is to identify strategies that would result in the best outcome for each individual
patient, optimizing clinical trial design (e.g. identifying administration strategies for the
entire cohort, help with patient selection given a treatment administration regimen)
constitutes another potential application of our simulations.
Model extensions
While we may not have captured all parameters accurately, the assumptions on which
the model is based are biologically reasonable, and the results are a good fit with clinical
data. However, in this first, simplified model, other relevant components of the immune
system (antigens, antigen presenting cells, T cells, B cells) and inflammatory system
(pro-inflammatory mediators like serum MCP-1, TNF-α, IL-1, and anti-inflammatory
mediators like IL-10, TGF-β) are not included. In future studies, an extended model
would include details on the activation of T cells by APC, recruitment of phagocytes and
activation and regulation of the complement system. Future refinements of the model
could also consider relations balancing anti-inflammatory vs. pro-inflammatory media-
tors (cells, cytokines) and the importance of these interactions in defining the disease
dynamics (remission, flare). Drugs could also be added as separate variables to the
model, and time-dependent protocols for administering the drugs could be explored.
Competing interests
The authors declare that they have no competing interests.
Authors' contributions
PBG, RCS and AF formulated the model equations and wrote the manuscript. PBG performed the numerical calculations.
DJB and BHR were consulted on the model during the preparation of the paper, and all authors read and approved the
manuscript.
Acknowledgements
This work was supported by the National Science Foundation under Agreement No. 0112050, and R01DK074661 from the
NIDDK.
Author Details
1
Mathematical Biosciences Institute, Ohio State University, Columbus OH 43210, USA,
2
Department of Mathematics,
Western Kentucky University, Bowling Green KY 42101, USA,
3
Department of Mathematics, Ohio State University,
Columbus OH 43210, USA and
4
Department of Internal Medicine, Division of Nephrology Ohio State University College of
Medicine, Columbus OH 43210, USA
References
1. Moroni G, Banfi G, Ponticelli C: Clinical status of patients after 10 years of lupus nephritis. Q J Med 1992,
84:681-689.
2. Moroni G, Quaglini S, Maccario M, Banfi G, Ponticelli C: Nephritic flares are predictors of bad long-term renal
outcome in lupus nephritis. Kidney Int 1996, 50:2047-2053.
3. Wallace DJ, Hahn BH, Klippel JH: Lupus nephritis. In Dubois Lupus Erythematosus Edited by: Wallace DJ, Hahn BH.
Baltimore: Williams and Wilkins; 1997:1053-1065.
4. Lewis EJ, Schwartz MM, Korbet SM: Severe lupus nephritis: importance of re-evaluating the histologic
classification and the approach to patient care. J Nephrol 2001, 14:223-227.
5. Churg J, Sobin L: Renal disease: classification and atlas of glomerular diseases New York-Tokyo: Igaku-Shoin; 1982:127.
6. Rovin BH, Song H, Birmingham DJ, Hebert LA, Yu CY, Nagaraja HN: Urine chemokines as biomarkers of human SLE
activity. J Am Soc Nephrol 2005, 16:467-473.
7. Rovin BH, Song H, Hebert LA, Nadasdy T, Nadasdy G, Birmingham DJ, Yu CY, Nagaraja HN: Plasma, urine, and renal
expression of adiponectin in human systemic lupus erythematosus. Kidney Int 2005, 68:1825-1833.
Received: 29 December 2009 Accepted: 17 May 2010
Published: 17 May 2010
This article is available from: 2010 Budu-Grajdeanu et al; licensee BioMed Central Ltd. This is an Open Access article distributed under the terms of the Creative Commons Attribution L icense ( which permits unrestricted use, distribution, and reproduction in any medium, provided the original work is properly cited.Theoretical Biology and Medical Modelling 2010, 7:14
Budu-Grajdeanu et al. Theoretical Biology and Medical Modelling 2010, 7:14
/>Page 20 of 20
8. Rovin BH, Birmingham DJ, Nagaraja HN, Yu CY, Hebert LA: Biomarker discovery in human SLE nephritis. Bull NYU
Hosp Jt Dis 2007, 65(3):187-193.
9. Rovin BH: The chemokine network in systemic lupus erythematous nephritis. Front Biosci 2008, 1(13):904-922.
10. Hebert LA: The clearance of immune complexes from the circulation of man and other primates. Am J Kidney Dis
1991, 17:352-361.
11. Birmingham DJ, Hebert LA: CR1 and CR1-like: The primate immune adherence receptors. Immunol Rev 2001,
180:100-111.
12. Tsokos GC: Exploring complement activation to develop biomarkers for systemic lupus erythematosus. Arthritis
Rheum 2004, 50:3404-3407.
13. Bauer JW, Petri M, Batliwalla FM, Koeuth T, Wilson J, Slattery C, Panoskaltsis-Mortari A, Gregersen PK, Behrens TW,
Baechler EC: Interferon-regulated chemokines as biomarkers of systemic lupus erythematosus disease activity: a
validation study. Arthritis Rheum 2009, 60(10):3098-107.
14. Iwami S, Takeuchi Y, Miura Y, Sasaki T, Kajiwara T: Dynamical properties of autoimmune disease models: Tolerance,
flare-up, dormancy. J Theor Biol 2007, 246:646-659.
15. de Boer RJ: Theoretical Biology Utrecht University; 2005.
16. de Boer RJ: Modeling population dynamics: A graphical approach Utrecht University; 2006.
17. Goris RJ, Te Boekhorst TP, Nuytinck JK, Gimbrere JS: Multiple-organ failure. Generalized autodestructive
inflammation? Arch Surg 1985, 120:1109-1115.
18. Takala A, Jousela I, Jansson SE, Olkkola KT, Takkunen O, Orpana A, Karonen SL, Repo H: Markers of systemic
inflammation predicting organ failure in community-acquired septic shock. Clin Sci London 1999, 97:529-538.
19. Reynolds A, Rubin J, Clermont J, Day J, Vodovotz Y, Ermentrout B: A reduced mathematical model of the acute
inflammatory response: I. derivation of model and analysis of anti-inflammation. J Theor Biol 2006, 242:220-236.
20. Macey RI, Oster GF, Zahnley T: Berkeley Madonna, version 8.0.2 Berkeley, CA: University of California at Berkeley; 2009.
21. Eisenberg R: Why can't we find a new treatment for SLE? J Autoimmun 2009, 32(3-4):223-230.
doi: 10.1186/1742-4682-7-14
Cite this article as: Budu-Grajdeanu et al., Mathematical framework for human SLE Nephritis: disease dynamics and
urine biomarkers Theoretical Biology and Medical Modelling 2010, 7:14