Báo cáo y học: " Research Transperineal prostate biopsy: analysis of a uniform core sampling pattern that yields data on tumor volume limits in negative biopsies" pdf
Bạn đang xem bản rút gọn của tài liệu. Xem và tải ngay bản đầy đủ của tài liệu tại đây (2.11 MB, 13 trang )
© 2010 Kepner and Kepner; licensee BioMed Central Ltd. This is an Open Access article distributed under the terms of the Creative Com-
mons Attribution License ( which permits unrestricted use, distribution, and reproduction
in any medium, provided the original work is properly cited.
Kepner and Kepner Theoretical Biology and Medical Modelling 2010, 7:23
/>Open Access
RESEARCH
Research
Transperineal prostate biopsy: analysis of a uniform
core sampling pattern that yields data on tumor
volume limits in negative biopsies
Gordon R Kepner*
1
and Jeremy V Kepner
2
Abstract
Background: Analyze an approach to distributing transperineal prostate biopsy cores that
yields data on the volume of a tumor that might be present when the biopsy is negative,
and also increases detection efficiency.
Methods: Basic principles of sampling and probability theory are employed to analyze a
transperineal biopsy pattern that uses evenly-spaced parallel cores in order to extract
quantitative data on the volume of a small spherical tumor that could potentially be
present, even though the biopsy did not detect it, i.e., negative biopsy.
Results: This approach to distributing biopsy cores provides data for the upper limit on the
volume of a small, spherical tumor that might be present, and the probability of smaller
volumes, when biopsies are negative and provides a quantitative basis for evaluating the
effectiveness of different core spacing distances.
Conclusions: Distributing transperineal biopsy cores so they are evenly spaced provides a
means to calculate the probability that a tumor of given volume could be present when
the biopsy is negative, and can improve detection efficiency.
Background
While transrectal continues to be the predominant prostate biopsy approach, there is
increasing interest in the transperineal approach either initially, or following a negative
transrectal biopsy. Biopsy results are categorized as all or none, either a tumor is found, or
not which is the most likely outcome [1]. Rebiopsies bring additional cost and stress. Given
the frequency of negative biopsies, it is assumed there would be interest in examining the
question: how can a negative transperineal biopsy extract quantitative information about
the potential presence of an undetected tumor volume? This theoretical analysis will dem-
onstrate the utility of adapting current transperineal biopsy protocols to one that uses uni-
formly distributed parallel cores. It is shown that such a protocol increases the efficiency of
detecting tumors. Further, if the biopsy is negative, this approach yields quantitative data
that sets limits on the volume for small spherical tumors that might be present, but unde-
tected. This is of value because tumor volume is a factor in evaluating the potential for a
clinically significant cancer to be present. It can help to reduce the over treating of small
cancers.
* Correspondence:
1
Membrane Studies Project,
Minneapolis, Minnesota, USA
Full list of author information is
available at the end of the article
Kepner and Kepner Theoretical Biology and Medical Modelling 2010, 7:23
/>Page 2 of 13
To our knowledge, no prostate biopsy protocol in current use (transperineal or tran-
srectal) has shown how to obtain quantitative data on tumor volume whether the
biopsy is positive or negative. The analysis supports further investigation of this alterna-
tive to the random systematic protocols for transperineal biopsy. These currently offer
no basis for quantitative evaluation of the tumor volume, even if detected by a biopsy
core. For positive biopsy results, the key issue becomes the Gleason grade of the tumor
sample, which strongly influences the next clinical decision.
Methods
Mathematical modeling of prostate biopsies has supported the basic principle that more
cores can increase the tumor detection probability [2-4]. (For an alternative perspective,
see [5,6].) These models did not address the question of what information might be
obtained from a negative biopsy. An analytic approach to systematic transperineal
biopsy is presented. It assumes, for example, a suitable brachytherapy template and
ultrasound guidance are used to deploy a uniform grid of evenly-spaced parallel cores
[7]. A recent computer-simulated study of transperineal biopsy described use of a grid
pattern of evenly-spaced cores to detect tumor [8]. That idea is extended here by a math-
ematical analysis that shows how such a pattern enables one to calculate the probability
that a small spherical tumor could still be present when biopsies are negative. This math-
ematical analysis of the transperineal technique relies on a model of the biopsy cores and
a model of the tumor.
The biopsy core model employs a grid pattern of evenly-spaced transperineal point
cores, shown perpendicular to the transverse cross-section. (The analysis also considers
the case of a finite core with radius R
c
; see Appendix.) One key parameter of the model is
the spacing between the cores, S, measured in cm. Depending on prostate size, and the
effective cutting length of the biopsy needle, it could require two biopsy cores, stacked
end to end, to sample adequately a grid point along a length from apex to base [8].
Because the analysis focuses on detecting smaller tumor volumes, they are modeled as
spheres as others have done [2-4]. The other key parameter is therefore the tumor
diameter, D
T
, in cm. Define the ratio of these parameters as n ? tumor diameter/core
spacing = D
T
/S.
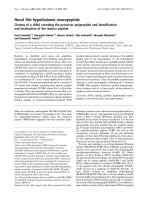
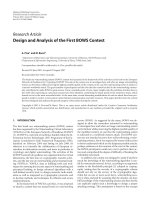
Combining the models, one can estimate the largest tumor that could fit between the
biopsy cores and avoid detection (see Figure 1A). The diameter of the largest undetected
spherical tumor is related to the core spacing. The largest tumor that fits between the
biopsy cores can do so only if its center lies exactly halfway between the cores. Smaller
tumors are harder to detect because there are more places where they might lie between
the cores. Figure 1B illustrates the locations where the center of a spherical tumor might
be detected, versus undetected. If the tumor center is within D
T
/2 of a biopsy core, the
tumor will intersect the core and be detected. As tumor diameter increases, the effective
detection volume of the quarter-cylinders also expands, thereby reducing the available
volume wherein the tumor can lie undetected. The mathematical analysis of this uniform
transperineal core pattern calculates the probability that a spherical tumor of a given
diameter and volume will be detected, based on the ratio of the volume of the locations
where it would be detected to the total volume between the cores (see Appendix). If this
biopsy pattern yields a positive core, it does not, however, enable one to quantitate tumor
volume or tumor volume probabilities.
Kepner and Kepner Theoretical Biology and Medical Modelling 2010, 7:23
/>Page 3 of 13
Note that this analysis is independent of the relative frequency of tumor distribution
within the various zones of the prostate. The uniform grid of cores is searching for tumor
volume. It does not matter if the tumor volumes are distributed preferentially in one
zone or another, because the analysis provides a detection probability value for all
tumors of a given volume, regardless of where they reside. The uniform core spacing also
maximizes this detection efficiency for each core. Note that a negative biopsy doesn't
indicate either tumor absence or tumor presence. Essentially, a negative biopsy estab-
lishes nothing certain; it is indeterminate as to the presence of tumor. No current biopsy
protocol, of which we are aware, produces a quantitative value for tumor volume in the
event of a positive biopsy. The analysis here shows how a redesigned transperineal
biopsy protocol can yield quantitative data on tumor volume when the biopsy is negative.
Results
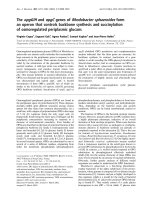
Figure 1A and Figures 2A and 2B clarify the relation between a uniformly-spaced grid of
point cores and the largest spherical tumor volume that could, potentially, go undetected
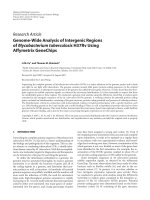
by the biopsy cores. It has been implied that the core spacing, S, defines the diameter of
this tumor [9,10]. In fact, as shown by the circumscribed circle in Figure 2A, it is S =
D
T
that defines this spherical tumor's diameter. Thus, V
T
= (0.5236) ( S)
3
is signifi-
cantly larger than V
T
= (0.5236) S
3
, by a factor of 2.8.
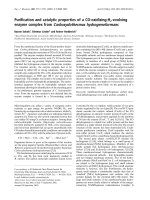
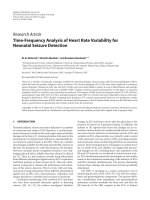
The probability of detection (PoD) is given by Appendix equation A1, rewritten here
using the effective core spacing for a finite core, s ? S - R
c
. Then set n = D
T
/s = tumor
diameter/effective core spacing (see Figures 3A and 3B). When R
c
is zero, point core,
then s ? S gives the point core case, and now n = D
T
/S. Thus, for n ≤ 1, then D
T
/s ≤ 1,
2
2
2
Figure 1 A. A 3D cutout view of a prostate showing the maximum spherical tumor that can avoid de-
tection in a uniform grid of cores with spacing, S, between core centers. B. The grey quarter-cylinders de-
note the volume in which a small spherical tumor of diameter D
T
would be detected.
Kepner and Kepner Theoretical Biology and Medical Modelling 2010, 7:23
/>Page 4 of 13
PoD
T
=⋅
⎛
⎝
⎜
⎞
⎠
⎟
=⋅(. ) (. )0 785 0 785
2
2
D
s
n
(1)
Figure 2 A. Four evenly-spaced point cores with S cm spacing between cores. The circumscribed circle
depicts that largest spherical tumor, of diameter D
T
= S, that just grazes the point core. These contact
points form a detection square, with sides S. B. Point core detection quadrant geometry, where D
T
/2 is the ra-
dius of a generalized tumor, superimposed on this detection quadrant.
2
Figure 3 A. Four evenly-spaced finite cores (not to scale), of radius R
c
, where the spherical tumor con-
tact points with the edges of the finite cores form a detection square with sides, s ? S - R
c
. B. Finite
core detection geometry where s ? S - R
c
.
2
2
Kepner and Kepner Theoretical Biology and Medical Modelling 2010, 7:23
/>Page 5 of 13
When n ≥ 1, see equation A7,
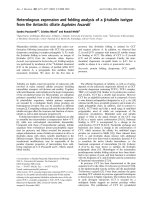
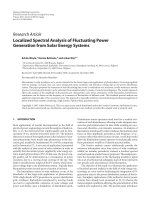
Figure 4 is based on calculations using equations (1) and (2). It presents the relation
between tumor volume, V
T
, and the probability of detection, PoD, for different finite
core spacings. It demonstrates quantitatively the effect that decreasing core spacing has
on increasing the probability of detection, at any tumor volume.
Figure 4 also shows the upper limits on tumor volume that could be missed, at differ-
ent values of the spacing for the finite core center. For example, if core spacing S = 1 cm,
then a tumor volume of V
T
= 1 cm
3
has a probability of detection that is greater than 99%.
As developed in the Appendix, the finite core increases the probability of detection rel-
ative to the point core, at each tumor volume, see Figure 5. This effect is more pro-
nounced as the core spacing, S, decreases. The fixed value of the finite core radius, R
c
, is
increasing relative to the decreasing value of the core spacing.
A grid of evenly-spaced cores is shown in Figure 6, with an enlarged prostate superim-
posed on the grid. For a given core spacing, a larger prostate will require more cores than
a smaller prostate. The edge effect means that a biopsy core need not be placed closer
than S/2 from the edge. Lines aa' and bb' (Figure 6) illustrate how the edge effect reduces,
by one, the number of cores needed. The effect can also reduce the length to be sampled,
by stopping short of the edge of the base. Thus, while extending biopsy core sampling
close to boundaries is useful, it is not essential to come closer than S/2 to the boundary
for the purpose of this analysis.
Bearing in mind the edge effect, an initial estimate of the number of cores needed is
given by (N
c
)
est
= (transverse width/S) (transverse depth/S), see Figure 6. This estimate is
refined by determining which (if any) of the grid points will require two cores stacked
end to end along the apex-to-base sampling length. For example, let S = 1.2 cm, and con-
sider a prostate with transverse width and depth both equal to 4.8 cm (this corresponds
to the enlarged prostate shown in Figure 6). In this case (N
c
)
est
= (4.8/1.2) ( 4.8/1.2) = 16
cores. Assume only the eight grid points closest to the midline would each need two end
to end cores. Therefore, the number of cores needed is N
c
= 16 + 8 = 24. In practice,
adjustments based on the ultrasound-measured dimensions and actual shape of the
prostate will be needed to establish N
c
. For the largest prostates, increased values of S
will be required to keep N
c
at a manageable number. There is a basic trade-off with
increasing S. It reduces (N
c
)
est
by 1/S
2
, but increases undetected tumor volume as S
3
. This
is a strong incentive for making S as small as practicable, for the given prostate volume.
The approach developed here for distributing biopsy cores combines the available
cores from an initial transperineal biopsy with those that could be available for a trans-
perineal rebiopsy; call this total number of cores N
t
. Thus, one can plan in advance for
distributing these cores, using the evenly spaced grid pattern, throughout the entire
PoD =− +⋅⋅()nn
2
1
2
2
1
360
p
Θ
(2)
=
⎛
⎝
⎜
⎞
⎠
⎟
−
⎡
⎣
⎢
⎢
⎤
⎦
⎥
⎥
+⋅ ⋅
⎛
⎝
⎜
⎞
⎠
⎟
D
s
D
s
TT
2
1
2
2
1
360
p
Θ
(3)
Kepner and Kepner Theoretical Biology and Medical Modelling 2010, 7:23
/>Page 6 of 13
prostate but using just N
t
/2 cores at each biopsy. Assume that no significant difference
in tumor distribution appears on either side of the midline [11-13]. Using evenly spaced
cores, place N
t
/2 of the available cores into one side of the midline at the initial biopsy
(see Figure 6). If negative, place N
t
/2 cores into the other side at the rebiopsy. The advan-
tages of this approach to distributing the N
t
cores are developed in the Discussion.
Discussion
The ability to extract, via direct mathematical analysis, quantitative information on
potential tumor volumes from a transperineal biopsy that gives a negative result expands
Figure 4 Probability of detection versus tumor volume for different spacings of the finite core centers,
from S= 0.5 cm to S= 1.2 cm. The effective core spacing is s = S - R
c
in each case. for n < 1, see equation
(1), and for n > 1, see equation (2). The dashed line at PoD = 78.5% identifies where n = 1.
2
Kepner and Kepner Theoretical Biology and Medical Modelling 2010, 7:23
/>Page 7 of 13
the clinical utility of the transperineal approach when used with an evenly spaced sam-
pling grid of parallel cores. Increasing interest in this approach is leading to improved
techniques and the recognition that it can provide thorough sampling of the entire pros-
tate [14-18]. Computer simulation studies are also contributing new insights into the
transperineal technique [11,19].
This quantitative information would be relevant to any clinical decision about what to
do (watchful waiting, rebiopsy, intervention) following such biopsies. Figure 4 gave the
probability of detection for a tumor volume, at different core spacings, when biopsies are
negative. It offers a quantitative tool to help determine the template spacing options for
placing the cores in a template-guided transperineal biopsy, and the number of cores
needed, vis-a-vis the probability of detecting (or excluding) what one considers to be a
Figure 5 Probability of detection versus tumor volume, comparing the point core and finite core cases,
for S = 1.0 cm and s = 0.929 cm, using equations (A1) and (A7). The dashed line at PoD = 78.5% identifies
where n = 1.
Kepner and Kepner Theoretical Biology and Medical Modelling 2010, 7:23
/>Page 8 of 13
clinically relevant tumor volume. It also demonstrates the increased efficiency of individ-
ual cores, when used in a uniform distribution pattern.
The relation involving tumor volume, core spacing, and the probability of detection is
complex. This analysis leads to equations that quantify this relation and to Figure 4,
which illustrates it in a practical way. Note that the analysis does not apply in the case of
a positive biopsy. We are unaware of any work that provides an analysis of tumor volume
for a positive biopsy, where now the primary clinical consideration becomes the Gleason
grade of the tumor sample.
This approach differs from current studies aimed at using imaging techniques and
sophisticated algorithms to locate, and identify positively, tumor sites. Such studies, in
some instances, also attempt to estimate tumor volume. Current views suggest the need
for further study to establish their clinical utility. Similarly, this paper seeks to motivate
Figure 6 Uniform grid for cores spaced S cm apart, with a transverse-plane section approximating an
enlarged prostate, shown centered on the midline. Open circles represent initial biopsy cores. Open
squares represent repeat biopsy cores. Lines aa' and bb' illustrate the edge effect.
Kepner and Kepner Theoretical Biology and Medical Modelling 2010, 7:23
/>Page 9 of 13
researchers to consider the advantages offered by this theoretical model for template-
guided transperineal biopsies and develop their technique to test it.
The approach developed here for distributing biopsy cores overcomes problems with
the systematic random biopsy approach, where the cores distributed throughout the
prostate do not sample equal-sized regions producing undersampling and oversam-
pling. This reduces the detection efficiency of each core and increases, especially, the
chances of missing a large tumor. Additionally, if a rebiopsy is needed, it is difficult to
identify where the initial biopsy cores were taken throughout the entire prostate, again
leading to undersampling and oversampling with reduced efficiency per core for the
rebiopsy cores [10]. Our view of the biopsy protocol literature is that there is little con-
sensus about the number and placement pattern of cores. The evenly spaced cores maxi-
mize each core's detection efficiency. Assume the initial biopsy cores, which were placed
evenly on one side of the midline, are negative (no tumor detected). One then places all
the rebiopsy cores evenly on the other side of the midline (Figure 6). This concept, by
itself, holds equally well whether doing transperineal or transrectal biopsies. There have
been no studies comparing the random to the uniform biopsy core pattern.
Biopsy technique also needs to focus on accurate template-guidance and the three
dimensional approach because " cores arrayed in three dimensions are superior to ran-
domly distributed cores for detecting cancer." [5]
A uniform transperineal biopsy core grid pattern, as described here, has yet to be
implemented. The mathematical analysis presented in this paper shows how to extend
the usefulness of such biopsies, when negative, by providing quantitative data on the
potential tumor volume that could be present. Assuming that the small tumors are
spherical is a possible limitation, though common in theoretical modeling [2-4]. The
transperineal biopsy technique requires adaptations to make use of the approach
described here, such as the technical facility to place two cores stacked end to end that
can sample adequately the apex-to-base distance, in larger prostates. Developing longer
effective cutting lengths for biopsy needles would be helpful. Further development of
template grid technology and magnetic resonance guiding for this biopsy approach is
needed, to provide accurate three-dimensional prostate imaging along with reproducible
guidance and tracking of the biopsy needles. This could entail the use of a robotic device
to control the direction and uniformity of needle placement, as well as limiting needle
deflection problems that can affect the ability to produce parallel cores, as assumed in
the model [15-18,20-24].
The use of evenly spaced cores leads to a quantitative definition for the concept of sat-
uration biopsy [25,26]. Saturation is defined by the value of S used in these biopsies. The
lower this value, the higher the saturation. Thus, S is a singular measure of saturation
that incorporates both the number of cores used and the prostate volume. With the
transperineal biopsy approach, the evenly spaced cores can be located accurately with
reference to the apex as the origin of a three-dimensional coordinate system [16]. This
offers the possibility of unique comprehensive cancer mapping and facilitates compara-
tive analysis of tumor detection data obtained from various sources and prostates [27-
29].
Conclusions
Each feature of this transperineal biopsy approach the use of evenly spaced parallel
cores, and sampling on one side of the midline initially offers advantages for improving
Kepner and Kepner Theoretical Biology and Medical Modelling 2010, 7:23
/>Page 10 of 13
the ability of prostate biopsies to detect tumor and to extract useful data, on the potential
volume of an undetected tumor, from a negative biopsy.
Appendix
This analysis starts by asking, what is the largest spherical tumor volume that could fit
between the cores (Figures 1A, B), and so go undetected at the transperineal biopsy?
Conversely, the tumor volume that could always be detected is therefore only marginally
larger than this largest undetected tumor volume. Thus, within limits inherent in this
analysis, these volumes are virtually the same, for practical purposes.
The case of point cores will be analyzed and compared to the case of finite cores, with
biopsy needle radius of R
c
. The point core case (Figure 2A) has a detection square with
sides S cm. The inscribed circle tumor, and smaller tumors, are completely within this
detection square. Tumors with larger diameters, up to the diameter of the circumscribed
circle, are not completely within the square. Each of these conditions requires a different
equation for calculating the Probability of Detection (PoD).
In the case of the finite cores (Figure 3A), the detection square is reduced by the finite
core. The effective core spacing parameter becomes s = S - R
c
. The equations for the
finite core case are the same as for the point core case, with S replaced by s. Figure 3A
shows the tumor circle that just touches the inner edge of the four finite cores is posi-
tioned exactly at the center of the square grid formed by these four points of contact. In
this position, it would go undetected. At virtually any other placement, it intersects at
least one core and is very likely to be detected. This circle is defined, for the purposes of
this analysis, as the smallest tumor volume that will have an effective PoD of 1.0. The
analysis will show that even somewhat smaller volumes can have PoD values ≥ 0.99, and
therefore are virtually certain to be detected. The tumor shown in Figure 3A has diame-
ter D
T
= S - 2 R
c
. Any tumor with a greater diameter will be detected.
Consider the inscribed tumor circle (Figure 2A). The quarter-cylinder detection vol-
umes (Figures 1A, B), do not overlap and the PoD is given by
The numerator is the volume of the four quarter-cylinders, i.e., equivalent to one cylin-
der of diameter, D
T
, and height, h. The denominator is the volume of a rectangular block
with base, S
2
, and height, h. Thus, when D
T
= S, the PoD = 0.785. For this case, n = D
T
/S≤
1.
When D
T
>S, the quarter-cylinder detection volumes will partially overlap one another.
As shown above, h cancels. This reduces the problem to a two-dimensional calculation
involving just the relative areas. Figure 2B depicts a quadrant of the total detection area,
S
2
, for one point core in terms of a tumor radius, D
T
/2. The PoD is calculated from the
ratio of that part of the core's detection area (2 A
1
+ A
sec
) that actually overlaps with the
quadrant area (S/2)
2
. Set the ratio of the key parameters D
T
/S = n, where 1.0 ≤ n ≤ , to
simplify the calculation. Define the probability of detection as
2
2
PoD
Detection Volume
Total Volume Between Cores
T
==
⋅⋅(/)
p
4
2
Dh
SSh
D
S
2
0 785
2
⋅
=⋅
⎛
⎝
⎜
⎞
⎠
⎟
(. )
T
(A1)
2
Kepner and Kepner Theoretical Biology and Medical Modelling 2010, 7:23
/>Page 11 of 13
given
therefore
given
so
For the finite core case, replace S with s ? S - R
c
(see Figure 3B).
The steps in the calculation when n ≥ 1.0 are:
1. Choose S, in cm.
2. Set R
c
= 0.05 cm.
3. Calculate s = S - R
c
.
4. Choose a range of values for V
T
and calculate the corresponding D
T
.
5. Calculate n = D
T
/S, or D
T
/s.
PoD
( / 2)
2
=
⋅+2
1
AA
S
sec
(A2)
A
SD S
1
22
1
2
1
22 2 2
=⋅⋅
⎛
⎝
⎜
⎞
⎠
⎟
−
⎛
⎝
⎜
⎞
⎠
⎟
⎡
⎣
⎢
⎢
⎤
⎦
⎥
⎥
T
(A3)
2
2
4
1
1
2
1
2
⋅= ⋅ −A
S
n()
(A4)
A
D
sec
T
2
=⋅
⎛
⎝
⎜
⎞
⎠
⎟
⋅
p
2
360
Θ
(A5)
=⋅
⎛
⎝
⎜
⎜
⎞
⎠
⎟
⎟
⋅⋅
p
S
n
2
360
2
4
Θ
(A6)
PoD (
2
=− +⋅⋅nn1
360
1
2
2
)
p
Θ
(A7)
Sin
Chord length
2
T
2
Θ
2
⎛
⎝
⎜
⎞
⎠
⎟
=÷
D
(A8)
Chord length 2
T
=⋅−⋅ −
()
⎡
⎣
⎢
⎤
⎦
⎥
S
DS
2
1
2
22
1
2
(A9)
Sin
Θ
2
1
2
1
1
2
2
⎛
⎝
⎜
⎞
⎠
⎟
=
−−
⎡
⎣
⎢
⎤
⎦
⎥
⋅
()n
n
(A10)
2
2
Kepner and Kepner Theoretical Biology and Medical Modelling 2010, 7:23
/>Page 12 of 13
6. Using the value of n, calculate sin (Θ/2) and obtain Θ°.
7. Using n and Θ°, calculate the Probability of Detection from equation (A7), for each
tumor volume.
Figure 5 shows that the finite core increases PoD, at a given tumor volume, versus the
point core. For n ≤ 1, equation (A1) becomes
Thus, for S = 1.0 cm and s = 0.929 cm, this ratio is 1.16. Whereas, for S = 0.8 cm, the
ratio is 1.20. Therefore, for n ≤ 1, as S decreases, this ratio increases. As expected, the
finite core increases PoD, relative to the point core. For n > 1, this is also the case. How-
ever, as PoD values approach 100%, the probability of detection converges (see Figure 5).
Competing interests
The authors declare that they have no competing interests.
Authors' contributions
Both authors made contributions to each aspect of the paper. Both authors have read and approved the paper.
Author Details
1
Membrane Studies Project, Minneapolis, Minnesota, USA and
2
Computer Science and Artificial Intelligence Laboratory,
Massachusetts Institute of Technology, Cambridge, Massachusetts, USA
References
1. Presti JC Jr: Current trends in biopsy techniques. In Management of Prostate Cancer 2nd edition. Edited by: Klein EA.
Totowa, NJ: Humana; 2004:143-155.
2. Vashi AR, Wojno KJ, Gillespie B, Oesterling JE: A model for the number of cores per prostate biopsy based on
patient age and prostate gland volume. J Urol 1998, 159:920-924.
3. Karakiewicz PI, Hanley JA, Bazinet M: Three-dimensional computer-assisted analysis of sector biopsy of the
prostate. Urology 1998, 52:208-212.
4. Serfling R, Shulman M, Thompson GL, Xiao Z, Benaim E, Roehrborn CG, Rittmaster R: Quantifying the impact of
prostate volumes, number of biopsy cores and 5α - reductase inhibitor therapy on the probability of prostate
cancer detection using mathematical modeling. J Urol 2007, 177:2352-2356.
5. Andriole G: Pathology: The lottery of conventional prostate biopsy. Nat Rev Urol 2009, 6:188-189.
6. Delongchamps NB, de la Roza G, Jones R, Jumbelic M, Haas GP: Saturation biopsies on autopsied prostates and
characterizing prostate cancer. BJU Int 2009, 103:49-54.
7. Igel TC, Knight MK, Young PR, Wehle MJ, Petrou SP, Broderick GA, Marino R, Parra RO: Systematic transperineal
ultrasound guided template biopsy of the prostate in patients at high risk. J Urol 2001, 165:1575-1579.
8. Crawford ED, Wilson SS, Torkko KC, Daisaku H, Stewart JS, Brammell C, Wilson RS, Kawata N, Sullivan H, Lucia MS,
Werahera PN: Clinical staging of prostate cancer: a computer-simulated study of transperineal prostate biopsy.
BJU Int 2005, 96:999-1004.
9. Onik G, Barzell M: Transperineal 3D mapping biopsy of the prostate: An essential tool in selecting patients for
focal prostate therapy. Urol Oncol 2008, 26:506-510.
10. Li H, Yan W, Zhou Y, Ji Z, Chen J: Transperineal ultrasound-guided saturation biopsy using 11-region template of
prostate: Report of 303 cases. Urology 2009, 70:1157-1161.
11. Opell MB, Zeng J, Bauer JJ, Connelly RR, Zhang W, Sesterhenn IA, Mun SK, Moul JW, Lynch JH: Investigating the
distribution of prostate cancer using three-dimensional computer simulation. Prostate Cancer Prostatic Dis 2002,
5:204-208.
12. Brossner C, Winterholter A, Roehlich M, Diouhy-Schutz E, Serra V, Sonnleithner M, Grubmiller K, Plummer K, Schuster
E: Distribution of prostate carcinoma foci within the peripheral zone: analysis of 8062 prostate biopsy cores.
World J Urol 2003, 21:163-166.
13. Djavan B, Margreiter M: Biopsy standards for detection of prostate cancer. World J Urol 2007, 25:11-17.
14. Fichtinger G, DeWeese TL, Patriciu A, Tanacs A, Mazilu D, Anderson JH, Masamune K, Taylor AH, Stoianovici D: System
for robotically assisted prostate biopsy and therapy with intraoperative guidance. Acad Radiol 2002, 9:60-74.
15. Bott SRJ, Henderson A, Halls JE, Montgomery BI, Laing R, Langley SEM: Extensive transperineal template biopsies of
prostate: modified technique and results. Urology 2006, 68:1037-1041.
16. Moran BJ, Braccioforte MH, Conterato DJ: Re-biopsy of the prostate using a stereotactic transperineal technique.
J Urol 2006, 176:1376-1381.
17. Merrick GS, Taubenslag W, Andreini H, Bammer S, Butler WM, Adamovich E, Allen Z, Anderson R, Wallner KE: The
morbidity of transperineal template-guided prostate mapping biopsy. BJU Int 2008, 101:1524-1529.
()
()
(/)
(/)
PoD
finite
PoD
point
T
T
==
⎛
⎝
⎜
⎞
⎠
⎟
Ds
DS
S
s
2
2
2
(A11)
Received: 1 December 2009 Accepted: 17 June 2010
Published: 17 June 2010
This article is available from: 2010 Kepner and Kepner; licensee BioMed Central Ltd. This is an Open Access article distributed under the terms of the Creative Commons Attribution L icense ( which permits unrestricted use, distribution, and reproduction in any medium, provided the original work is properly cited.Theoretical Biology and Medical Modelling 2010, 7:23
Kepner and Kepner Theoretical Biology and Medical Modelling 2010, 7:23
/>Page 13 of 13
18. Moran B, Braccioforte M: Stereotactic transperineal prostate biopsy. Urology 2009, 73:386-389.
19. Mohan P, Ho H, Yuen J, Ng WS, Cheng WS: A 3D computer simulation to study the efficacy of transperineal versus
transrectal biopsy of the prostate. Int J Comput Assist Radiol Surg 2007, 1:351-360.
20. Abolhassani N, Patel R, Ayazi F: Minimization of needle deflection in robot-assisted percutaneous therapy. Int J
Med Robot 2007, 3:140-148.
21. Blumenfeld P, Hata N, DiMaio S, Zou K, Haker S, Fichtinger G, Tempany CM: Transperineal prostate biopsy under
magnetic resonance image guidance: a needle placement accuracy study. J Magn Res Imaging 2007, 26:688-694.
22. Tempany CM, Straus S, Hata N, Haker S: MR-guided prostate interventions. J Magn Res Imaging 2008, 27:356-367.
23. Muntener M, Patriciu A, Petrisor D, Schar M, Ursu D, Song D, Stoionovici D: Transperineal prostate intervention:
Robot for fully automated MR imaging-system description and proof of principle in a canine model. Radiology
2008, 247:543-549.
24. Ho H, Mohan P, Lim E, Li D, Yuen J, Ng W, Lan W, Cheng C: Robotic ultrasound-guided prostate intervention
device: system description and results from phantom studies. Int J Med Robot 2009, 5:51-58.
25. Silletti JP, Gordon GJ, Bueno R, Jaklitsch M, Loughlin KR: Prostate biopsy: past, present and future. Urology 2007,
69:413-416.
26. Pepe P, Aragona F: Saturation prostate needle biopsy and prostate cancer detection at initial and repeat
evaluations. Urology 2007, 70:1131-1135.
27. Merrick GS, Gutman S, Andreini H, Taubenslaug W, Lindert DL, Curtis R, Adamovich E, Anderson R, Allen Z, Butler W,
Wallner K: Prostate cancer distribution in patients diagnosed by transperineal template-guided saturation
biopsy. Eur Urol 2007, 52:715-723.
28. Onik G, Miessau M, Bostwick DG: Three-dimensional prostate mapping biopsy has a potentially significant
impact on prostate cancer management. J Clin Oncol 2009, 27:4321-4326.
29. Taira AV, Merrick GS, Galbreath RW, Andreini H, Taubenslag W, Curtis R, Butler WM, Adamovich F, Wallnerk KE:
Performance of transperineal template-guided mapping biopsy in detecting prostate cancer in the initial and
repeat biopsy setting. Prostate Cancer Prostatic Dis 2009 in press. doi: 10.1038/pcan.2009.42
doi: 10.1186/1742-4682-7-23
Cite this article as: Kepner and Kepner, Transperineal prostate biopsy: analysis of a uniform core sampling pattern that
yields data on tumor volume limits in negative biopsies Theoretical Biology and Medical Modelling 2010, 7:23